2010 Round Ethnic Group Population Projections using the 2009
SHLAA
Background
GLA ethnic group population projections are produced by distributing the main GLA projections into ethnic groups at borough level. The projections in this Update have used the same 2009 Strategic Housing Land Availability Assessment (SHLAA) housing capacity data that were used in the 2009 Round of projections.
However, the 2010 Round has been created using a revised GLA borough level population projection model and revised borough household projection models which incorporate the relationships between population and household representatives as developed within the CLG 2008-based household projections published on the 26th November 2010 (see GLA Intelligence Update 27-2010). The projected fertility rate schedule used in the 2010 Round was a modified version of the ONS national fertility rate assumption, to take into account more recent trends in births. Further details of the main borough model revisions and the current fertility schedule are given in GLA Intelligence Update 01-2011.
In addition to revisions to the main borough population projection model, the ethnic projection model has also been revised to improve ethnic modelling of the migration components.
As a result of the revisions, the main borough model is now able to output separately total male and total female in-migration flows to each borough from the UK and from Overseas. These gender-specific inflows are therefore now constrained separately in the ethnic model. Previously the main borough model in-migration outputs were only available in terms of persons, and assumptions had to be made in the ethnic model regarding the male/female split.
Up to the 2009 Round, although the borough model was able to output gender-specific migration total outflows to the UK, there was no separate data available and hence no basis on which to model ethnic migration outflows to Overseas. Borough total male and total female outflows to the UK were therefore enhanced to account for the moves to Overseas before being used as constraints in the ethnic model.
ONS data are now available showing migration outflows from the UK to Overseas, by gender and single years of age, although not at borough level or by ethnicity. Despite the limitations of this data it provides gender age-structures for probabilities of migration to Overseas, and allows out-migration to Overseas to be modelled separately in the 2010 Round ethnic model. The out-migration outflow data used for probability structures was incorporated in the ONS 2008-based National Population Projections for 2014-15, this projection year being the year by which projected probability structures become stable. In the revisions to the 2010 Round borough model the capability to output gender-specific total outflows to Overseas was added, and these are used as constraints in the ethnic model. Gender-specific migration outflows to the UK are modelled in the ethnic model as before, using the corresponding UK constraints output by the borough model, but without the need to uplift.
The GLA ethnic group projections have been modelled mainly using 2001 Census data, still the most detailed source for information on ethnicity. Therefore modelled output incorporates demographic
GLA Intelligence Update
DMAG Demography Team
Update
04-2011
March 2011
trends current as at 2001. Specifically, most migration flow structures relate to moves between 2000 and 2001, with the exception of migration outflows to Overseas which are now modelled as described above. More recent migration patterns will not be totally reflected in these projections, for example EU accession migration from Eastern Europe (A8). At present, while there are statistics relating to the estimated inflows of A8 persons to the UK, there are no official statistics on the number of these migrants moving to London, or on those remaining resident in the UK. However recent estimates of total international flows to and from each borough are incorporated.
The projection output is for ten ethnic groups that are aggregations of the 16 ethnic categories from the 2001 Census. Categories were aggregated to diminish the impact of statistical disclosure control on borough level 2001 Census results for smaller ethnic communities and their migration levels. As a result the three White categories were aggregated to one group. It should therefore be noted that this White group represents an ethnically diverse population and hence includes, amongst others, white British, Australians and Europeans such as the Irish and Poles.
Population outputs from the modelling process are available for the aggregated groups only. In the context of the GLA ethnic group classification the term BAME (Black, Asian and Minority Ethnic) is used to represent all ethnic groups other than the White group.
Greater London Results
The projected ethnic populations are summarised in Table 1, and changes between 2011 and 2031 are shown in Table 2. Between 2011 and 2031 London’s population is projected to increase by 940 thousand persons, equivalent to 12 per cent. The White population will increase by 5 per cent, whereas the BAME population as a whole will increase by 25 per cent. Among individual BAME groups the greatest increases by number will be 132 thousand persons in the Other group, 130 thousand Black Africans, and 102 thousand Indians. In terms of proportionate increases the greatest will be a 41 per cent increase in the Other group and a 32 per cent increase in the Chinese group, with Black African, Black Other, Pakistani, Bangladeshi and Other Asian populations each increasing by between 26 and 28 per cent.
Table 1: 2010 Round SHLAA: Summary Ethnic Group Population Projection for Greater London
2001 2006 2011 2016 2021 2026 2031 Total Population 7,336,900 7,559,900 7,900,500 8,314,900 8,581,900 8,745,600 8,840,100 White 5,216,100 5,131,000 5,188,400 5,327,800 5,404,000 5,440,400 5,454,000
Black Caribbean 351,000 358,500 371,200 388,000 399,600 408,100 414,800
Black African 389,700 455,200 509,800 565,100 602,200 625,900 639,900
Black Other 169,200 193,900 218,200 241,100 257,500 269,300 277,300
Indian 446,600 488,900 529,900 571,200 599,800 619,400 631,800
Pakistani 146,400 169,600 192,100 213,700 228,600 238,400 245,000
Bangladeshi 158,200 172,100 188,700 206,500 220,900 230,800 238,600
Other Asian 198,400 232,500 264,700 294,200 313,600 326,000 333,100
Chinese 82,400 100,600 115,500 130,100 140,300 147,300 152,000
Other 178,900 257,600 321,900 377,300 415,400 439,800 453,600
BAME* 2,120,800 2,428,900 2,712,100 2,987,100 3,177,900 3,305,200 3,386,100
* BAME denotes Black, Asian and Minority Ethnic (all groups except the White group) Figures may not add due to rounding
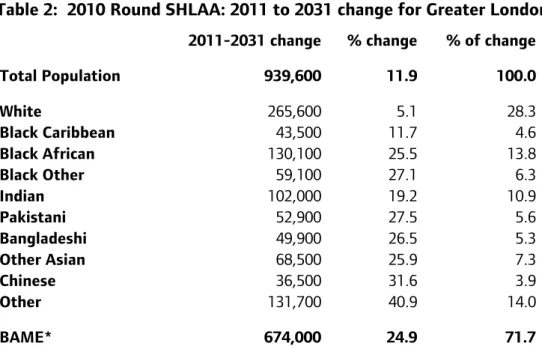
Table 2: 2010 Round SHLAA: 2011 to 2031 change for Greater London
2011-2031 change % change % of change Total Population 939,600 11.9 100.0
White 265,600 5.1 28.3
Black Caribbean 43,500 11.7 4.6
Black African 130,100 25.5 13.8
Black Other 59,100 27.1 6.3
Indian 102,000 19.2 10.9
Pakistani 52,900 27.5 5.6
Bangladeshi 49,900 26.5 5.3
Other Asian 68,500 25.9 7.3
Chinese 36,500 31.6 3.9
Other 131,700 40.9 14.0
BAME* 674,000 24.9 71.7
* BAME denotes Black, Asian and Minority Ethnic (all groups except the White group) Figures may not add due to rounding
In terms of composition of London’s total population increase, 28 per cent will be from the White population and 72 per cent from the BAME population as a whole. Among individual BAME groups the greatest components of the overall increase will be 14 per cent each from the Other group and Black Africans, and 11 per cent from the Indian population.
Figure 1 2010 Round SHLAA: Ethnic Group Population Projections for Greater London. All Ethnicities, White, and BAME
0 1,000,000 2,000,000 3,000,000 4,000,000 5,000,000 6,000,000 7,000,000 8,000,000 9,000,000 10,000,000
20
01
20
04
20
07
20
10
20
13
20
16
20
19
20
22
20
25
20
28
20
31
PE
RS
O
N
S
All Ethnicities
White
For more information please contact Ed Klodawski, Intelligence Unit,
Greater London Authority, City Hall, The Queen’s Walk, More London, London SE1 2AA
Tel: 020 7983 4694 e-mail: [email protected]
Borough Results
In Newham 60.7 per cent of its population in 2001 was from BAME groups, and this proportion is projected to increase to 74.9 per cent by 2031. In Brent 54.7 per cent of its population in 2001 was from BAME groups, and this proportion is projected to increase to 60.1 per cent by 2031. In three other boroughs it is projected that the BAME populations will reach 50 per cent over the projection period. Harrow is projected to have reached 50.2 per cent BAME in 2008, increasing to 60.7 per cent in 2031. Redbridge is projected to reach 50.5 per cent BAME in 2013, increasing to 58.1 per cent in 2031. Croydon is projected to reach 50.3 per cent BAME in 2026, increasing to 51.6 per cent in 2031.
Results by borough, ethnic group and five-year age band are available to download from the GLA London Datastore.
Availability of Data
GLA demographic data and a range of other data relating to London are available on the GLA London Datastore:
http://data.london.gov.uk/
The direct link for the GLA 2010 Round SHLAA ethnic group population projections is: http://data.london.gov.uk/datastore/package/egp-2010rnd-shlaa-borough
All GLA projections will be found at:
http://data.london.gov.uk/datastore/package/gla-demographic-projections