i
The Economic Impact on the Local Economy of Irrigated Agriculture in the
Paso Robles Area
and
Potential Impacts of the Sustainable Groundwater Management Act
Lynn Hamilton1 and
Michael McCullough2 Cal Poly, San Luis Obispo
August 28, 2020
Copyright 2020 by Hamilton and McCullough. All rights reserved. Readers may make verbatim copies of this document for non-commercial purposes by any means, provided that this copyright notice appears on all such copies.
ii
Acknowledgements
We appreciate the support and input from the following organizations who sponsored the work
iii
Table of Contents
List of Figures ... iv
List of Tables ... iv
Executive Summary ... v
Introduction ... 1
Wine and Viticulture Industry in the Paso Robles AVA ... 1
Data Collection and IMPLAN Modifications ... 5
Overview of SGMA and the GSP in the Paso Basin ... 8
Impact Scenarios on PR Subbasin Economy from Irrigated Agriculture Reductions ... 9
Impact Scenarios on Winery and Tourism Economy in the Paso Subbasin ... 11
Summary/Conclusions ... 13
iv
List of Figures
Figure 1 Map of Paso Robles American Viticulture Association... 2
Figure 2 District 8 Wine Grape Tons Crushed and Total Wine Grape Value ... 3
Figure 3 District 8 Wine Grape Acreage: Red, White and Total, 2011-2018 ... 3
Figure 4 Paso Subbasin Groundwater Sustainability Agency Boundary ... 8
Figure 5 PR Subbasin Jobs Lost with Water Reduction, PR AVA Grape Substitution ... 12
Figure 6 PR AVA Winery Jobs Lost with Water Reduction, PR AVA Grape Substitution ... 13
List of Tables
Table 1 Economic Snapshot of Paso Robles Subbasin and San Luis Obispo County, 2020 ... 4Table 2 Economic Comparison of Paso Region to SLO County Vineyard and Winery Sectors ... 5
Table 3 Paso Robles Subbasin Agricultural Acreage and Categories ... 7
Table 4 10% Reduction in Water, Economic Impact in Paso Robles Subbasin ... 10
Table 5 17% Reduction in Water, Economic Impact in Paso Robles Subbasin ... 10
Table 6 23% Reduction in Water, Economic Impact in Paso Robles Subbasin ... 10
Table 7 Economic Impact of Lost Wine Grape Production on Wineries and Entire PR Subbasin based on 5, 10 15% non-local grape substitution ... 11
v
Executive Summary
The purpose of this study is to analyze the economic impact of the agricultural and wine industry within the Paso Robles Subbasin and AVA and San Luis Obispo County and to assess the economic impact of potential changes in the agricultural industry as a result of the Paso Robles Subbasin Groundwater Sustainability Plan that will reduce water allocations and/or increase the cost of water in the basin from 2020 – 2040 and beyond.
The Groundwater Sustainability Plan submitted to the state Department of Water Resources notes that if water use and precipitation patterns continue, the basin will be in overdraft by 14,000 acre-feet annually, which is about 17% of the total draw from the basin, based on hydrologists’ reports. Groundwater is the only source of irrigation water for agriculture in the subbasin. We analyze scenarios in which 10%, 17% and 23% of current water use is reduced. We show the economic effects for both irrigated agriculture as well as the impacts of lost fruit production for wineries in the region.
The loss to the Paso Subbasin economy from reduced irrigated agriculture ranges from $49.5 million to $146.3 million in lost economic value and in terms of employment, losing between 459 and 1,289 jobs, depending on the water reduction. The economic impact of lost wine value is even more significant, resulting in $183.4 million to $458 million loss to the overall economy in the subbasin, and $83.8 million to $215.6 million in lost output value to Paso Robles wineries. Job losses are estimated at 1,358 to 3,351 across the PR Subbasin economy, because of the lost grower, wine producer and consumer sales and expenditures. The Paso Robles wine industry is estimated to lose 376 to 967 jobs.
The analysis provided here indicates that between 12% to 32% of the total economic value and jobs could be lost in the Paso Subbasin wine industry, and between 10% to 26% of all SLO County winery economic output and jobs. In terms of lost economic value to the overall agricultural economy, both our analysis and an independent study sponsored by the SLO County Agricultural Commissioner’s office show that the SLO County wineries contribute almost $860 million to the overall SLO County economy. Our analysis indicates that between 21% and 53% of the total value of output could be lost from SLO County’s wine industry should water cutbacks occur. Irrigated agriculture overall will also have significant losses, with an estimated 4% to 11% decline in the total value of SLO County production agriculture.
This study is intended to provide an overview of potential economic impacts that may result from reductions to groundwater use for irrigated agriculture. The economic implications of water reductions are sizable and would cause a restructuring of the local business environment. This analysis may provide impetus for local officials to pursue alternatives for additional water supplies and find creative solutions to pursue groundwater sustainability in the Paso Robles Subbasin.
vi Table 1 10% Reduction in Water, Economic Impact in Paso Robles Subbasin
Change in Total Output Number of Jobs Lost
Low Value Crops -$60,119,684 -459
10% Across All Crops -$63,615,961 -560
High Value Crops -$49,541,448 -519
Table 2 17% Reduction in Water, Economic Impact in Paso Robles Subbasin
Change in Total Output Number of Jobs Lost
Low Value Crops -$95,394,009 -646
17% Across All Crops -$108,147,134 -953
High Value Crops -$84,220,463 -883
Table 3 23% Reduction in Water, Economic Impact in Paso Robles Subbasin
Change in Total Output Number of Jobs Lost
Low Value Crops -$125,629,144 -806
23% Across All Crops -$146,316,711 -1,289
High Value Crops -$113,945,332 -1,194
Table 4 Economic Impact of Lost Wine Grape Production on Wineries and Entire PR Subbasin
5% Non-local Grapes 10% Non-local Grapes
15% Non-local Grapes 10% Water Reduction -$199,180,593 -$191,304,849 -$183,429,105
17% Water Reduction -$338,607,009 -$325,218,243 -$311,829,478
23% Water Reduction -$458,115,365 -$440,001,153 -$421,886,941
Table 5 Economic Impact of Lost Wine Grape Production on PR Subbasin Wineries
5% Non-local Grapes 10% Non-local Grapes
15% Non-local Grapes 10% Water Reduction -$93,740,059 -$88,806,594 -$83,873,129
17% Water Reduction -$159,358,101 -$150,971,210 -$142,584,320
1
Introduction
Agriculture is an important industry in San Luis Obispo County. A recent study released by the San Luis Obispo Agricultural Commissioner measured agriculture’s overall economic contribution at $2.54 billion to the county, when accounting for the multiplier effects (Agricultural Impact Associates 2019). San Luis Obispo is the state’s 15th largest agricultural county, with an abundant variety of fruits,
vegetables, tree nuts, livestock and horticulture products. The value of agriculture surpassed $1 billion for the first time in 2018.
Even though the county is very diverse with respect to the number of crops grown, over 50% of value originates from two primary crops: wine grapes ($276 million) and strawberries ($268 million). Wine grapes are primarily grown in the North County, though there are several thousand acres in the South County; and strawberries are nearly exclusively grown in the South County (SLO County Agricultural Commissioner 2019).
San Luis Obispo County agriculture relies nearly exclusively on precipitation and groundwater supplies. According to the Department of Water Resources, the Central Coast uses the highest proportion of ground water in the state; 84% of the water supply comes from aquifers. The Sustainable Groundwater Management Act of 2014 requires that critically overdrafted groundwater basins reach sustainability by 2040. The Paso Robles Subbasin is classified as critically overdrafted, and local officials must develop plans to either reduce groundwater use, increase groundwater recharge rates, or both, over the next two decades.
Because local irrigated agriculture depends so heavily on groundwater resources, any water reduction is expected to have economic repercussions across the industry. The purpose of this study is to assess the economic impact of potential changes in the agricultural industry as a result of the Paso Robles Subbasin Groundwater Sustainability Plan that may reduce water allocations and/or increase the cost of water in the basin from 2020 – 2040 and beyond.
Wine and Viticulture Industry in the Paso Robles AVA
2 Figure 1 Map of Paso Robles American Viticulture Area
Source: Paso Robles Wine Country Alliance
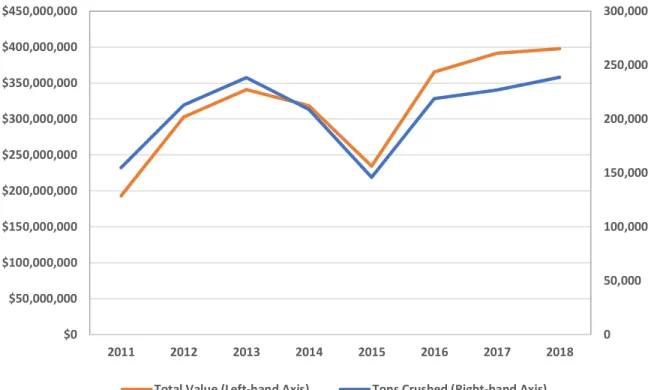
3 Figure 2 District 8 Wine Grape Tons Crushed and Total Wine Grape Value
Figure 3 District 8 Wine Grape Acreage: Red, White and Total, 2011-2018
Source: CDFA Grape Crush Report 2019
0 50,000 100,000 150,000 200,000 250,000 300,000
$0 $50,000,000 $100,000,000 $150,000,000 $200,000,000 $250,000,000 $300,000,000 $350,000,000 $400,000,000 $450,000,000
2011 2012 2013 2014 2015 2016 2017 2018
Total Value (Left-hand Axis) Tons Crushed (Right-hand Axis)
0 10,000 20,000 30,000 40,000 50,000 60,000
2011 2012 2013 2014 2015 2016 2017 2018
4 Clearly, acreage has grown over the time period, as has the total value of wine grapes produced. As of 2017, San Luis Obispo County had 32,559 acres of bearing grapes, Santa Barbara County had 22,929 acres and Ventura County had 359 acres (CDFA).
It may be helpful to provide context for agriculture’s contribution within the greater San Luis Obispo and North County economies. While a detailed description of the economic factors at work in the local economy are beyond the scope of this project, we are able to provide a snapshot of the overall economy as well as the contribution of the wine and viticulture industry to both the PR AVA as well as for San Luis Obispo County using IMPLAN.
IMPLAN is an integrated economic modeling software and data set that provides linkages among economic sectors. We used the 2017 data set for San Luis Obispo County (the most recent available at the start of the project). We created an economic region in the Paso Robles Subbasin by aggregating the nine zip codes therein; IMPLAN data is available at the zip code level. All values have been updated to 2020 values using an inflation factor within IMPLAN.
IMPLAN estimates the multiplier effects of an industry throughout an economy, using direct, indirect and induced impacts which are measured as a dollar value. Direct effects measure the immediate output of an industry and are determined by the inputs that an industry uses. Indirect effects are generated by the primary industries’ purchase of goods and services as inputs. Induced effects, also called the wealth effect, measure the impact of consumer incomes that are spent in the economy. These ripple effects are used to quantify the value of outputs, labor income, jobs, and value added before and after changes occur in an industry.
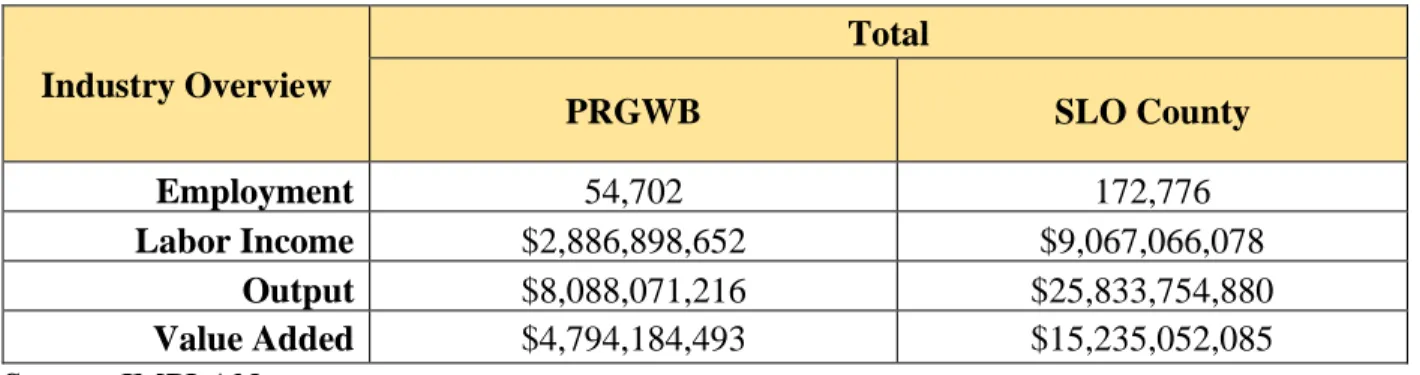
Table 1 shows the total employment across all economic sectors in both the Paso Subbasin as well as the entire economy. Employment is the number of full-time equivalent jobs in all economic sectors; labor income is the value of employee wages, output is the total value of production and value added can be considered the measure of “new” value generated by creating new combinations of purchased inputs into higher value final products. The Paso Subbasin is responsible for about 32% of the total economic value in all of San Luis Obispo County.
Table 1 Economic Snapshot of Paso Robles Subbasin and San Luis Obispo County, 2020
Industry Overview
Total
PRGWB SLO County
Employment 54,702 172,776
Labor Income $2,886,898,652 $9,067,066,078
Output $8,088,071,216 $25,833,754,880
Value Added $4,794,184,493 $15,235,052,085
Source: IMPLAN
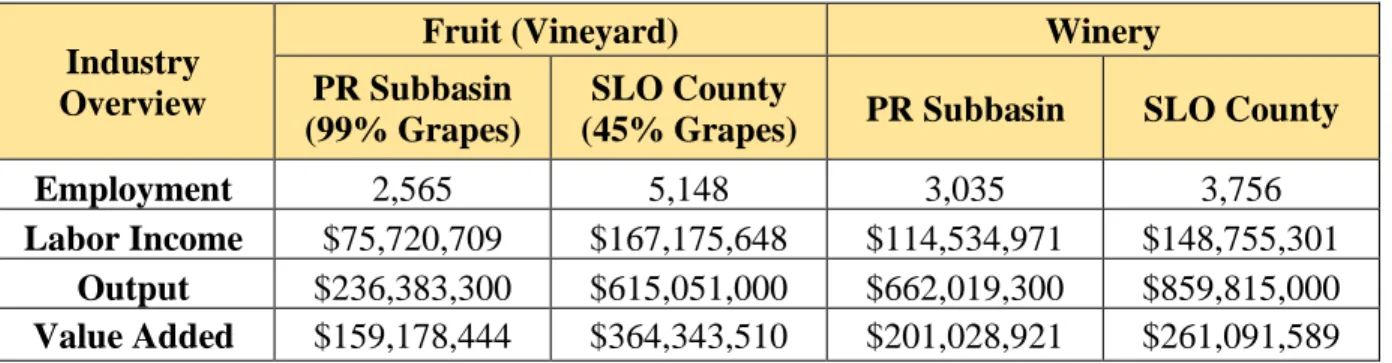
5 acreage was wine grapes, while countywide wine grapes comprised about 45% of the total fruit acreage. As compared to the entire county, the Paso area vineyards are responsible for almost 50 percent of the county’s employment within the fruit sector, and the industry pays 45% of the labor income. These figures do not include supporting industries for agriculture such as chemical and irrigation companies. Vineyards account for 38% of the county’s fruit output value, but almost 44% of the value added. The values are much higher when comparing the Paso region as compared to SLO for winery economic impacts. Wineries in Paso are responsible for 81% of the county’s winery employment, and 77% of labor income, output and value added attributed to the county wine industry. Wineries in the Paso region contribute over $660 million dollars in total revenue and contribute another $201 million in value-added because of the premium associated with PR AVA wines. In all of SLO County, wineries contribute almost $860 million, and add up to over $1 billion in value when the value-added component is considered. Our county-level findings are consistent those recently released by the 2019 SLO County Ag Commissioner’s Crop Report Plus that documents the economic contributions of SLO County agriculture.
Table 2 Economic Comparison of Paso Region to SLO County Vineyard and Winery Sectors
Industry Overview
Fruit (Vineyard) Winery
PR Subbasin (99% Grapes)
SLO County
(45% Grapes) PR Subbasin SLO County
Employment 2,565 5,148 3,035 3,756
Labor Income $75,720,709 $167,175,648 $114,534,971 $148,755,301
Output $236,383,300 $615,051,000 $662,019,300 $859,815,000
Value Added $159,178,444 $364,343,510 $201,028,921 $261,091,589
Source: Values were estimated by authors by applying input-output multipliers generated in IMPLAN and using input values generated by industry respondents to project questionnaire.
Data Collection and IMPLAN Modifications
IMPLAN is a very useful tool for economic impact analysis, but the data set and the accompanying economic linkages between industries require modification, particularly when dealing with a high-value and integrated industry such as wine and viticulture. A recent Napa County wine industry economic impact study highlighted several deficiencies with IMPLAN and provided insight on how to correct the problems (Stonebridge 2017). IMPLAN incorporates about a dozen state and federal data sets,
including the U.S. Census, the Bureau of Labor Statistics, the Bureau of Economic Analysis and the U.S. Department of Agriculture, among others. However, data regarding agriculture at the federal level is aggregated into categories – for example, wine grapes are classified in the “fruit” category. IMPLAN tends to treat all fruit the same, without recognition of various prices based on AVA classifications, or the value added during processing into wine.
6 the linkages between wineries and tourism. It’s a unique relationship in the agricultural industry; no other agricultural entity can attract the same level of high-value tourism. Though a thorough analysis of tourism and the region’s wine industry is beyond the scope of this project, the impact of tourism will appear in the assessment of various economic factors.
In order to better understand the economic linkages in the wine industry, we updated a questionnaire used in the 2015 study by Matthews and Medellin-Azuara to include water use and tourism questions. Paso Robles Wine Country Alliance sent the survey to its members, both vineyard and wineries. The respondents represented 15% of the grapes grown and wine produced in the PR AVA. We used the findings from the survey to adjust the IMPLAN model to increase the local usage of inputs as appropriate, as well as adjust the values of labor based on higher labor wages in California. We also modified the percentage of local grape usage in the wine industry, which was higher than the IMPLAN model suggested. In addition, we increased the percentage of local demand for PRAVA wines based on survey results.
We also were able to access San Luis Obispo County Agriculture Commissioner data for 2018 at the zip-code level to improve IMPLAN’s agricultural database. IMPLAN’s data set is generally sufficient for state or county-level analysis, but at the zip code level, it typically misrepresents the distribution of crops and livestock within a county. Since we were interested in the agricultural economy of the Paso Robles Subbasin, we were able to use specific, GIS-level data to appropriately attribute the crop and livestock acreage to the study area zip codes. We also knew whether the crop was produced on
7 Table 3 Paso Robles Subbasin Agricultural Acreage and Categories
Agricultural Production Categories Acres
All other crop farming 2,081
Alfalfa 1,267
Industrial/Unclassified 814
Animal production, except cattle and poultry and eggs 4
Bees/Livestock 4
Beef cattle ranching and farming 34,442
Pastureland 834
Rangeland 33,608
Fruit farming 37,992
Grape 37,521
Olive 383
All other tree fruit 43
Grain farming 36
Wheat 36
Greenhouse, nursery, and floriculture production 10
Horticulture 10
Landscape and horticultural services 716
Landscape 716
Tree nut farming 698
Almond/Walnut 62
Pistachio 637
Vegetable farming 26,253
Field Crops 26,134
Leafy Greens 119
Dairy cattle and milk production 23
Forage 23
8
Overview of SGMA and the GSP in the Paso Basin
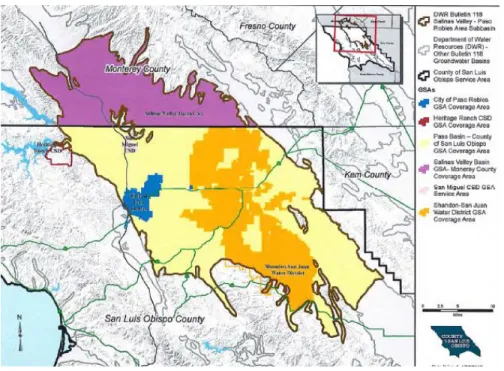
The Central Coast (including Monterey, San Luis Obispo, Santa Barbara and Ventura) relies primarily on groundwater for irrigation sources. In the middle of a prolonged drought from 2012 to 2019, the state legislature passed The Sustainable Groundwater Management Act (SGMA) of 2014 which calls for local regulation of groundwater. Of the 515 basins in California, 127 were considered to be medium to high priority, with some high priority basins designated as being in a critical state of overdraft (Bruno 2017). These 127 basins were required to create Groundwater Sustainability Agencies (GSAs) which are tasked with developing Groundwater Sustainability Plans (GSPs). GSAs must develop GSPs by 2022 for high and medium priority subbasins, and by 2020 for high priority subbasins that are in a state of critical groundwater overdraft. Subbasins must be sustainably managed by 2042 for high and medium priority subbasins, and by 2040 for high priority subbasins that are critically overdrafted. Paso Robles Subbasin is considered by the Department of Water Resources to be critically overdrafted. A GSP was submitted to the DWR in January 2020. Figure 4 shows the boundaries of the Paso Robles Subbasin.
Figure 4 Paso Subbasin Groundwater Sustainability Agency Boundary
Source: San Luis Obispo County Paso Robles Subbasin GSP Appendices
The Paso Robles Subbasin GSP notes that if current pumping rates continue, groundwater storage will decline by nearly 14,000 acre-feet per year. The law requires basin sustainability plans to avoid what are known as the “six sins of SGMA” which are reduced ground water levels, decreased ground water storage, increased sea water intrusion, water quality degradation, land subsidence and depleted surface water supplies.
9 necessary, mandatory pumping limitations in specific areas. The GSP presents possibilities for a variety of other management actions, including building new infrastructure for surface water projects.
Impact Scenarios on PR Subbasin Economy from Irrigated Agriculture
Reductions
The Paso Robles Subbasin must reach a sustainable level of groundwater use by 2040. Discussions with local agricultural industry, wine and water district representatives led to a decision to analyze scenarios involving 10%, 17% and 23% cutbacks to current water usage in the basin. The acre feet corresponding to those reductions are 7,153 ac/ft, 12,160 ac/ft and 16,452 ac/ft respectively. These percentage
reductions are supported by the documentation submitted to the Department of Water Resources. However, because there is no prescription in the GSP for how the water restrictions might occur, we investigated three scenarios in which water reductions are implemented:
a) Low value irrigated crops only (alfalfa and unclassified crops) b) Percentage reduction evenly spread across all irrigated crops c) High value crops only (wine grapes and other fruit)
This approach required running the IMPLAN model nine times. The first analysis only deals with the impact based on reductions in agricultural production. We used data from the San Luis Obispo
Agricultural Offset Ordinance for guidance on water use for SLO County crops and estimated the water used per crop in the Paso Subbasin. We then reduced the crop acreage and subsequent value of
production in each of the three crop categories. Tables 4-6 show these results.
IMPLAN uses multipliers to estimate the economic implications of a change in production in an industry. We present the estimated changes in total output, based on the following three effects measured by IMPLAN, after we customized the dataset and industry linkages.
Direct effects measure the impacts on output of the industry in question and is simply measured as price multiplied by quantity of the products produced in an industry. If grape production increases by $5 million, then the direct effect to the region is an additional $5 million.
Indirect effects are generated by the primary industries’ purchase of goods and services as inputs. For agriculture, this would include purchases of irrigation supplies, management services, chemicals, etc. This is the first ripple, or multiplier effect of an industry
Induced effects, also called the wealth effect, measure the impact of consumer incomes that are spent in the economy. For example, when the farm economy is strong and growers are producing more These ripple effects are used to quantify the value of outputs, labor income, jobs, and value added before and after changes occur in an industry.
The values we report here are the sum of the direct, indirect and induced effects on the total value of output for each scenario.3
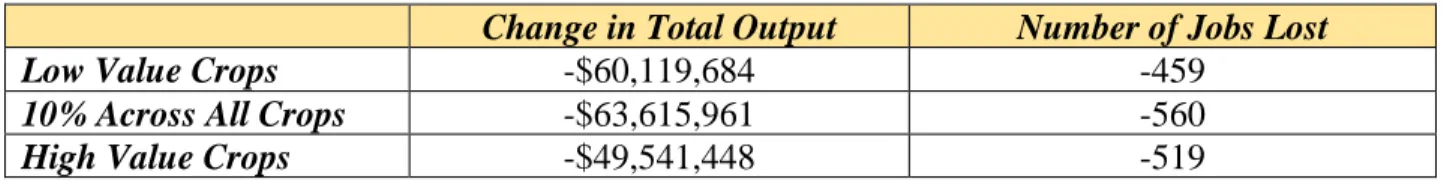
10 Table 4 10% Reduction in Water, Economic Impact in Paso Robles Subbasin
Change in Total Output Number of Jobs Lost
Low Value Crops -$60,119,684 -459
10% Across All Crops -$63,615,961 -560
High Value Crops -$49,541,448 -519
Table 5 17% Reduction in Water, Economic Impact in Paso Robles Subbasin
Change in Total Output Number of Jobs Lost
Low Value Crops -$95,394,009 -646
17% Across All Crops -$108,147,134 -953
High Value Crops -$84,220,463 -883
Table 6 23% Reduction in Water, Economic Impact in Paso Robles Subbasin
Change in Total Output Number of Jobs Lost
Low Value Crops -$125,629,144 -806
23% Across All Crops -$146,316,711 -1,289
High Value Crops -$113,945,332 -1,194
The 10% reduction resulted in economic losses of $49.5 to $63.6 million and job losses from 459 to 560, depending on which types of crops lose water resources. The 17% water reduction showed that the PRS would lose $84.2 to $108.1 million in economic output as well as 646 to 953 jobs. The highest water cutbacks, 23%, showed an economic output loss of $113.9 million to $146.3 million and between 806 and 1,289 lost jobs. These are the combined effects not only of the loss of production value, but the lost service and input purchases that growers would use, as well as the lost spending power on consumer goods and services in the economy.
Because low-value crops comprise relatively few acres in the region, all of the alfalfa and unclassified crops were eliminated in each of the low-value crop water scenarios and a portion of the next highest value crops were reduced, which were vegetables and field crops. The scenarios with the highest value loss were those in which all cultivated agriculture was reduced by the respective percentage. Even though some of the types of crops have small acreage (such as tree nuts or landscape/horticulture), they have high value. The wide variety of crops produced in the Paso Subbasin means that growers use many specialized inputs and services to produce their crops; sales would decline for all of those input
11
Impact Scenarios on Winery and Tourism Economy in the Paso Subbasin
The first round of analysis examined the impact of lost agricultural production on the PR Subbasin’s overall economy. In order to estimate the lost value of wine grapes from water reductions on the wine industry and affiliated industries such as tourism, we had to run the models again, this time reducing the value of the wine grapes and measuring the subsequent impact on wineries and related industries. This also required running several different scenarios. Because Paso Robles AVA wines and wine grapes are high quality, they command a price premium (e.g. $1,400/ ton vs $790/ton statewide average (CDFA)). However, to maintain AVA designation, a wine must contain at least 85% of grapes from that AVA. IMPLAN considers local vs. nonlocal inputs to be direct substitutes, which cannot be the case with geographic wine designations. To override IMPLAN’s estimation, we only allowed non-local substitution of grapes at three different levels: 5%, 10% and 15%.
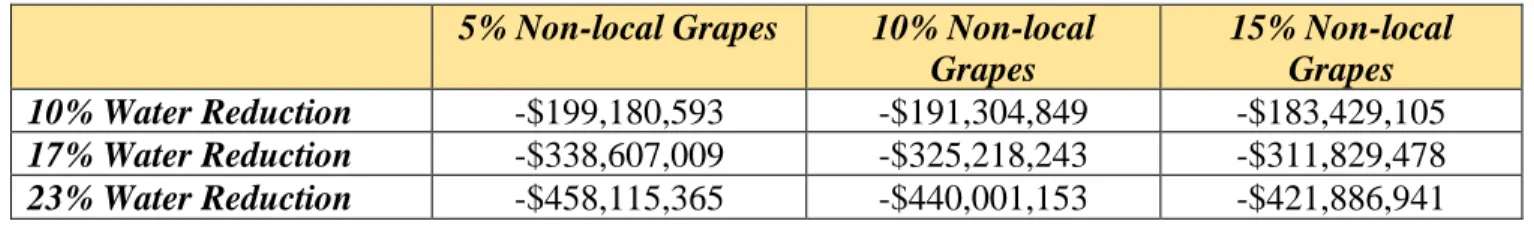
We combined the irrigated agriculture reduction scenarios and customized IMPLAN’s local input use values so that only 5 to 15% of the lost local grapes could be substituted with grapes from outside the AVA, for a total of 27 model runs. For brevity, we only present the set of scenarios in which all of the water was removed from high value fruit crops, which were primarily wine grapes.4 The results, shown in Tables 7 and 8 and Figures 5 and 6 show the results in economic impact losses and job losses to the overall PR Subbasin economy as local wine grape losses affect the output of local wineries.
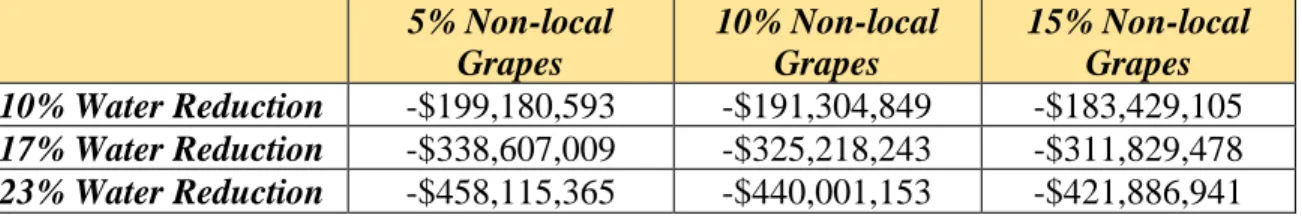
Table 7 Economic Impact of Lost Wine Grape Production on Wineries and Entire PR Subbasin based on 5, 10 15% non-local grape substitution
5% Non-local Grapes
10% Non-local Grapes
15% Non-local Grapes 10% Water Reduction -$199,180,593 -$191,304,849 -$183,429,105
17% Water Reduction -$338,607,009 -$325,218,243 -$311,829,478
23% Water Reduction -$458,115,365 -$440,001,153 -$421,886,941
The results show that the impacts are greatest when only 5% of the local grapes are substituted by non-local grapes. This would result in lower overall production by the wineries, and the higher the water cutbacks, the greater the loss of economic value. If 15% of the lost grape production can be replaced, then the impact isn’t as great because wineries can produce closer to their usual output of wine. However, the loss of local grape production means that there are fewer local goods and services being used in vineyards, wineries and related services. In all cases, about 78% of the lost economic value accrues to the wine grape and winery sectors, while the remaining 22% economic losses are borne by agricultural input industries as well as tourism-related industries such as restaurants and hotels. Again, these impacts total the direct, indirect and induced effects across the Paso Subbasin economy.
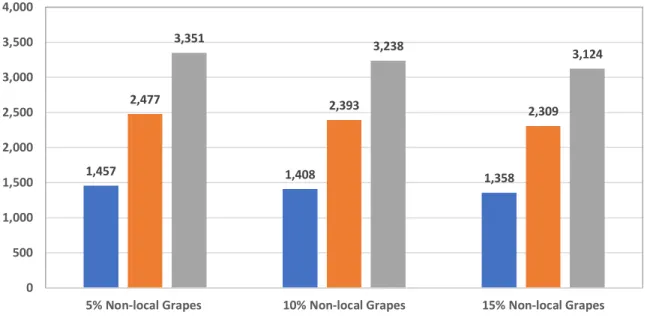
Measuring the impact on job loss provides another snapshot of the economic impact of water reductions on the greater Paso Subbasin economy. These results are shown in Figure 5.
12 Figure 5 PR Subbasin Jobs Lost with Water Reduction, PR AVA Grape Substitution
As shown with overall economic impact in Table 7, higher job losses are evident when there is lower substitution of non-local grapes. While wine grape demand is considered elastic, that is, grapes between growing regions are easily substituted based on price, up to the AVA 15% restriction (Fuller and Alston, 2012), if less non-local grapes are available to make up the shortfall in PR AVA wine grape production, winery output will fall. The jobs are primarily lost in the wineries, wine grape production, agricultural and winery support industries, and tourism-related industries. Table 8 and Figure 6 show the impacts particular to the wine industry in the Paso Robles Subbasin.
Table 8 Economic Impact of Lost Wine Grape Production on PR Subbasin Wineries
5% Non-local Grapes
10% Non-local Grapes
15% Non-local Grapes 10% Water Reduction -$93,740,059 -$88,806,594 -$83,873,129
17% Water Reduction -$159,358,101 -$150,971,210 -$142,584,320
23% Water Reduction -$215,602,136 -$204,255,167 -$192,908,198 The impacts depicted in Table 8 are nearly all direct effects, that is, the lost value of the grape production translates into lost winery output of $93.7 to $215.6 million when only 5% of non-local grapes can be substituted, and $83.8 million to $192.9 million in lost value if more grapes can be used from outside of the area. Thus, the losses to PR AVA wineries comprise about 47% of the total economic decline in the Paso Robles Subbasin region.
1,457 1,408 1,358
2,477 2,393
2,309 3,351
3,238
3,124
0 500 1,000 1,500 2,000 2,500 3,000 3,500 4,000
5% Non-local Grapes 10% Non-local Grapes 15% Non-local Grapes
13 Figure 6 PR AVA Winery Jobs Lost with Water Reduction, PR AVA Grape Substitution
Job losses from wineries are estimated to range from 376 to 967, depending on the proportion of water reduced and the level of non-local grapes used to make PR AVA wines (Figure 6). The jobs are nearly all lost directly from the wineries.
Summary/Conclusions
The economy of the Paso Robles Subbasin has become heavily dependent on irrigated agriculture for local livelihoods. High value crops such as wine grapes, fruit and nut trees, as well as vegetables and field crops provide jobs and income not only for the growers and employees who work for the
agricultural operations, but for the agricultural support industries such as seed, chemical and equipment suppliers; accounting, legal and management services, as well as the agricultural lending industry, among many others. The wine industry is heavily developed, with over 200 wineries in the study area, up from five when the PR AVA was established in 1983. Over the past 25 years, the Paso area has gained fame as a wine tourism destination, serviced by high-end hotels, restaurants and wine tourism businesses.
The Paso Robles Subbasin, classified as a critically overdrafted groundwater basin, must reach
sustainability by 2040. The Groundwater Sustainability Plan submitted to the state Department of Water Resources notes that if water use and precipitation patterns continue, the basin will be in overdraft by 14,000 acre-feet annually, which is about 17% of the total draw from the basin, based on hydrologists’ reports. Groundwater is the only source of irrigation water for agriculture in the PRS; surface water availability is minimal and is contracted for municipal use.
The GSP does not call for specific management practices to reduce water use; it relies on best management practices and voluntary fallowing of land before introducing potential managed water
420 398
376 715
677
639 967
916
865
0 200 400 600 800 1,000 1,200
5% Non-local Grapes 10% Non-local Grapes 15% Non-local Grapes
14 reductions. In lieu of specific policy prescriptions, we estimated water reductions of 10%, 17% and 23% on various types of agriculture. Our analysis shows a range of lost economic value from $49.5 million and 459 jobs lost to $146.3 million and 1,289 jobs lost, depending on the water reduction. When
considering the loss to economy based on losses to production agriculture, the scenarios in which water is reduced evenly across all agricultural production shows the most significant impact. Because
agriculture is so varied in the subbasin, every producer would lose income and all agricultural input suppliers and service providers would lose sales, which would cause reduced spending throughout the economy.
Because the wine grape industry is very integrated with all wineries using a large proportion of local grapes, we also analyzed the impact of lost fruit production on wineries in the Paso Subbasin, which is approximately the same region as the Paso Robles AVA. For each water reduction of 10%, 17% and 23%, we estimated what would happen if the PR AVA had to substitute non-local grapes to continue to produce PR AVA wine. All AVA designated wine must contain at least 85% grapes from that AVA. We estimated the impact if wineries could only substitute 5%, 10% or 15% non-local grapes to make up for the shortage in locally produced fruit.
The economic losses were even more significant, resulting in $83.8 million to $215.6 million in lost output value to PR AVA wineries, and $183.4 million to $458 million loss on the overall economy. The latter economic impact includes service providers to the agricultural and wine industries, as well as the lost value of tourism dollars. Job losses are estimated at 376 to 967 in the wine industry alone, and that expands to 1,358 to 3,351 across the PR Subbasin economy, because of the lost grower, wine producer and consumer sales and expenditures.
To provide perspective for these job losses, in Table 2 we provided a snapshot of the entire economy for both the Paso Subbasin and San Luis Obispo County vineyard and winery employment and total
economic output. The analysis provided here indicates that between 12% to 32% of the total economic value and jobs could be lost in the Paso Subbasin wine industry, and between 10% to 26% of all SLO County winery economic output and jobs. In terms of lost economic value to the overall agricultural economy, both our analysis and an independent study commissioned by the SLO County Agricultural Commissioner’s office show that the SLO County wineries contribute almost $860 million to the overall SLO County economy. Our analysis shows that between 21% and 53% of the total value of output could be lost from SLO County’s wine industry should water cutbacks occur. Irrigated agriculture overall will also have significant losses, with an estimated 4% to 11% decline in the total value of SLO County production agriculture.
15
References
Agricultural Impact Associates. “Economic Contributions of San Luis Obispo Agriculture” Crop Report Plus October 2019. Available at www.slocounty.ca.gov
Bruno, E. “California’s New Groundwater Law and the Implications for Groundwater Markets.” ARE Update 20(4) (2017):1-4. University of California Giannini Foundation of Agricultural Economics.
California Department of Food and Agriculture. Grape Crush Report Crop Year 2018. August 16, 2019. Available at: https://www.nass.usda.gov/Statistics_by_State/California
Fuller, K. and J. Alston (2012). “The Demand for California Wine Grapes” Journal of Wine Economics. Vol. 7, Issue 2. pp. 192-212. DOI: https://doi.org/10.1017/jwe.2012.15
GSI Water Solutions, Inc. “Paso Robles Subbasin First Annual Report (2017-2019).” Paso Basin
Cooperative Committee and the Groundwater Sustainability Agencies. January 27, 2020. Available
at www.slocounty.ca.gov/Departmetns/Public-Works
Matthews, W.A. and J. Medellin-Azuara. (2015) The Economic Impacts of the San Luis Obispo County and Paso Robles AVA Wine Industry. Available at https://pasowine.com/economic-impact
Paso Robles Wine Country Alliance. Paso Robles American Viticulture Area and 11 Sub AVAs Map. Available at: https://pasowine.com/paso-robles/ava/
Paso Robles Subbasin Groundwater Sustainability Agencies. Paso Robles Subbasin Groundwater Sustainability Plan. January 31, 2020. Available at: https://sgma.water.ca.gov/portal/gsp/preview/35
San Luis Obispo County Department of Agriculture 2019 Annual Report.
Stonebridge Research Group LLC (2017). The Economic Impact of Napa County’s Wine and Grapes, 2016. Prepared for Napa Valley Vintners. Available at: