Education Outcomes, Party Contacting, and
Change in Party Identification
by
David C. Kershaw
A dissertation submitted to the faculty of the University of North Carolina at Chapel Hill in partial fulfillment of the requirements for the degree of Doctor of Philosophy in the Department of Political Science.
Chapel Hill 2009
Approved by:
George Rabinowitz, Advisor
Michele Hoyman, Reader
Thomas Carsey, Reader
Michael MacKuen, Committee Member
c
Abstract
DAVID C. KERSHAW: Education Outcomes, Party Contacting, and Change in Party Identification.
(Under the direction of George Rabinowitz.)
This dissertation presents three studies that challenge the conventional
understand-ing about the ways in which political elites influence citizens’ orientations toward, as
well as the citizens’ resources that bear upon, political participation. The studies
ques-tion assumpques-tions about the intent and consequences of elite behavior in three distinct,
but related substantive literatures. These literatures include: electoral contacting,
party identification formation, and state education outcomes.
The first study helps explain the long observed pattern where political elites
dis-proportionately contact the socioeconomically and politically advantaged during
elec-tions despite theory from the campaign mobilization literature that argues contacting
will have the most influence on individuals who are socioeconomically and politically
disadvantaged. This paradox is explained once one recognizes that contacting
dur-ing elections serves divergent goals that are tied to the election cycle and to election
competitiveness. Broadly speaking, contacting in elections should be seen as having
two participatory recruitment stages: a resource gathering stage-with resources coming
from the advantaged-and a mass-mobilization stage-where every vote counts only when
elections are competitive.
The second study challenges the idea that political parties and their operatives
only alter party identities through a few indirect mechanisms: strategic positioning on
issues and performance of elected officials. Rather, this study argues that campaign
contacts have the unanticipated consequence of offering opportunities for behavioral
reinforcement of citizens’ party identities.
The final study reassesses the racial discrimination explanation for the persistent
relationship between statewide diversity and poor education outcomes. While this
study reaffirms the existence of the pattern, a critical finding is that socioeconomic
status and other conventional explanations are better at predicting poor education
outcomes than state level diversity. By probing more deeply, this study also discovers
To Kathy, Murphy, Ken, and Bailie.
Acknowledgments
I am grateful to George Rabinowitz and Michele Hoyman for their encouragement,
guid-ance, hours, and friendship. These mentors have made me a better writer, researcher,
and scholar. I thank Kathy and Thomas Kershaw for giving the studies feedback from a
layman’s perspective, and for reading multiple drafts. Tom Carsey was kind enough to
give the papers careful review. Gary Henry, James Monogan, Sarah Shair-Rosenfield,
Cameron Morgan, members of the Duke-UNC American Politics Research Group,
con-ference participants, and a number of anonymous reviewers all gave helpful suggestions
that improved my research. Finally, thanks to my friends and family for all of their
Table of Contents
Abstract iii
List of Figures ix
List of Tables x
1 Introduction 1
2 Mobilizing the Mobilized: The Electoral Recruitment Paradox 4
2.1 Two Strategic Recruitment Stages . . . 5
2.2 Methodology and Measurement . . . 8
2.3 Resource Gathering Stage Analysis & Results . . . 12
2.4 Mobilization Stage Analysis & Results . . . 19
2.5 Discussion & Conclusion . . . 25
2.6 Operationalization of Concepts . . . 27
3 Campaign Contacts and The Formation of Party Identities 29 3.1 Campaign Influence on Partisanship . . . 29
3.2 Assessing Party Identity Change . . . 31
3.3 Model & Analysis - Independents, Leaners, & Weak Identifiers . . . 34
3.4 Model & Analysis - Strong Partisans . . . 43
3.5 Discussion & Conclusion . . . 46
3.6 Contacts and Party Identity Formation Between 2000 and 2004 . . . . 47
4 A Reexamination of the Role of Statewide Racial Diversity on Grade Promotion 54 4.1 Background . . . 55
4.2 Methods & Model . . . 59
4.3 Analysis of All Students’ Grade Promotion . . . 66
4.4 Black Students Grade Promotion Analysis . . . 70
4.5 White Grade Promotion Analyses - Districts With Black Students . . . 75
4.6 White Students Grade Promotion Analysis - Expanded . . . 77
4.7 Explaining Interstate Variation . . . 78
4.8 State Characteristics and State Policy . . . 79
4.9 Discussion & Conclusion . . . 83
4.10 Operationalization of Concepts . . . 85
List of Figures
2.1 Campaign Recruitment in the 2000 Presidential Election: January through November 6 . . . 11
2.2 Relationship between Income and Mobilization Contacts in Competitive and Uncompetitive Conditions, in the NAES 2000 Panel . . . 24
List of Tables
2.1 Predicting Resource Gathering Stage Contact with Individual and Con-textual Characteristics . . . 15
2.2 Predicted Probabilities of an Early Stage Contact for Different Com-binations of Income, Strength of Partisanship, Knowledge Levels, and Self-employment Status . . . 18
2.3 Predicting Mobilization Stage Contact with Individual and Contextual Characteristics . . . 21
2.4 Definitions of Independent Variables Used in the Analyses . . . 27
3.1 Democrat and Republican Contacts Among Partisans Subgroups in the 2000 Presidential Election . . . 35
3.2 Predicting Individuals Who Moved a step Up or Down the Seven Point Party Identification Scale During the 2000 Presidential Election . . . . 39
3.3 Predicted Probability that an Independent Moved a Step Democratic or Moved a Step Republican in 2000, by Contact and Vote Status . . . 42
3.4 Predicting Strong Partisans Who Weakened in Attachment to Their Par-ties in 2000 . . . 45
3.5 Predicting Individuals Who Moved a step Up or Down the Seven Point Party Identification Scale Between the 2000 and 2004 Presidential Elections 49
3.6 Predicted Probability that an Independent Moved a Step Democratic or Moved a Step Republican between 2000 and 2004, by Number of Contacts 50
3.7 Predicting Strong Partisans Who Weakened in Attachment to Their Par-ties Between 2000 and 2004 . . . 50
3.8 Predicted Probability that a Non-voting Strong Partisan Weakened Iden-tity between 2000 and 2004, by Number of Contacts . . . 51
3.9 Descriptive Statistics of Model Variables . . . 52
4.1 Descriptive Statistics of Model Variables . . . 63
4.3 Random Intercept Model of Factors Predicting the School District’s Black and White Cumulative Promotion Scores, 1999 to 2002 . . . 72
4.4 State-level Variation Explained by the Models . . . 79
4.5 Assessing the Relationship between State-level Characteristics and a Court Decision that Found State Education Financing Systems Uncon-stitutional (prior to 1994) . . . 81
4.6 Random Intercept Model Assessing the Relationship Between State-level Characteristics and Instructional Spending Per-pupil . . . 82
4.7 Definitions of Independent Variables Used in the Analyses . . . 85
Chapter 1
Introduction
My dissertation presents three studies that challenge the conventional understanding
about the ways in which political elites influence citizens’ orientations toward, as well
as the citizens’ resources that bear upon, political participation. The studies question
assumptions about the intent and consequences of elite behavior in three distinct, but
related substantive literatures. These literatures include: electoral contacting, party
identification formation, and state education outcomes.
The first study challenges the long held belief that political elites always set out
to disproportionately contact the socioeconomically and politically advantaged during
elections despite theory from the campaign mobilization literature that argues
contact-ing will have the most influence on individuals who are socioeconomically or politically
disadvantaged. While the evidence does persistently show that the advantaged are
dis-proportionately contacted during elections, I argue this disconnect between theory and
evidence is explained once one recognizes that contacting during elections serves
diver-gent goals that are tied to the election cycle and to election competitiveness. Broadly
speaking, contacting in elections should be seen as having two participatory recruitment
stages: a resource gathering stage-with resources coming from the advantaged-and a
Overall, I theorize that once we account for the conditional nature of recruitment
strate-gies, we should see that campaigns do contact a broad and representative segment of
society; even if this only occurs when elections are competitive.
In terms of the substantive influence of contacting, the literature portrays campaign
contacting as primarily altering political participation and vote choice. Further, the
literature also suggests the effects of contacting are generally limited. I take issue with
this characterization and argue that this literature underestimates the importance of
campaign contacts on political behavior and attitudes. Specifically, in my second study
I argue that campaign mobilization and recruitment efforts also have the unintended
consequence of altering party identities through behavioral reinforcement.
According to the behavioral reinforcement theory of party identification (Converse
& Markus, 1979), a citizen’s bond to a party is created and/or strengthened each time
he or she votes for that party. Since, campaign contacts are recognized to influence both
the turnout and vote choice decisions-two steps necessary for translating latent affect
into identity, I theorize that contacts must alter party identities, if only indirectly.
At the same time, I also argue the vote is not the only participatory opportunity
campaigns offer. If an important mechanism for identity formation is behaviorally
supporting a party, those performing other core campaign tasks (e.g., giving money)
should also develop stronger bonds to the parties. While this study establishes the
relationship between contacts and party identities, one implication of the theory (given
the persistence of party identities), is that campaign contacts may have effects on
participation and vote choice that last well beyond the current election.
The final study questions the degree to which state political elites in diverse states
are successfully able to place barriers that result in poor education outcomes for
mi-norities. At issue is the persistent relationship between statewide diversity and poor
education outcomes noted in the state politics literature. Although a variety of
explana-tions exist for this pattern, one influential strain of research–the Racial Diversity Theory
of State Politics–suggests this pattern results largely from discrimination in state level
politics (Hero & Tolbert, 1996; Hero, 1998; Hero, 2007). Unfortunately, this research
does not adequately account for the background of the students or local forces; the
factors the education outcomes literature says largely drive education outcomes. This
omission along with several other theoretical and methodological considerations leads
me to theorize that this prior research may overstate and/or mischaracterize the role of
statewide discrimination in education outcomes. I argue a better specified model will
show socioeconomic factors and other conventional explanations play a much greater
role in outcomes for all students than this research cedes.
While this study of elite behavior does not directly address a question of how elites
affect political behavior, it does directly impact the conclusions drawn from the political
participation literature. This literature generally concludes that racial disparities in
participation are modest to nonexistent once socio-economic status is accounted for
in the models (Verba, Schlozman, & Brady, 1995). However, this conclusion may be
premature if state actors are highly successful at instituting barriers that result in poor
Chapter 2
Mobilizing the Mobilized: The
Electoral Recruitment Paradox
The classic theory of participation recruitment suggests that parties and politicians
mobilize the people they know, those at the center of social contacts, those most likely
to effectively produce desired outcomes, and those likely to participate in response to
recruitment efforts (Brady, Verba and Schlozman, 1995; Nie, Juan and Stehlik-Barry,
1996; Verba, Schlozman and Brady, 1995). These characteristics represent individuals
with resources, deep social networks, capacity for action, and susceptibility to
recruit-ment effort (Brady, Verba and Schlozman, 1995; Nie, Juan and Stehlik-Barry, 1996;
Rosenstone and Hansen, 1993; Verba, Schlozman and Brady, 1995). That is, “the
wealthy, the educated, and the partisan” (Rosenstone & Hansen, 1993, p.32).
At the same time, researchers also argue that elections are ultimately about votes,
and theory indicates that those who have the most potential for participation will likely
vote without prompting and others will not vote even if encouraged (Brady, Schlozman
and Verba, 1999; Rosenstone and Hansen, 1993). Thus, rational prospectors should
focus on those at the margins of participation. If participatory mobilization has the
why would much of the literature assume, and survey evidence show, that elites are
disproportionately recruited to participate in elections (Abramson and Claggett, 2001;
Gershtenson, 2003; Krueger, 2006; Niven, 2002, 2004; Rosenstone and Hansen, 1993)?
2.1
Two Strategic Recruitment Stages
This paper sorts out this paradox by establishing that participatory recruitment during
elections serves several divergent but complimentary goals that are explicitly tied to
the timing within the election cycle and the competitiveness of the election. Broadly
speaking, elections should be seen as having two recruitment stages: the first a resource
gathering stage, and the second a mobilization stage.
The resource gathering stage involves the preelection day organizational buildup
and operation. From early in an election until election day, a campaign must establish
and maintain a basic organizational structure designed to respond to developments in
the environment and to achieve the campaign’s election goals. This means two things
from a participant recruitment standpoint.
First, campaigns need to find activists to run all aspects of the operation. This
includes everything from running the phone banks to making strategic resource
allo-cation decisions. However, campaigns do not want just anyone filling these positions.
The ideal participants have commitment and capacity; they are willing and able to
effectively complete the tasks they are given.
Second, commitment and capacity alone are insufficient to win elections. Campaigns
also need cash to fund the activities of the campaign operatives. Simply, campaigns
need those willing and able to give lots of money.
In sum, these operational resource needs force strategic elites to spend most of
the election seeking support from the committed, the skilled, and the wealthy. The
the classic socio-economic and political elite, as these individuals are most likely to
have and to provide the resources the campaigns need (Brady, Schlozman and Verba,
1999; Brady, Verba and Schlozman, 1995; Fenno, 1978; Nie, Juan and Stehlik-Barry,
1996; Rosenstone and Hansen, 1993; Verba, Schlozman and Brady, 1995).1
However, campaign resource recruitment needs change over the course of an election.
As election day nears, campaigns turn from focusing on recruiting activists and raising
money towards getting supporters to the polls. Yet, campaigns must make choices
about the nature and purposes served by the mobilization efforts. In effect, campaigns
need to ask themselves, “Is this election going to be close?” and related, “Is it worth
the time, effort and money to launch a full vote mobilization effort?”
If the answer to both questions is yes, the election is competitive and the campaign
should direct mobilization efforts towards maximizing supporter turnout. Theoretically,
elites should use available information to mobilize marginal voters in order to maximize
turnout (Aldrich and Nelson, 1984; Brady, Schlozman and Verba, 1999; Rosenstone and
Hansen, 1993).2
Given that the campaigns have already recruited many of the habitual voters in the
resource gathering phase, campaigns could succeed in reaching the marginal voter by
1Note that campaigns do contact a broad swatch of the public during the vote identification phase.
However, campaigns try to prevent mobilizing out-partisans during the contact. Consequently, this approach results in many of the contacts being unaware of the contact, let alone being asked to participate.
2Marginal voters are those with around a 50 percent probability of voting. The literature assumes
some individuals are virtually certain to vote, while others are certain not to vote. The expectation of a nonlinear association between mobilization efforts and turnout presumably arises from a pattern of diminishing returns associated with the benefits (selective, solidary, or purposive) provided by the campaign contact. Extra benefits will not greatly add to the reasons for voting. These individuals already likely receive high levels of benefits from voting (i.e., those with a high sense of duty and strong partisan attachments, the habitual voter) and will vote regardless of the contact. Mobilizing them will not add votes to the candidates. Conversely, some individuals are likely to receive very low levels of benefits (i.e., a socially isolated individual with no civic duty who works three jobs) such that the benefits provided by the campaign will not greatly increase his vote probability. Mobilizing these individuals will also not add votes to the candidates.
targeting the remaining registered voters, regardless of their socio-economic status. The
unregistered clearly cannot help the candidate, as they have zero vote potential.
Mo-bilizing the unregistered represents a pure waste of resources. Targeting the remaining
registered voters as a strategy arises from the fact that a variety of factors (i.e., interest,
duty, issues, etc.) play an important role in the vote decision while they simultaneously
do not perfectly covary with socio-economics. Furthermore, each citizen’s mix of these
factors remains largely unknown to campaigns despite the early stage efforts.
Con-sequently, rational prospectors cannot simply recruit the center of the socio-economic
distribution and hope to reach the optimal targets. “Rational prospectors” (Brady,
Schlozman and Verba, 1999) should reach out to all registered voters relatively equally,
with contacting priorities made using any information they have acquired.
In contrast, as election day approaches, if an election appears to be uncompetitive,
campaigns will use their organizational structures to loosely mobilize in order to achieve
objectives other than vote maximization. Other present and future oriented objectives
served by vote mobilization may include: training, or building the morale of, the
cam-paign staff; maintaining or expanding their resources (or resource base) for the current
or future elections (Ansolabehere and Snyder, 2000; Box-Steffensmeier, 1996; Goodliffe,
2004); getting disabled partisans to the polls; and simply maintaining a certain vote
level.3 In fact, prior research fundamentally errs by failing to account for the fact that
vote maximization arguments are clearly germane only in competitive elections, and
by failing to recognize that inequalities in recruitment should emerge wherever vote
maximization does not strictly guide electoral recruitment strategies in the late stage.
Voters only carry equal weight when elites recruit participants to maximize the vote.
3Note that uncompetitive elections consistently show evidence of substantial contacting rates. For
The targeted recruit should be the socio-economically and/or politically advantaged if
the goal of the contact is some other participatory act.
The failure of prior research to recognize that campaigns have time and condition
varying resource needs–and, by implication, the failure to differentiate among key
sub-populations, recruited for distinct purposes at specific times in the election–may help
to explain the apparent socioeconomic bias seen in most studies of electoral
recruit-ment. At a minimum, studies of electoral recruitment must account for differences in
the strategic goals served by early, late-competitive, and late-uncompetitive election
recruitment efforts. Doing so will not only shed light on the strategic purpose and
tim-ing of different forms of recruitment, but should also show that elites strategically hunt
for resources and activists for most of the election before turning to vote mobilization
in the late stage. Further, this approach should show that elites only vote maximize
under truly competitive conditions.
2.2
Methodology and Measurement
To test these expectations I turn to the 2000 presidential election and the National
Annenberg Election Study (NAES) pre-post general election panel study. The NAES
focuses on a single election and uses a rolling cross-sectional design, providing the
ability to distinguish early contacts from late. The NAES also contains individuals
in both competitive and uncompetitive situations, allowing us to see how contacting
strategy varies with competitiveness.4 Unfortunately, the 2004 NAES does not ask the
appropriate questions to enable testing the theory, so the test is restricted to 2000.
This study separates the resource gathering stage analysis from the mobilization
stage analyses. For the purpose of this study, October 31, 2000 marks the beginning
4While the theory is applied in a presidential election, the patterns should manifest in any election.
of the mobilization stage and the end of resource gathering stage.5 Assuming that
the mobilization period starts just seven days before the general election follows other
mobilization research and recognizes that mobilization efforts close to elections are the
most effective (Nickerson, 2007).
Each stage analysis will use the same set of variables to predict whether an
individ-ual was contacted by either of the major parties in the specific stage. These analyses use
self-reported responses to the Annenberg pre and post “contact with the campaigns”
questions to establish who was contacted by the campaigns.6 The pre-election
con-tacting battery was used to create the contacted dependent variable in the early stage
analyses. Individuals who reported being contacted in the pre-election survey and were
interviewed prior October 31, 2000 were coded as early contacts. Individuals who only
report a contact in the post-election survey, or reported a contact in the pre-election
5The same substantive conclusions emerge under several alternative mobilization stage start dates–
such as three days before the general election, or state registration deadline. These results are available on request. Overall, NAES sampling resulted in only about 43% of the NAES panel being asked if they were contacted by the campaigns in the pre-election survey. All panel respondents were asked about contact with the campaigns in the post election survey. However, this study’s analyses focus on the subset of respondents who were asked about their contact with the parties in both waves.
6Unfortunately, the NAES uses two similar but different questions to gage respondents contact
with the campaigns in the pre and post election surveys. Up through November 6, 2000, the NAES asks respondents, “During the campaign, has anyone from one of the campaigns talked to you in person or on the phone about the presidential election?” After the election the NAES asks, “Dur-ing the campaign this fall, did any of the campaigns contact you about the presidential election?” The question wording shift could cause inter-stage comparability problems. Contacting could include countless forms of interaction including bulk mail, door hangers, phone calls, and face-to-face canvass-ing. Several considerations make this an unnecessary worry. First, people perform relatively shallow searches for information in order to answer poll questions (Zaller, 1992). We also know that the everyday environment individuals face contains far more stimuli than working memory can process (Steenbergen and Lodge, 2003a). Thus, available information includes only that which captured the
survey but were interviewed after October 30, 2000, were coded as late contacts.7
The existence of two separate participant contacting stages, and distinctiveness of
elite strategies, are strongly implied when we take a look at the simple monthly plots of
the percentage of the population who reported a campaign contact (see Figure 1.1). The
NAES rolling cross-section and panel data both establish that presidential campaigns
quickly seek out a small number of citizens (under five percent of the population) but
do not openly contact the vast majority of citizens until the very last moments of the
campaign.8 This pattern strongly suggests that mass vote mobilization did not occur
in the primary phase. Conversely, it is consistent with the idea that campaigns focus
their participatory recruitment activities on involving a core segment of the population
to handle most of their campaign needs.
7A small number of the individuals interviewed after October 31 in the pre-election survey reported
a campaign contact in the pre-election battery but did not report the contact in the post-election survey. Consequently, both questions were used to identify late contacted individuals.
8Figure 1 also shows that the panel data closely match the cross-section, speaking to the
gener-alizability of the panel data. It also suggests that large portions of the population simply are not forgetting they were primary mass-mobilized.
0
5
10
15
20
25
Probability of Contact
Jan Jun Oct Nov
Month
NAES Panel NAES Cross−section
2.3
Resource Gathering Stage Analysis & Results
The resource gathering stage analysis uses variables that reflect election relevant
in-formation, citizens’ geographic locations, citizens’ integration in their communities,
and the standard recruitment variables to predict early campaign contact.9 Income,
educational attainment, political knowledge, partisanship, and self-employment
sta-tus variables represent money, commitment, capacity, and the other resources desired
by political elites (Brady, Schlozman and Verba, 1999; Brady, Verba and Schlozman,
1995; Rosenstone and Hansen, 1993; Verba, Schlozman and Brady, 1995).10
Increas-ing levels of resources should coincide with an increased likelihood of beIncreas-ing contacted
in the resource gathering stage. While, (log of) length at residence, a set of place of
residence dummies, registration status, gubernatorial or senatorial election
competi-tiveness, native son, and disability status variables capture those factors shown to alter
the likelihood of being vote mobilized.11 The likelihood of being vote mobilized should
increase with length at residence, being registered to vote, living in a state with other
competitive elections, living in more urbanized areas, being disabled, and living in one
of the candidate’s home states. The fact that contextual differences in the likelihood of
being contacted emerge in the late stage (even in battleground states) reflects the
re-ality that campaigns cannot contact all potential voters. Thus, these variables capture
some of the strategies campaigns use to reach the most voters given limited (use of)
resources. For example, campaigns disproportionately target densely populated areas
9A description of each of the variables used in the analyses is found in Table 2.4 at the end of the
chapter.
10Self-employment status does not appear directly in prior research. However, its inclusion derives
directly from contacting/mobilization theory. This research argues elites seek out those with time, resources, and those central to dense social networks. The self-employed often have all of these characteristics.
11Using the log of length at residence accounts for a positive but diminishing increased likelihood of
being contacted for each additional day living at the same address.
with their mobilization effort because it takes less effort to reach an equal or greater
number of voters in these areas than it would a rural area of equal size. Similarly, the
inclusion of controls for the candidates’ home states and for other competitive elections
attempts to account for well established campaign operations and for the coordinated
use of multiple ongoing campaign organizations, respectively. In order to maintain
consistency with the literature, age and marital status were added as controls.
However, the existence of primaries during this period raises the possibility of vote
mass-mobilization. Consequently, a control for primary season was also incorporated in
the model. Individuals living in states where primaries were held prior to the date John
McCain dropped out of the race were coded one, all others zero.12 A logit analysis is
used to estimate how well these variables alter the likelihood of an early stage contact.
In addition to looking at specific indicators, this study argues that support for or
against the theory will be found by looking at clusters of variables and how they do or
do not explain contacting in each stage. Specifically, I expect that commitment and
ca-pacity indicators such as income, strength of partisanship, education, self-employment
status, and knowledge will predict early stage contacting, but not late stage,
competi-tive election contacting. Because vote maximization should not guide mobilization and
because campaigns always need money, wealthy individuals should still be the focus of
late stage contacts in nonbattleground states. However, the effects of the other resource
variables should diminish as the need to recruit large numbers for difficult participatory
acts has passed.
In contrast, the mobilization and contextual variables (e.g., registration status, place
of residence, log of length of residence, other competitive elections, and native son) will
12Several other controls were used to try to find significant primary mobilization effects. Some of
help to predict late stage contacting but not early stage contacting. Simply, the vote
mobilization indicators should only predict contacting when vote mobilization occurs;
in the final days of an election.
Consistent with expectations, strategic elites target strong partisans, the wealthy,
the self-employed, and the politically knowledgeable in the resource gathering stage (see
Table 2.1). That is, elites target individuals ideal for demanding participatory acts.
Furthermore, it is notable that the measures that the theory suggests predict late
recruitment (i.e., living in a battleground state and being a registered voter) fail to
account for mobilization at this stage. Joint tests of significance reinforce the idea
that these variables do not contribute to our understanding of contacting in this stage
(χ28 = 3.50p=.899). This is consistent with the argument that an individual’s capacity and resources matter more at this stage than factors that might be directly associated
with mobilizing turnout.
Table 2.1: Predicting Resource Gathering Stage Contact with Individual and Contex-tual Characteristics
Resource Gathering Stage Contact Commitment & Capacity Variables
Weak Partisan -0.639*
(0.288)
Independent Leaner -0.789*
(0.327)
Independent -0.328
(0.446)
Political Knowledge 0.431*
(0.136)
Educational Attainment 0.065
(0.056)
Income 0.152*
(0.071)
Self-employed 0.668*
(0.279) Mobilization & Contextual Variables
Registered Voter 0.560
(0.537)
Battleground State -0.124
(0.257)
Time at Residence 0.096
(0.126)
Urban Resident 0.032
(0.334)
Suburban Resident 0.078
(0.296)
Native Son -0.128
(0.415)
Competitive Race -0.241
(0.251)
Competitive Primary -0.060
Table 2.1: – Continued
Resource Gathering Stage Contact Demographic Controls
Disabled 0.674
(0.624)
Age 0.007
(0.009)
Married -0.530*
(0.240)
Constant -6.566*
(0.871)
N. of cases 2368
chi-squared 57.080
pseudo R-squared 0.075
* p < 0.05; Source: 2000 NAES panel data (pre-election battery up through
10/31/00).
The impact of money on the likelihood of contacting is impressive. Table 2.2 shows
the effect of income simultaneously controlling for strength of partisanship, knowledge
level, and whether someone was self-employed. The predicted effect of earning over
$150,000 annually translates to having an approximately three-fold increase in the
predicted probability of campaign contact in this stage, compared to those earning less
than $10,000. Clearly, more knowledge, strong partisanship, and being self-employed
all enhance the probability of contact. Overall, the predicted probabilities reported in
Table 2.2 corroborate the importance of both commitment and social placement for the
likelihood of early contacting.13
Interestingly, living in a state with a competitive primary did not increase the
probability of a contact in the early stage of the 2000 election.14 This is consistent with
a nationwide search for resources (Gimpel, Lee and Pearson-Merkowitz, 2008).
13Note that Table 2.2 presents only weak and strong partisans because independents and independent
leaners are statistically indistinguishable from weak partisans in the likelihood of being contacted.
14In a separate analysis, an interaction between the primary control and republican identifiers did
Table 2.2: Predicted Probabilities of an Early Stage Contact for Different Combina-tions of Income, Strength of Partisanship, Knowledge Levels, and Self-employment Status
Weak Partisan Strong Partisan
Knowledge Very Poor Average Excellent Very Poor Average Excellent Not Self-employed
$10,000 .005 .011 .027 .011 .025 .057
$15,000 .006 .013 .031 .012 .029 .065
$25,000 .007 .015 .036 .014 .033 .075
$35,000 .008 .018 .041 .017 .038 .086
$50,000 .009 .021 .048 .019 .044 .099
$75,000 .010 .024 .055 .022 .051 .114
$100,000 .012 .028 .063 .026 .059 .130
$150,000 .014 .032 .073 .030 .068 .148
Over $150,000 .016 .037 .084 .035 .079 .168
Self-employed
$10,000 .009 .022 .050 .020 .047 .105
$15,000 .011 .025 .058 .024 .054 .120
$25,000 .013 .030 .067 .028 .063 .137
$35,000 .015 .034 .077 .032 .072 .156
$50,000 .017 .040 .089 .037 .083 .177
$75,000 .020 .046 .102 .043 .095 .200
$100,000 .023 .053 .117 .049 .109 .225
$150,000 .027 .061 .133 .057 .125 .253
Over $150,000 .031 .070 .152 .066 .143 .283
Notes: These predicted probabilities are created with all nonpresented continuous variables set to their mean and dummy variables set to zero.
2.4
Mobilization Stage Analysis & Results
The second analysis takes the same set of variables used in the resource gathering stage
analysis and attempts to predict late-stage election contact. However, in the
mobi-lization stage analysis, I interact the battleground dummy with all of the variables
used in the model to distinguish late battleground and nonbattleground contacts.15
Interacting the battleground state indicator with each variable in the model allows us
to test whether the variables have different effects (slopes) in the battleground and
nonbattleground states. These analyses also include a dummy for those who first
re-ported a campaign contact in the resource gathering (early) stage.16 The continuous
and registered voter variables were centered to reduce collinearity.17
Turning to the mobilization stage in nonbattleground states, the results indicate
parties do not attempt to reach out to all voters equally in the vote mobilization stage in
uncompetitive elections.18 The significance of the income variable in Table 2.3 indicates
that, even in this late stage, campaigns actively seek out individuals with money. In
fact, the magnitude of income’s impact on recruitment probabilities is comparable to
15States are distinguished according to Shaw’s (2006) “the ’real’ real list” of battleground states.
Battleground states include Arkansas, Florida, Iowa, Maine, Michigan, Missouri, Minnesota, New Hampshire, New Mexico, Oregon, Pennsylvania, Tennessee, Washington, West Virginia, and Wiscon-sin.
16Theoretically, battleground states should be similar to nonbattleground states in the resource
gathering stage. Money and activists are valuable regardless of where they originate. Consequently, this study only uses interaction terms to distinguish competitive from uncompetitive elections in the late stage. To be sure, additional analyses explicitly tested for differences between battleground and nonbattleground states in the resource gathering stage. Both classes of states demonstrated similar contacting patterns in this stage (available upon request).
17Despite these measures, the battleground indicator fails to achieve significance due to irresolvable
collinearity (VIF=9.97).
18The first column in Table 2.3 gives the effects of the variables in nonbattleground states. The
that of the early stage. This is consistent with presidential campaigns continuing to
gather resources. This is not surprising as the hunt for money is continuous and usually
continues on even after an election is over. However, less immediately valued resources
such as political knowledge, self-employment, and strength of partisanship notably fail
to influence late stage contact probabilities; individually or jointly (χ27 = 8.94 p = 0.257).
Table 2.3: Predicting Mobilization Stage Contact with Individual and Contextual Characteristics
Nonbattleground Contact Interaction Battleground Effect Commitment & Capacity Variables
Weak Partisan -0.123 -0.080 -0.203
(0.135) (0.232) (-0.189)
Independent Leaner -0.091 -0.074 -.164
(0.146) (0.251) (.204)
Independent -0.190 -0.109 -.299
(0.225) (0.396) (.326)
Political Knowledge 0.015 0.075 .090
(0.061) (0.103) (.083)
Educational Attainment 0.016 0.059 .075
(0.028) (0.048) (.039)
Income 0.159* -0.177* -.018
(0.036) (0.062) (.050)
Self-employed -0.170 0.234 .064
(0.183) (0.299) (.236)
Mobilization & Contextual Variables
Registered Voter 0.832* 0.204 1.036*
(0.281) (0.450) (.351)
Time at Residence 0.194* -0.108 .085
(0.062) (0.104) (.083)
Urban Resident 0.559* -0.261 .298
(0.165) (0.279) (.225)
Suburban Resident 0.147 0.205 .353
(0.151) (0.239) (.185)
Native Son -0.142 -0.440 -.582
(0.191) (0.400) (.352)
Competitive Race 0.308* -0.515 -.206
(0.127) (0.212) (.170)
Competitive Primary -0.036 0.201 .164
(0.126) (0.213) (.171)
Table 2.3 – Continued
Nonbattleground Contact Interaction Battleground Effect
Other Controls
Disabled 0.645* -0.551 .093
(0.298) (0.562) (.477)
Age 0.021* 0.012 .033*
(0.004) (0.007) (.006)
Married -0.147 0.563 .417*
(0.126) (0.219) (.179)
Early Contact 1.596* 0.507 2.102*
(0.331) (0.840) (.772)
Battleground State 0.536
(0.299)
Constant -0.846
(0.183)
N. of cases 2413
chi-squared 312.137
pseudo R-squared 0.108
* p <0.05; Source: 2000 NAES panel data.
When we look at the commitment and capacity variables’ effects in battleground
states (column three), we see evidence of what theory leads us to believe we should
see, substantial equity in recruitment. The power of the income predictor (the sole
surviving key socioeconomic characteristic) is canceled in the interaction term (column
2); in fact it is slightly reversed. Jointly, none of these variables explain battleground
state contacting (χ27 = 2.72 p = 0.844). This is precisely what should be seen in vote mobilization when every registered voter counts equally.
Figure 1.2 demonstrates the uniqueness of battleground states by plotting the
change in predicted probability for changes in income categories for individuals in both
types of states.19 Figure 1.2 shows how income highly structures recruitment in
non-battleground states. Moving from the lowest to the highest income category would
increase an individual’s contact probability by well over 200 percent. In contrast, those
in the highest income categories in battleground states are slightly less likely to be
contacted than those in the lower categories. In sum, the uncompetitive electoral
sys-tems results in inegalitarian contacting patterns while competitive elections result in
egalitarian contacting patterns.
0 .1 .2 .3 .4 .5 .6
Probability of Recruitment
10k 15k 25k 35k 50k 75k 100k 1500k +150K
Changing Income Categories
Nonbattleground State Battleground State
Figure 2.2: Relationship between Income and Mobilization Contacts in Competitive and Uncompetitive Conditions, in the NAES 2000 Panel
2.5
Discussion & Conclusion
When it comes to electoral mobilization, popular theory suggests elites will not
exclu-sively recruit advantaged citizens. However, most research of recruitment in elections
leave the impression of an overall strategy that does focus on the advantaged. This
study argues these patterns emerge from the failure to recognize the conditional nature
of recruitment strategies. Rather, campaigns recruit different types of individuals, at
specific times within an election cycle, in order to achieve Disaggregating elections into
two stages and controlling for competitiveness uncovers strategic behavior. We saw an
elite, resource-oriented strategy in the early through end stage of the campaign. In the
late phase however, the strategy turned to general mobilization in battleground states,
but retained its resource orientation in nonbattleground states. These are the behaviors
that correspond to a strategic theory of contacting. Simply, elites alter their electoral
contacting strategies in elections to conditional goals.
Still, this blunt methodological approach to unpacking elite strategic behavior leaves
many unanswered questions. For example, are there any fundamental differences
be-tween national campaigns and state campaigns; or differences bebe-tween statewide and
local campaigns in the contacting/mobilization strategies? It seems likely that the size
and geographic dispersion of the constituency; the candidates’ resources; citizen
inter-est and involvement in an election; and the ambitions of the elites could all alter the
nature, timing, and breadth of election contacting strategies.
At the same time, it is not entire clear at this point how these factors influence
strategies. Unfortunately, up until now, most research assumed contacting was geared
toward vote maximization efforts. Indeed, one of the big contributions of this paper
is that it forces us to think of contacting as a strategic process that is tailored to
achieve the long and short term goals of different campaigns, facing different strategic
campaign strategies. Hopefully, we will eventually come to understand the strategic
goals furthered by the large number of campaign contacts in uncompetitive elections.
Finally, despite the fact that this article does not answer all our questions, we can
at least be somewhat comforted by the fact that inequalities in campaign contacting
rates are not inevitable. Campaigns do contact a broad and representative segment of
society; even if this only occurs when elections are competitive. In fact, making our
elections competitive would likely substantially undermine the socio-economic bias in
campaign contacting; at least in the vote mobilization stage.
2.6
Operationalization of Concepts
Table 2.4: Defintion of Select Independent Variables Used in the Analyses
Concept Operationalization
Early Stage Contact Individuals who reported being contacted in the pre-election survey and were interviewed prior October 31, 2000 were coded as early contacts.
Late Stage Contact Individuals who only report a contact in the post-election sur-vey, or reported a contact in the pre-election survey but were interviewed after October 30, 2000, were coded late contacts.
Income A nine point income category scale created from
respon-dents’ self-reported income. The scale ranges from “Less than $10,000” to “$150,000 or more.”
Educational Attain-ment
A nine point educational completion scale created from the re-spondent’s self-reported of his/her educational experience. The scale ranges from “grade eight or lower” through “graduate or professional degree”.
Political Knowledge A five point scale created from the interviewer’s grade assess-ment of each respondent’s political knowledge. The scale ranges from “F” to “A.”
Self-employed Indicator variable coded one for individuals who reported being self-employed.
Strength of Partisan-ship
Series of three indicator variables coded one for individuals who reported being partisan leaning independents, weak identifiers, and strong partisans. Pure independents are the omitted, base-line category.
Place of residence Series of two indicator variables coded one for individuals who were coded as living in an urban and suburban area. Rural residents are the omitted, baseline group.
Length at residence Continuous variable that tells how many years respondent lived at his/her current resident. The variable was logged prior to analysis.
Competitive Pri-mary
Indicator variable coded one for individuals who lived in states with primaries held before Senator McCain conceded. These states include Arizona, California, Connecticut, Delaware, Georgia, Iowa, Massachusetts, Maryland, Maine, Michigan, Minnesota, Missouri, North Dakota, New Hampshire, New York, Ohio, Rhode Island, South Carolina, Virginia, Vermont, and Washington.
Table 2.4: – Continued
Concept Operationalization
Competitive Race Indicator variable coded one for individuals who lived in states with competitive gubernatorial or senate races. States with competitive races include Florida, Delaware, Michigan, Mis-souri, Montana, Nebraska, New Hampshire, New Jersey, New York, North Carolina, North Dakota, Vermont, Virginia, Wash-ington, and West Virginia.
Registered Voter Indicator variable coded one for individuals who reported being registered to vote or not having to register to vote.
Battleground State Indicator variable coded one for Arkansas, Florida, Iowa, Maine, Michigan, Missouri, Minnesota, New Hampshire, New Mexico, Oregon, Pennsylvania, Tennessee, Washington, West Virginia, and Wisconsin, else zero.
Married Indicator variable coded one for individuals who reported being married.
Age Variable that ranges from 18 to 97.
Disabled Indicator variable coded one for individuals who reported being disabled.
Native Son Indicator variable coded one for individuals who reported living in Texas, North Carolina, Tennessee, and Wyoming.
Chapter 3
Campaign Contacts and The
Formation of Party Identities
Given that party identification plays a central role in determining political
prefer-ences, attitudes, and behaviors, political parties have a vested interest in fully
under-standing how their behaviors alter party identities. The existing party identification
literature suggests political parties and their operatives can only alter
party-in-the-electorate through a few indirect mechanisms: strategic positioning on the issues and
the effective performance of elected officials (Achen, 1992; Carmines and Stimson, 1989;
Carsey and Layman, 2006; Fiorina, 1981; Hetherington, 2001; MacKuen, Erikson and
Stimson, 1989; Wawro, 2002). However, there is reason to believe party contacting in
elections can influence party identification.
3.1
Campaign Influence on Partisanship
Given that party identification is viewed as relatively stable, the idea that something
as simple as a party contact might influence party identification seems counterintuitive.
Yet there is reason to suspect that party contacts may help to behaviorally reinforce
Converse and Markus’s (1979) behavioral (vote) reinforcement theory of party
iden-tification argues that we create or alter the linkages between ourselves and a party when
we vote for that party (see also Dobson and Douglas, 1975; Howell, 1980; LoTempio,
2002). Specifically, individuals who vote consistently for a party are more likely than
individuals who inconsistently vote for that party to take on–or increase the strength
of–attachments to that party.
At the core of this theory lies an important idea, that latent affect for a party does
not fully translate into an identity without an intervening behavior; the vote. That is,
two steps must be taken in order for an individual to effectively create or strengthen
his/her bond with a party. First, the individual must turn out to vote. Second, the
individual must consistently vote for the party (i.e., make few cross party votes). Only
after taking both steps will the voter have successfully altered her affective/cognitive
links to the parties; strengthening connections to one and possibly moving farther away
from the other(s). In contrast, the nonvoter does not create or strengthen bonds to the
parties, all other things being equal.
If we work through the logical implications of the theory, we see that any force that
alters an individual’s turnout decision or ballot choice also alters the likelihood that an
individual will strengthen his/her bonds with the parties. Consequently, if contacting
alters either the vote decision or the vote choice, then contacting will influence the
formation of party identities.
Fortunately for parties, existing research recognizes that campaign contacts are
ex-plicitly aimed, and successful, at influencing both the likelihood of voting and the vote
choice. First and foremost, abundant evidence exists to suggest get-out-the-vote
oper-ations influence the likelihood of voting (Bennion, 2005; Bergan et al., 2005; Caldeira,
Clausen and Patterson, 1990; Gerber and Green, 2000a,b; Goldstein and Ridout, 2002;
Holbrook and McClurg, 2005; Karp and Banducci, 2007; Karp, Bowler and Banducci,
2003; Nickerson, Friedrichs and King, 2006; Rosenstone and Hansen, 1993). However,
research also shows contacting alters attitudes toward, and likelihood of voting for, the
parties (Huckfeldt and Sprague, 1992; Lefkowitz, 2004; Vavreck, Spiliotes and Fowler,
2002). In sum, the empirical findings of the vote mobilization and maintenance
liter-atures suggest that campaign contacts should alter party identities (albeit indirectly
through the vote).
At the same time, the vote is not the only participatory opportunity campaigns
offer. Campaign representatives also ask citizens to donate money, attend campaign
events, place lawn signs, and so forth (Rosenstone and Hansen, 1993; Brady, Verba and
Schlozman, 1995; Kershaw, 2009; Verba, Schlozman and Brady, 1995). If an important
mechanism for identity formation is behaviorally supporting a party, those who perform
these other core campaign tasks should also develop stronger bonds to the parties.
3.2
Assessing Party Identity Change
Overall then, we have strong theoretical reason to believe campaign contacting brings
with it multiple opportunities for individuals to behaviorally alter their party identities.
To test whether Democratic and Republican contacting actually alters the strength
and/or direction of individual party attachments, I turn to the 2000 National
An-nenberg Election Survey general election panel and use self-reported contact with the
presidential campaigns.1
The dependent variable used in the analysis is change in party identification.2 To
1The lack of available data currently prohibit more detailed analyses of the potential pathways.
Simply, most existing surveys do not ask pre-election and post-election party identification questions, and do not ask directional campaign participation questions let alone about depth of that participation.
2The substantive importance of contacting emerges using a variety of methods (ordinary least
create the dependent variable, I subtracted the post-election seven point party
identi-fication scale from the pre-election party identiidenti-fication scale. Those who scored zero
maintained their identities. Given that higher values on the scale captured Republican
identification, individuals who scored one or greater moved a step or more Republican.
Those below zero moved Democratic.
To finalize the variable, I recoded the scores for individuals whose values exceeded
one and negative one, to one and negative one. There are two different reasons for the
simplification to three transition states (moved Republican, maintained their current
identity, or moved Democratic). The first is that it is empirically rare, and
theoret-ically unlikely, for individuals to move any more than one step up or down the scale
over the course of a single election cycle.3 The limited number of cases in some
out-come categories undermines the ability to estimate ordered and/or generalized ordered
models.4 Second, without recoding, the best specified models would also violate the
parallel regression assumptions and would be unestimatable. For example, a leaning
independent cannot more than four places up or down the scale. Consequently, the
leaning independent would always have a zero probability of moving five or more spots
on the scale. If we include indicators for leaning independents, these indicators would
perfectly predict failure.
Several considerations led to the decision to analyze change in party identification
rather than predicting placement on the party identification scale. The first
consider-ation is that the analysis of change approach controls for all of the unobserved, time
invariant forces that affect placement on the party identification scale (Wawro, 2002).
3The raw data in 2000 show that approximately sixty percent of the population in the 2000 NAES
panel did not move at all, 26.9% moved one step, 7.2% moved two, 2.6% moved three, and the remainder moved four or more.
4Small numbers of observations in outcome categories cause convergence failures in gologit2.
The second reason is this method allowed me to test whether contacting had
differ-ent effects for differdiffer-ent types of partisans. Most prior research assumes that individuals
located at each step on the party identification scale behave the same in response to
the same external stimuli (e.g., performance in office). This is a questionable
assump-tion. Since strong partisans have deep affective attachments, anchored in a wealth of
past political experience, it is likely that strong partisans will be highly resistant to
external stimuli (Burdein, Lodge and Taber, 2006; Kunda, 1990; Lodge and Taber,
2005; Morris et al., 2003; Redlawsk, 2002; Steenbergen and Lodge, 2003b; Taber and
Lodge, 2006). In contrast, independents may be more “moveable” due to their lack of
existing (or a balanced) affect for the parties. Unfortunately, the traditional method
of using a respondent’s lagged placement on the party identification scale to predict
his/her current placement on the scale is not easily modified in a way that allows us to
capture differences in contacting effects by partisan subgroups.5 By analyzing change,
I was able to include partisan indicators (and partisan indicators interacted with party
contact variables) in order to test for conditional effects.6 These tests indicated that
contacts were less effective on strong partisans (available upon request). This fact plus
several additional methodological considerations lead to me to employ a different
de-pendent variable (and a separate analysis) for pure indede-pendents, indede-pendents who
lean towards a party, and weak identifiers than I use for strong partisans.
5It is also likely that ordinary least squares on such an analysis would violate a number of
assump-tions including constant error variance.
6The failure to account for this varying resistance would bias estimates of the effectiveness of
3.3
Model & Analysis - Independents, Leaners, &
Weak Identifiers
The following model is used to test whether contacting alters the identities of
indepen-dents, leaners, and weak identifiers:
Y = β0+β1Democratic Contact+β2Republican Contact
+β3Clinton F avorability+β4Clinton F avorability Change
+β3N et (Bush−Gore)F avorability
+β4N et (Bush−Gore)F avorability Change
+β5Leans Democratic+β6Leans Republican+
+β7W eak Democrat+β8W eak Republican+
+β9Gore V oter+β10Bush V oter+
+β11Days T o Election+ǫ
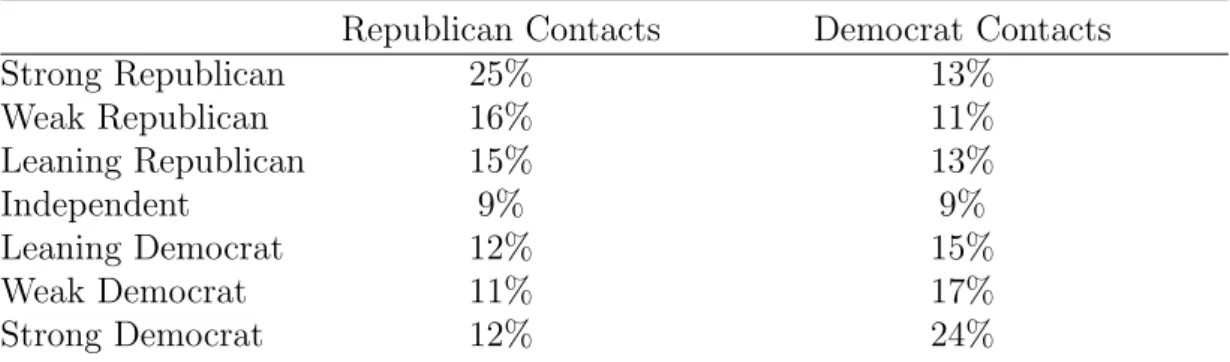
The key variables of interest in the model are the Democratic and Republican
con-tact indicator variables.7 It is worth noting that these contacts are not strictly with-in
party contacts. In fact, the large number of cross-party contacts (e.g., Gore campaign
contacting Republican voters) could result in a substantial number of individuals
mov-ing away from the party they identify with (see Table 3.1).
7An individual was coded one for the Democratic (Republican) contact variable if she reported that
the Democratic (Republican) party contacted her.
Table 3.1: Democrat and Republican Contacts Among Partisans Subgroups in the 2000 Presidential Election
Republican Contacts Democrat Contacts
Strong Republican 25% 13%
Weak Republican 16% 11%
Leaning Republican 15% 13%
Independent 9% 9%
Leaning Democrat 12% 15%
Weak Democrat 11% 17%
Strong Democrat 12% 24%
Source: 2000 National Annenberg Election Survey, Election Panel
Overall, the model pits contacting against a rigorous set of controls.8 Most
impor-tantly, the model includes presidential vote choice predictors (i.e., voted for Bush or
Gore). The inclusion of current vote-choice variables controls for many of factors that
move partisanship (Franklin and Jackson, 1983). As such, it provides a strong check
against finding significant contacting effects. As an added benefit, their inclusion also
tests whether campaign contacts add any predictive power independent of the vote (i.e.,
contacts alter identities through other mechanisms beyond vote reinforcement).
Other model variables include: Clinton’s pre-election favorability, change in
Clin-ton’s favorability, Bush’s (Bush-Gore) net pre-election favorability, change in Bush’s
net favorability, partisan subgroup indicators, and a variable that captures the
days-to-election. The Clinton favorability variable proxies for the respondents’ assessments
of the Democrat’s performance in office (see (Cohen, 1999)).9 The inclusion of the net
favorability variable should account for multiple candidate characteristics (issues,
char-acter, and so forth) that might alter the respondents’ party identities.10 The inclusion
of change in Clinton and net Bush favorability scores allows us to capture movement
in individuals’ assessments of these actors. The inclusion of the indicator variables for
different types of partisans recognizes that different groups of partisans may have
differ-ent probabilities of moving. Finally, because the NAES pre-election party iddiffer-entification
questions were asked on different days prior to Election Day, the addition of the
days-until-election variable will account for difference in campaign exposure (opportunity for
events to alter identities).11
8Given the novelty of the idea that campaign contacts can alter party identities, this should instill
confidence in the results.
9The probabilities of moving Republican versus moving Democratic–and maintaining position on
the scale versus moving Democratic–should decrease as Clinton favorability scores rise.
10In contrast, the probabilities of moving Republican versus moving Democratic should fall as Bush’s
net favorability increases.
11The earlier the in the election cycle respondents are asked to give their party identities, the more
Note that Brant Tests indicate that several of the variables (the partisan subgroup
indicators and the days-to-election variable) violate the parallel regression assumption.
Since the effects of the contacting variables–the variables of interest–do not vary by
outcome category, I use a generalized ordered logit approach to test whether campaign
contacts alter individuals’ identities.12 The generalized ordered logit falls between the
ordered logit and multinomial logit in that it permits the researcher to allow the effects
of select variables to vary with the different categories of the dependent variable.13 This
approach has benefit of easing the ability to interpret the effects of the variables that
do not violate the parallel regression assumption–relative to multinomial logit.
Turning to the results, Table 3.2 shows that campaign contacts alter party
identi-ties. The significant coefficients for both Democratic and Republican contacts tell us
that these contacts simultaneously draw independents’, leaners’, and weak identifiers’
party identities toward the contacting party and away from the other party. Thus, a
Democratic contact equally strengthened weak and leaning Democrats; pushed some
independents into leaning toward the Democrats; and weakened some leaning and weak
Republicans.14
For the sake of interpretation, it is important to reiterate that this movement is
relative to the respondent’s original identity status. For example, we can interpret
likely they are to move from their initial placement.
12This model was estimated using gologit2 in Stata.
13In contrast, ordinal logit constrains the effect of the variables to be the same for each category in
the dependent variables, while multinomial logit estimates a separate effect for all of the variables for each category of the dependent variable.
14Note that a separate analysis used interactions between the contacting variable and each party
Table 3.2 to mean that a weak Democrat, an independent, and a weak Republican
all “moved” Republican, the same amount, in response to a Republican campaign
contact. However, this movement has substantively different meaning for the each
type of partisan. The weak Democrat became a leaning-independent, the independent
became a Republican-leaner, and the weak-Republican became a strong Republican.
Table 3.2: Predicting Individuals Who Moved a step Up or Down the Seven Point Party Identification Scale During the 2000 Presidential Election
Beta
Democratic Contact -0.535*
(0.090)
Republican Contact 0.390*
(0.084)
Clinton Favorability, pre-election -0.004*
(0.002)
Change in Clinton Favorability -0.002
(0.002) Candidate Favorability Difference, pre-election 0.009*
(0.001)
Change in Candidate Favorability Difference 0.008*
(0.001)
Bush Vote 0.756*
(0.150)
Gore Vote -0.707*
(0.143)
Days to General Election -0.001
(0.001)
Independent - Leans Democratic 0.821*
(0.151)
Independent - Leans Republican -0.111
(0.174)
Weak Democrat 1.014*
(0.154)
Weak Republican -0.303
Table 3.2: – Continued
Gamma
Days to General Election 0.002*
(0.001)
Independent - Leans Democratic -.472*
(0.186)
Independent - Leans Republican -.783*
(0.192)
Weak Democrat -.885*
(0.188)
Weak Republican -0.483*
(0.182)
Cut-point 1 -1.249*
(0.185)
Cut-point 2 1.138*
(0.186)
N. of cases 3145
log-likelihood -2862.190
Chi-squared 789.393
* p <0.05 Note: Only includes independents, independent leaners, and weak
parti-sans. The gamma coefficients tell us how much those variables violate proportional odds assumption.
In terms of magnitude, contacting appears to substantially influence movement in
party identities (see Table 3.3). For example, an unmatched Democratic contact raised
the probability that the average non-voting Independent stepped toward the Democrats
from .258 (for those with no contacts) to .372.15 Importantly, this contact also helped
to maintain party identities by reducing the probability that the average independent
stepped toward the Republicans from .252 to .165. While individually modest in size,
the contact earns a .201 net advantage for the Democrats by moving individuals toward
them and reducing the likelihood that they move Republican. Note that Republicans
similarly advantaged themselves by their contacts. Their contacts net a .148 advantage.
These results are doubly impressive after we recognize that the model includes variables
that mediate the relationship between contacting and party identities.
Contacting effects are even more dramatic in concert with the vote. A party contact
of an eventual party voter help raised the probability that the average independent
would move toward the party above .5 (.546 for Democrats and .514 for Republicans).
The party contact simultaneously pushed the likelihood that the independent would
move toward the other party to close to zero.
It is noteworthy that these findings emerge despite the inclusion of the vote choice.
This suggests that something inherent in the act of contacting is important for
main-taining/altering party identities, above and beyond its influence over the decision to
vote and vote choice.
The robustness of these findings was put to the test using the American National
Election Study 2000-2004 panel survey. Despite a small number of cases, that analysis
found comparable results using a similar method and model (see the analysis at the
end of the chapter).
Table 3.3: Predicted Probability that an Independent Moved a Step Democratic or Moved a Step Republican in 2000, by Contact and Vote Status
Non-voter Gore Vote Bush Vote
Stepped Stepped Stepped Stepped Stepped Stepped
Democratic Republican Democratic Republican Democratic Republican
No Contact 0.258 0.252 0.413 0.142 0.140 0.417
Democrat Contact Only 0.372 0.165 0.546 0.089 0.218 0.296
Republican Contact Only 0.190 0.332 0.323 0.197 0.099 0.514
Contacted by Both 0.286 0.225 0.449 0.126 0.159 0.383
Note: Only includes independents, independent leaners, and weak partisans.