Using Primer-ID Deep Sequencing
to Detect Recent Human
Immunodeficiency Virus Type 1
Infection
Ann M. Dennis,1,a Shuntai Zhou,2,a Christopher J. Sellers,1 Emily Learner,3 Marc Potempa,2 Myron S. Cohen,1 William C. Miller,4 Joseph J. Eron,1 and Ronald Swanstrom2
1Division of Infectious Diseases, 2Department of Biochemistry and Biophysics, and 3Department of Epidemiology, University of North Carolina at Chapel Hill; and 4Division
of Epidemiology, Ohio State University, Columbus
Intrahost viral sequence diversity can be evaluated over multiple genomic regions using next-generation sequencing (NGS) and scaled to population-level diversity to identify recent human immunodeficiency virus type 1 infection. Using Primer-ID NGS, we sequenced the reverse transcriptase (RT) and env V1–V3 regions from persons with known infection dates, and assessed the mean (π) and first quintile of pairwise diversity dis-tributions over time. The receiver operating characteristic area under the curve (AUC) of RT and V1–V3 combined showed excellent discrimination of recent infection <9 months: using π (only single transmitted variants: AUC, 0.98; threshold <1.03%; sensitivity, 97%; specificity, 89%) and the first quintile (includ-ing all variants: AUC, 0.90; threshold <0.60%; sensitivity, 91%; specificity, 92%).
Keywords. HIV-1; deep sequencing; HIV-1 incidence; NGS.
Detection of recent human immunodeficiency virus type 1 (HIV-1) infection is critical for monitoring HIV-1 incidence and preventing HIV-1 transmission. The months following HIV-1 infection are a period of high transmissibility [1], due to a combination of behavioral and biologic factors. Among high-risk groups, such as men who have sex with men, up to 45% of onward transmissions occur in the first year of HIV-1 infection [2]. Treatment as prevention may be compromised if a high proportion of transmissions occur during recent infection prior to diagnosis and entry into care [3]. Thus, identifying recent
infection is important for HIV-1 surveillance. Current detection methods typically rely on assays based on immune responses, which are subject to false recency and necessitate algorithms for further testing [1]. Advances in sequencing and computational methods have led to a growing interest in sequence biomark-ers of recent infection based on the temporal correlation with ambiguous positions [4] or pairwise distances [5–7].
Viral sequence diversity biomarkers using next-generation sequencing (NGS) with Primer-ID (PID) may be a promising method for identifying recent HIV-1 infection in cross-sec-tional samples. The PID approach overcomes the limitation of conventional NGS sampling error by revealing the true sam-pling depth, greatly reducing the sequencing and polymerase chain reaction (PCR) error to 0.01%, and eliminating reads rep-resenting PCR recombination [8, 9]. Our objective was to assess the utility of PID at identifying recent infections based on pair-wise distances using a sample of persons with HIV-1 subtype B infections and known infection dates. Such methods could be readily applied in conjunction with phylogenetic analyses for epidemic monitoring.
METHODS
Study Population
We obtained plasma samples from participants of the HIV/ AIDS Vaccine Immunology 001 Study: Acute HIV-1 Infection Prospective Cohort (CHAVI-001) at the University of North Carolina (UNC) or Duke University. In CHAVI-001 [10], high-risk subjects were screened for HIV-1 infection by enzyme-linked immunosorbent assay, Western blotting, and plasma RNA between 2006 and 2011. Time of initial HIV-1 infection was estimated using the Fiebig staging classification of acute infection [11]. We selected persons with documented sero-conversion data, subtype B infection, and samples collected prior to antiretroviral therapy (ART) exposure. Additionally, we evaluated plasma samples from participants of the UNC Center for AIDS Research HIV-1 Clinical Cohort (UCHCC) who were diagnosed during chronic HIV-1 infection and had a stored specimen sampled both prior to ART and >1 year from diagnosis. This study was approved by the UNC Biomedical Institutional Review Board.
Primer-ID Deep Sequencing
We used the PID protocol to prepare MiSeq PID library with multiplexed primers [9, 12]. Viral RNA was extracted from plasma samples using the QIAamp viral RNA mini kit (Qiagen, Hilden, Germany). Complementary DNA (cDNA) was syn-thesized using a cDNA primer mixture targeting the reverse transcriptase (RT) and env V3 coding regions (Supplementary Table) with a block of random nucleotides in each cDNA primer STANDARD
Received 21 March 2018; editorial decision 2 July 2018; accepted 13 July 2018; published online July 16, 2018.
Presented in part: 24th Conference on Retroviruses and Opportunistic Infections, Seattle, Washington, February 2017.
aA. M. D. and S. Z. contributed equally to this work.
Correspondence: A. M. Dennis, MD, University of North Carolina at Chapel Hill, Division of Infectious Diseases, 130 Mason Farm Rd, Suite 2115, Chapel Hill, NC 27599-6134 (adennis@ med.unc.edu).
DOI: 10.1093/infdis/jiy426 1
218
serving as the PID, and SuperScript III RT (ThermoFisher). After 2 rounds of purification of cDNA, we amplified the cDNA using a mixture of forward primer that targeted upstream RT and env V1 coding regions, followed by a second round of PCR to incorporate Illumina adaptor sequences. Gel-purified libraries were pooled and sequenced using MiSeq 300 base paired-end sequencing (Illumina). The sequencing covered the HIV-1 RT region (HXB2 2648–2914, 3001–3257), and HIV-1 V1–V3 region (HXB2 6585–7208) with a small portion of C2 not covered.
Sequence and Phylogenetic Analyses
We used the Illumina bcl2fastq pipeline for the initial process-ing and constructed template consensus sequences (TCSs) with TCS pipeline version 1.33 (https://github.com/SwanstromLab/ PID). We then aligned TCSs to an HXB2 reference to remove sequences not at the targeted region or had large deletions. Sequences from the RT and V1–V3 regions were aligned sep-arately using MUSCLE version 3.8.31. We calculated the raw (uncorrected) pairwise distances using the R “ape” package. Neighbor-joining phylogenetic trees were reconstructed with the Tamura-Nei 93 substitution model for each time point by participant to detect multiple variant infection (defined when the tree included 2 or more clades separated by genetic dis-tance >5%). We evaluated the average overall disdis-tance (π) and the pairwise distribution among the TCS population from each participant at each time point. We further created a RT consen-sus sequence for each sample to simulate output from standard genotyping (pol population sequences). Ambiguity codes were assigned at a threshold of 10%. The fraction of ambiguous base positions was evaluated at each time point.
Statistical Analysis
We evaluated the relationship between pairwise diversity and days since seroconversion in RT, V1–V3, and the sum of RT and V1–V3. Marginal Pearson correlation estimates were cal-culated to account for multiple observations per subject [13]. Receiver operating characteristic area under the curve (ROC-AUC) analysis was used to select the accuracy of using pair-wise diversity to discriminate recent (positive test) vs chronic infection (negative test) evaluated at 3, 6, 9, and 12 months since seroconversion. The AUCs were calculated using the clus-tered-ROC function in R to account for multiple observations per subject [14]. Thresholds, determined as the pairwise cutoffs that maximize both sensitivity and specificity for each classifier, were calculated with the pROC package.
The relationships were first examined with π excluding the samples with multiple transmission variants because π is expected to be high at early time points and appear as chronic infections in these cases. To address this, we examined the aver-age distance at the first quintile (quintile 1: lower 20%) of the each pairwise distribution. Examples of these measures and
corresponding phylogenies are provided in Supplementary Figures 1–5.
RESULTS
Study Population
In total, 91 plasma samples were obtained from 23 CHAVI participants (n = 84 samples) and 7 UCHCC participants with chronic infection (n = 7 samples). Of these, sequencing was successful for 97% in RT (n = 88/91) and 92% in V1–V3 (n = 81/91). Ninety-one percent of CHAVI participants were male (n = 21); participants had a median age of 23 years (inter-quartile range [IQR], 19–44 years) at diagnosis and contributed a median of 3 samples (range, 1–9) (Table 1). Of these, 44% were collected <6 months, 20% between 6 and 12 months, and 36% >12 months following seroconversion (range, 0–1464 days). Among the 7 UCHCC participants, 5 were male (Table 1), and a median of 7.6 years (IQR, 3–11 years) elapsed from diagnosis to sample collection. Multivariant transmissions were noted for 5 CHAVI participants (22%) (Table 1): 4 at diagnosis and 1 per-son noted with superinfection (patient 248) on the third sample (estimated 186 days following seroconversion). Notably, 1 par-ticipant (patient 19) was found to have high diversity and mul-tiple clades on phylogenetic analysis in all early samples, which was likely due to an unusual infection with multiple founders; the participant disclosed extensive direct blood and sexual con-tact with her chronically infected male partner (Supplementary Figure 6).
Pairwise Diversity Over Time
Excluding Multivariant Transmission
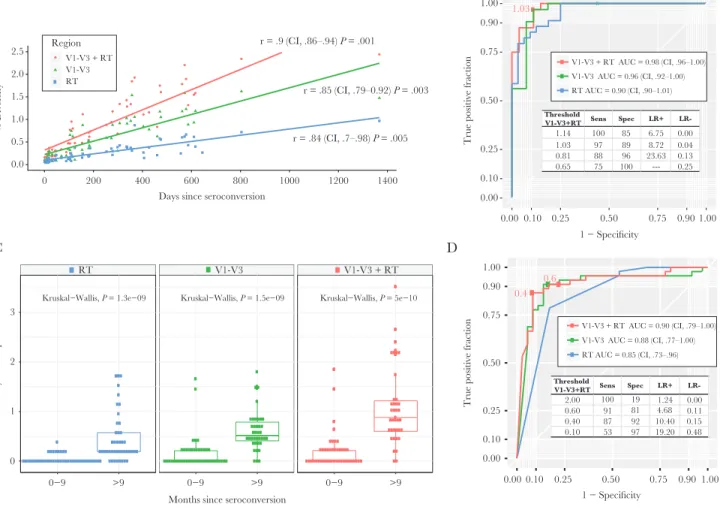
The average pairwise distance increased over time in both regions with significant linear correlation (Figure 1A). In ROC analyses, the combined diversity in RT and V1–V3 sequences showed the best discrimination for recent definitions at 9 months (AUC, 0.98 [95% confidence interval {CI}, .96–1.00]), but both regions alone had high AUC (Figure 1B). A π thresh-old of <1.03% optimizes sensitivity at 97% with 88% specificity, whereas a more stringent threshold of <0.81% increases speci-ficity to 96% with sensitivity at 88% in classifying recent infec-tion (Figure 1B). Similarly, V1–V3 classified well at thresholds of 0.76% (sensitivity, 97%; specificity, 89%). A threshold of 0.21% in RT had lower sensitivity (79%) but high specificity (97%).
Including Multivariant Transmission
regions (Figure 1C). The ROC-AUC was examined using the quintile 1 diversity as predictor and recent infection classified at 9 months. Discrimination was best at V1–V3 + RT (AUC, 0.90) and V1–V3 alone (AUC, 0.88) (Figure 1D). A threshold of 0.60% in V1–V3 + RT classifies with high sensitivity (91%) with specificity of 81%; a lower threshold of 0.40% increases specificity (92%) with sensitivity of 87%. Optimized threshold for V1–V3 was 0.39% (sensitivity, 91%; specificity, 86%; posi-tive likelihood ratio [LR], 6.56; negaposi-tive LR, 0.10) and for RT was 0.10% (sensitivity, 79%; specificity, 83%; positive LR, 4.61; negative LR, 0.26). The simulation of RT consensus sequences ambiguity fraction yielded less predictability to identify recent infection (ROC-AUC, 0.78). We found a 0.48% ambiguity
threshold has optimized predictability (sensitivity, 73%; speci-ficity, 63%) to classify recent infection.
DISCUSSION
Measuring HIV-1 diversity over multiple regions using PID can be a useful tool to identify recent infection using diagnostic sam-ples. The PID method reduces sequencing and PCR error, pro-ducing more accurate sequences, and validates sampling depth. We found that the overall average distances in RT and V1–V3 performed very well in the setting of single founder transmis-sion to identify recent infection at 9 months, which is an accept-able metric. Importantly, we show that pairwise distances early in the pairwise distribution can also be used with slightly lower Table 1. Characteristics of Study Population Including 23 Persons Diagnosed During Acute Human Immunodeficiency Virus (HIV-1) Infection With Known Seroconversion Dates and 7 Persons With Chronic HIV-1 Infection
Subject Sex Age, ya Risk Factor
CD4 Count (cells/µL)a
HIV-1 RNA Load (copies/mL)a
Samples at Different Time Points
Successful Sequences
Note
RT V1–V3
19 F 18 HETb 516 741 499 5 5 5 Multiple variants
40 M 56 MSM 929 298 026 6 6 0
77 M 23 MSM 806 144 145 4 4 4
81 M 45 MSM 805 3746 1 1 1
106 M 56 MSM 277 10 000 000 1 1 1
150 M 24 MSM 389 589 437 1 1 1
199 M 19 MSM 1071 5145 1 1 1
222 M 21 MSM 541 53 507 6 6 6
248 M 24 HET 873 2485 5 5 5 Superinfectionc
295 M 53 HET 438 47 277 1 1 1
390 M 18 MSM 528 55 309 7 7 7
407 F 20 HET 802 47 641 1 1 1
470 M 17 MSM 324 264 882 6 6 6
592 M 24 MSM 708 952 9 9 9 Dual infection
621 M 40 MSM 478 387 344 1 1 1
649 M 26 MSM 701 8340 6 6 6
654 M 19 MSM 435 81 565 1 1 1 Dual infection
700 M 17 MSM 1162 1768 9 6 6
831 M 44 MSM 272 24 700 000 1 1 1
834 M 20 MSM 645 2437 5 5 5 Dual infection
953 M 18 MSM 404 7157 3 3 3
961 M 47 MSM 200 39 175 1 1 1
1462 M 22 HET 447 64 752 3 3 3
CFAR50 M 57 HET 215 161 419 1 1 1 Chronic
CFAR51 M 54 MSM 727 10 160 1 1 1 Chronic
CFAR52 M 48 MSM 962 4329 1 1 1 Chronic
CFAR53 M 30 MSM 576 1865 1 1 1 Chronic
CFAR57 F 68 NA 945 19 896 1 1 1 Chronic
CFAR61 F 33 HET 548 17 453 1 1 1 Chronic
CFAR64 M 61 NA 215 55 831 1 1 0 Chronic
Total 91 88 81
Abbreviations: CFAR, Center for AIDS Research; F, female; HET, heterosexual; HIV-1, human immunodeficiency virus type 1; M, male; MSM, men who have sex with men; NA, not available; RT, reverse transcriptase.
aAt date of first sample.
bParticipant also disclosed repeated direct blood contact with a chronically infected partner.
but good discrimination with the advantage of including sam-ples with multiple variants (thresholds can be selected to opti-mize sensitivity or specificity to >90%). We identified multiple founders in nearly 22% of these participants, which reinforces the need to account for multiplicity when using pairwise diver-sity measures.
Our findings suggest that a combination of diversity bio-markers and thresholds could be used to identify samples with multiple variants, which is an important limitation in using average pairwise distances alone. Average distances can falsely classify recent infections with multiple founders or superin-fection as chronic insuperin-fections. Samples with discrepant results (ie, high π with low distances at quintile 1) could be selected for phylogenetic confirmation of multiplicity [5, 6]. In an NGS study of HIV-1 subtype C infections, the distribution of pair-wise distances was successfully used to distinguish intrahost subclusters corresponding to phylogenetic clades indicating
multiple variant transmission [5]. Another study evaluated the first decile of Hamming distance distribution from single genome amplification, similarly finding that diversity early in the pairwise distribution was robust in classifying recent infec-tion regardless of multiplicity [7].
Using PID-NGS offers several advantages over existing sero-logical-based assays as well as sequence-based measures for the detection of recent HIV-1 infection. While the accuracy of serological-based assays on the population level is high, most require algorithms incorporating CD4 cell counts and HIV-1 RNA loads to improve specificity [1]; these are often not rou-tinely collected with diagnostic samples. Sequence-based diversity measures may not exceed the performance of such algorithms and our study is limited in that we did not perform direct comparison with serologic assays. Nonetheless, NGS is advantageous in relying only on computationally simple pair-wise distance calculations from a single sample without the V1-V3
RT 0.0
0.5 1.0 1.5 2.0 2.5
0 200 400 600 800 1000 1200 1400 Days since seroconversion
% Diversity
r = .9 (CI, .86–.94) P = .001
r = .85 (CI, .79–0.92) P = .003
r = .84 (CI, .7–.98) P = .005
V1-V3 + RT V1-V3 RT
Region
A B
D C
1.03
0.00 0.10 0.25 0.50 0.75 0.90 1.00
0.00 0.10 0.25 0.50 0.75 0.90 1.00 1 − Specificity
True positive fractio
n V1-V3 + RT AUC = 0.98 (CI, .96–1.00)
V1-V3 AUC = 0.96 (CI, .92–1.00) RT AUC = 0.90 (CI, .90–1.01)
Threshold
V1-V3+RT Sens Spec LR+
LR-1.14 100 85 6.75 0.00
1.03 97 89 8.72 0.04
0.81 88 96 23.63 0.13
0.65 75 100 --- 0.25
Kruskal−Wallis, P = 1.3e−09 Kruskal−Wallis, P = 1.5e−09 Kruskal−Wallis, P = 5e−10 V1-V3 + RT
0−9 >9 0−9 >9 0−9 >9
0 1 2 3
Months since seroconversion
% Diversity at first quintile
0.6 0.4
0.00 0.10 0.25 0.50 0.75 0.90 1.00
0.00 0.10 0.25 0.50 0.75 0.90 1.00 1 − Specificity
True positive fractio
n
Threshold
V1-V3+RT Sens Spec LR+
LR-2.00 100 19 1.24 0.00 0.60 91 81 4.68 0.11 0.40 87 92 10.40 0.15 0.10 53 97 19.20 0.48
V1-V3 + RT AUC = 0.90 (CI, .79–1.00) V1-V3 AUC = 0.88 (CI, .77–1.00) RT AUC = 0.85 (CI, .73–.96)
need for additional testing. Our multiplexing approach allows sequencing of multiple regions of HIV-1 genome with 1 reac-tion and thus is much less labor intensive than single-genome amplification. Furthermore, our simulations evaluating ambi-guity fraction among consensus RT sequences show similar results to previous studies [4]; in addition, NGS allows for the detection of multiple variants, which is another limiting factor of population-based sequencing.
While our results indicate PID-NGS is an effective method for detecting recent infection, further studies are needed to delineate scalability and generalizability. We included persons who did not initiate ART at diagnosis, which may lead to a selec-tion bias; addiselec-tionally, the impact of ART exposure on diversity measures is unknown. Rates of diversification may also differ among non-B subtypes and our cutoffs may not translate to other clades. Furthermore, definitions of recent infection vary (often defined between 2 and 12 months after infection) [15], which can limit comparisons between metrics.
Field implementation of PID-NGS to detect recent infection may be particularly suited for studies conducting NGS for drug resistance and/or phylogenetic clustering surveillance as the metric could be used without performing additional assays. The analyses are efficient as PID-NGS can be multiplexed to exam-ine multiple regions in 1 reaction and the pairwise distance calculations are computationally simple. Our results show that PID-NGS offers an accurate method to distinguish recent infec-tion from chronic infecinfec-tion in both single- and multiple-variant transmissions.
Supplementary Data
Supplementary materials are available at The Journal of Infectious Diseases online. Consisting of data provided by the authors to benefit the reader, the posted materials are not copyedited and are the sole responsibility of the authors, so questions or com-ments should be addressed to the corresponding author.
Notes
Acknowledgments. We thank participants and staff of CHAVI-001 and the UNC Center for AIDS Research (CFAR) HIV-1 Clinical Cohort.
Disclaimer. The content of this work is solely the responsi-bility of the authors and does not necessarily represent the offi-cial views of the National Institutes of Health (NIH).
Financial support. Research reported in this publica-tion was supported by the Napublica-tional Institute of Allergy and Infectious Diseases of the NIH (award numbers K08-AI112432 and R01-AI135970) and a supplement to the UNC CFAR (grant number P30-AI030410) to A. D.; in addition, this work was supported by NIH (R56-AI44667) to R. S. This work also received infrastructure support from the UNC CFAR (NIH award P30-AI50410) and the UNC Lineberger Comprehensive Cancer Center (NIH award P30-CA16068).
Potential conflicts of interest. UNC is pursuing intellectual property protection for Primer-ID, and R. S. is listed as a coin-ventor and has received nominal royalties. All other authors report no potential conflicts of interest. All authors have sub-mitted the ICMJE Form for Disclosure of Potential Conflicts of Interest. Conflicts that the editors consider relevant to the con-tent of the manuscript have been disclosed.
References
1. Rosenberg NE, Pilcher CD, Busch MP, Cohen MS. How can we better identify early HIV infections? Curr Opin HIV AIDS 2015; 10:61–8.
2. Volz EM, Ionides E, Romero-Severson EO, Brandt M-G, Mokotoff E, Koopman JS. HIV-1 transmission during early infection in men who have sex with men: a phylodynamic analysis. PLoS Med 2013; 10:e1001568.
3. Cohen MS, Dye C, Fraser C, Miller WC, Powers KA, Williams BG. HIV treatment as prevention: debate and commentary—will early infection compromise treatment-as-prevention strategies? PLoS Med 2012; 9:e1001232.
4. Meixenberger K, Hauser A, Jansen K, et al. Assessment of ambiguous base calls in HIV-1 pol population sequences as a biomarker for identification of recent infections in HIV-1 incidence studies. J Clin Microbiol 2014; 52:2977–83. 5. Novitsky V, Moyo S, Wang R, Gaseitsiwe S, Essex M.
Deciphering multiplicity of HIV-1C infection: transmission of closely related multiple viral lineages. PLoS One 2016; 11:e0166746.
6. Moyo S, Wilkinson E, Vandormael A, et al. Pairwise diver-sity and tMRCA as potential markers for HIV infection recency. Medicine (Baltimore) 2017; 96:e6041.
7. Park SY, Love TM, Nelson J, Thurston SW, Perelson AS, Lee HY. Designing a genome-based HIV incidence assay with high sensitivity and specificity. AIDS 2011; 25:F13–9. 8. Jabara CB, Jones CD, Roach J, Anderson JA, Swanstrom
R. Accurate sampling and deep sequencing of the HIV-1 protease gene using a primer ID. Proc Natl Acad Sci U S A
2011; 108:20166–71.
9. Zhou S, Jones C, Mieczkowski P, Swanstrom R. Primer ID validates template sampling depth and greatly reduces the error rate of next-generation sequencing of HIV-1 genomic RNA populations. J Virol 2015; 89:8540–55.
10. McMichael AJ, Borrow P, Tomaras GD, Goonetilleke N, Haynes BF. The immune response during acute HIV-1 infection: clues for vaccine development. Nat Rev Immunol
2009; 10:11.
12. Zhou S, Bednar MM, Sturdevant CB, Hauser BM, Swanstrom R. Deep sequencing of the HIV-1 env gene reveals discrete X4 lineages and linkage disequilibrium between X4 and R5 viruses in the V1/V2 and V3 variable regions. J Virol 2016; 90:7142–58. 13. Lorenz DJ, Datta S, Harkema SJ. Marginal association
mea-sures for clustered data. Stat Med 2011; 30:3181–91.
14. Obuchowski NA. Nonparametric analysis of clustered ROC curve data. Biometrics 1997; 53:567–78.