Search Strategies for Automatic Performance
Analysis Tools
?Michael Gerndt and Edmond Kereku
Technische Universit¨at M¨unchen, Fakult¨at f¨ur Informatik I10, Boltzmannstr.3, 85748 Garching, Germany
Abstract. Periscope is a distributed automatic online performance analysis system for large scale parallel systems. It consists of a set of analysis agents distributed on the parallel machine. This article presents the architecture of the node agent and its central part, the search strat-egy driving the online search for performance properties. The focus is on strategies used to analyze memory access-related performance properties in OpenMP programs.
1
Introduction
Performance analysis tools help users in writing efficient codes for current high performance machines. Since the architectures of today’s supercomputers with thousands of processors expose multiple hierarchical levels to the programmer, program optimization cannot be performed without experimentation.
To tune applications, the user has to carefully balance the number of MPI processes vs the number of threads in a hybrid programming style, he has to distribute the data appropriately among the memories of the processors, has to optimize remote data accesses via message aggregation, prefetching, and asyn-chronous communication, and, finally, has to tune the performance of a single processor.
Performance analysis tools can provide the user with measurements of the the program’s performance and thus can help him in finding the right transfor-mations for performance improvement. Since measuring performance data and storing those data for further analysis in most tools is not a very scalable ap-proach, most tools are limited to experiments on a small number of processors. To investigate the performance of large experiments, performance analysis has to be done online in a distributed fashion, eliminating the need to transport huge amounts of performance data through the parallel machine’s network and to store those data in files for further analysis.
Periscope [4] is such a distributed online performance analysis tool. It con-sists of a set of autonomous agents that search for performance bottlenecks in a
?
This work is being funded by the German Science Foundation under contract GE 1635/1-3
subset of the application’s processes and threads. The agents request measure-ments of the monitoring system, retrieve the data, and use the data to identify performance bottlenecks. The types of bottlenecks searched are formally defined in the APART Specification Language (ASL) [2, 1].
The focus of this paper is on the agent’s architecture and the search strate-gies guiding the online search for performance properties. We present the search strategies not for analyzing MPI programs on large-scale machines, but for an-alyzing the memory access behavior of OpenMP programs on a single shared memory node.
The next section presents work related to the automatic performance analysis approach in Periscope. Section 3 presents Periscope’s architecture. The detailed description of the agent architecture and the role of the search strategy is dis-cussed in Section 4. Search strategies implemented for memory access properties are presented in Section 5. Results from experiments are given in Section 6 and a summary and outlook in Section 7.
2
Related Work
Several projects in the performance tools community are concerned with the au-tomation of the performance analysis process. Paradyn’s [7] Performance Consul-tant automatically searches for performance bottlenecks in a running application by using a dynamic instrumentation approach. Based on hypotheses about po-tential performance problems, measurement probes are inserted into the running program. Recently MRNet [8] has been developed for the efficient collection of distributed performance data. However, the search process for performance data is still centralized.
The Expert [10] tool developed at Forschungszentrum J¨ulich performs an automated post-mortem search for patterns of inefficient program execution in event traces. Potential problems with this approach are large data sets and long analysis times for long-running applications that hinder the application of this approach on larger parallel machines.
Aksum [3], developed at the University of Vienna, is based on a source code instrumentation to capture profile-based performance data which is stored in a relational database. The data is then analyzed by a tool implemented in Java that performs an automatic search for performance problems based on JavaPSL, a Java version of ASL.
Periscope goes beyond those tools by performing an automatic online search in a distributed fashion via a hierarchy of analysis agents.
3
Architecture
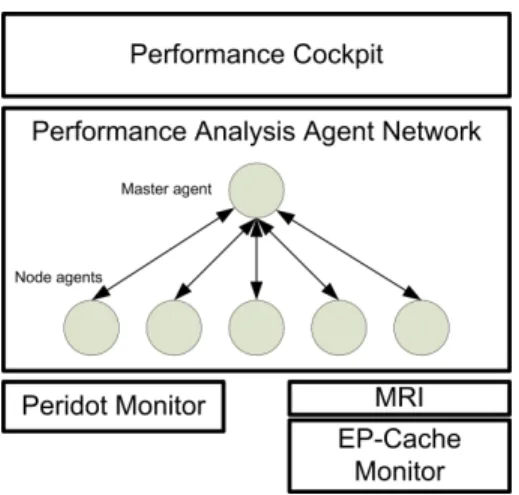
Periscope consists of a user interface, a hierarchy of analysis agents and two separate monitoring systems (Figure 1).
The user interface allows the user to start up the analysis process and to inspect the results. The agent hierarchy performs the actual analysis. The node
Fig. 1.Periscope currently consists of a frontend, a hierarchy of analysis agents, and two separate monitoring systems.
agents autonomously search for performance problems which have been specified with ASL. Typically, a node agent is started on each SMP node of the target machine. This node agent is responsible for the processes and threads on that node. Detected performance problems are reported to the master agent that communicates with the performance cockpit.
The node agents access a performance monitoring system for obtaining the performance data required for the analysis. Periscope currently supports two different monitors. The work described in this article is mainly based on the EP-Cache monitor [6] developed in the EP-Cache project focusing on memory hierarchy information in OpenMP programs.
Detected performance bottlenecks are reported back via the agent hierarchy to the frontend.
4
Node Agent Architecture
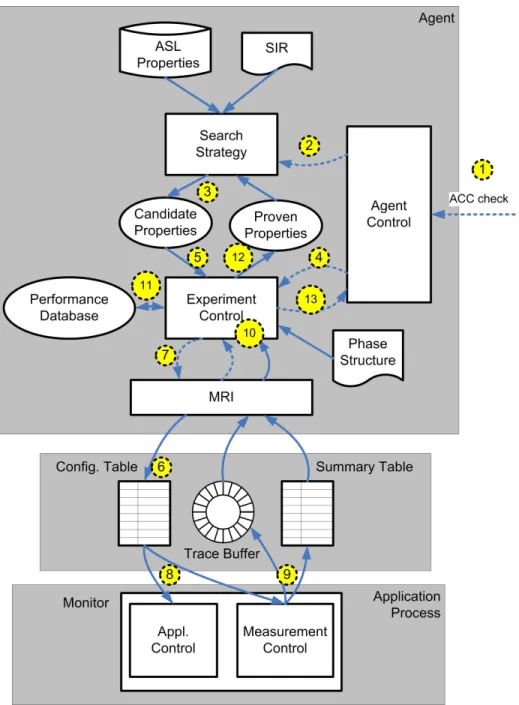
The node agents search autonomously for performance bottlenecks in the pro-cesses/threads running on a single SMP node. Figure 2 presents the architecture and the sequence of operations executed within a node agent.
The figure consists of three main parts, the agent, the monitor, and the data structures coupling the agent and the monitor. These data structures reside in a shared memory segment and are used to configure the monitoring as well as to return performance data.
The agent’s main components are the agent control, the search strategy, and the experiment control. As presented in Section 3, the node agent is part of an agent hierarchy. Themaster agentstarts the bottleneck search via theAgent Control and Command (ACC) message ACC checkmarked as (1) in the
Fig. 2.The agent’s search is triggered by a control messageACC checkfrom its parent in the agent hierarchy. Performance data are obtained from the monitor linked to the application via the Monitor Request Interface (MRI)
diagram. Before the message is sent, the application was started and suspended in the initialization of the monitoring library linked to the application. In addition the node agent was instructed to attach to the application via the shared memory segment.
The agent performs amultistep bottleneck search. Each search step starts (2) with determining theset of candidate performance propertiesthat will be checked in the next experiment. This candidate set is determined by asearch strategy based on the set of properties found in the previous step (3). At the beginning, the set of evaluated properties is empty. The applied search strategy is determined when the agent is started. Most of the strategies take also the program’s structure into account.
Thesource code instrumenter used for insertion of the monitor library calls [5] generates information about the program’s regions (main routine, sub-routines, loops, etc.) and the data structures used in the program in the Stan-dard Intermediate Program Representation (SIR)developed in the Euro-pean American APART working group on automatic performance analysis tools. The SIR is an XML-based language defined for C++, Java, and Fortran [9].
After the candidate set was determined, the agent control starts a new ex-periment (4). The experiment controlaccesses all the properties in the can-didate set and checks whether the required performance data for proving the property are available. If not, it configures the monitor via newMRI measure-ment requests. The requests, such asmeasure the number of cache misses in the parallel loop in line 52 in file foo.f, are inserted into a con-figuration table (6).
Once all the properties were checked for missing performance data, the exper-iment is started (7). The MRI provides anapplication control interfacethat allows the experiment control to release a suspended application and to specify when the application is suspended again to retrieve the performance data.
This approach is based on the concept of program phases. Usually pro-grams consist of several phases, e.g., an initialization phase, a computation phase, and a termination phase. Frequently the computation phase is repetitive, i.e., it is executed multiple times. Such repetitive phases can be used to perform the multistep search of the node agent. Program phases need to be specified by the user. We provide two ways for specification. The user can mark program parts as a user region via directives that are replaced by calls to the monitoring library by the source instrumenter. As an extension, phases can also be marked by manual insertion ofphase boundary function callsthat specify additional properties of the phase, e.g., whether it is a repetitive phase or a execute-once phase. Currently, our prototype supports the specification of a single user re-gion which is assumed to be repetitive. If no such rere-gion is specified, the whole program is taken as a phase and is restarted to perform additional experiments. During program execution, themonitoring librarychecks whether the end of the current phase is reached (8) and configures hardware and software sensorsfor measuring the requested performance data. These data are inserted
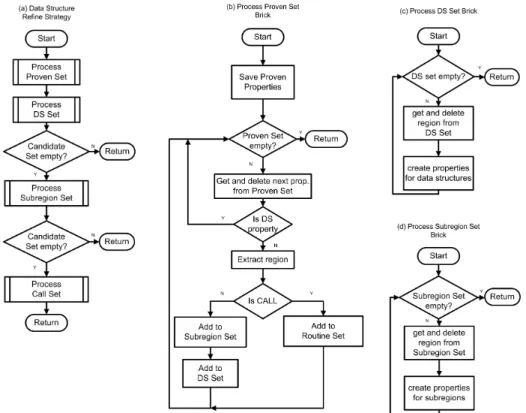
Fig. 3. Implementation of the strategy that refines the search with respect to data structures, subregions, and called subroutines.
into a trace buffer (9) if trace information is requested or into a summary tableif aggregated information is to be computed.
When the application is suspended (10) the experiment control is informed by the MRI and it retrieves the measured performance data via the MRI into the internal performance database(11). Trace data are handled differently. If the trace buffer is filled during execution, a callback function of the agent is triggered to extract the data into the performance database. Currently our node agent does not use this feature. All the performance properties are based on summary data.
The experiment control evaluates the candidate performance properties and inserts the proven properties into theproven properties set(12). At the end of this search step, the control is returned to the agent control (13).
5
Search Strategies
Periscope currently supports a number of search strategies. The strategies pro-vide a simple interface which consists of a routine creating an initial candidate
set and a refinement routine that determines from the set of proven properties a new candidate set for the next search step. Since the node agent only accesses those routines, search strategies can be implemented as classes that are dynam-ically loaded and thus, without having to recompile the agent if a new strategy is available.
Search strategies are based on a number of strategy bricks supporting reuse of code. Figure 3 introduces theData Structure Refine Strategy which was designed to perform a search for memory access inefficiencies. It takes a memory access-related property and searches for occurences of this property in the program’s execution. The refinement is based on a novel feature of the EP-Cache monitor. It not only provides measurements of cache misses etc. via hardware counters for program regions, but allows to restrict measurements to address regions. Thus, the agent can check properties that are related to individual data structures, e.g.,high number of cache misses for array A in loop 20.
The refinement routine in Figure 3.a first processes the set of proven proper-ties from the previous search step. It then refines proven properproper-ties with respect to the data structures accessed in the program region (Fig. 3.c). After analyzing the current set of program regions with memory access inefficiencies with respect to the data structures, these regions are further analyzed with respect to their subregions (Fig. 3.d) in the next search step. If no refinement of the current set of proven properties with respect to data structures and subregions is possible, properties found for individual subroutine calls are further investigated. The strategy brick Process Call Setis not shown in the figure. It is very similar to the two bricks discussed before, but also keeps track of the already checked subroutines. Since there might be multiple call sites, redundant searches of a subroutine would be possible otherwise.
The missing strategy brick is Process Proven Set (Fig. 3.b). This brick starts with saving the found properties since all the properties are ranked ac-cording to their severity and presented to the user of Periscope. Then all the properties are analyzed and classified for further refinement. If a property is already data structure-related, it is not further refined. Otherwise the region is extracted and either added to theSubregion Set and to theDS Setor to the Routine Set. The strategy bricks process these sets and generate more precise candidate properties.
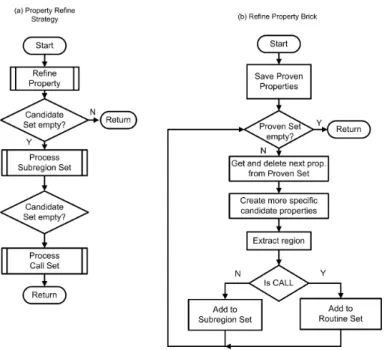
Figure 4 presents a second implemented search strategy. Instead of refining the properties with respect to the data structures, it refines with respect to more specific property types. This refinement is based on the specification of a property hierarchy. For example, the property LC2DMissRateInSomeThread is refined into the more precise property UnbalLC2DMissRate. The first property only highlights a cache problem in a thread while the second gives information about the relative behavior of all threads. Other obvious refinements are from a property identifying a high number of cache misses to individual properties for read and write misses and for local vs remote misses on ccNUMA architectures.
Fig. 4.Strategy that refines proven properties with respect to more specific properties in the property hierarchy.
6
Experiments
We tested the search strategies with several OpenMP examples. Here, we present the results for the SWIM benchmark from the SPEC benchmark suite. The first experiment analyzes a sequential run of SWIM with the Data Structure Refine Strategy. Periscope was used to search for severe LC3 miss rate. The results of the search are presented in form of search paths which show the re-finements on region level and on data structures.
The results of the automatic search for SWIM
Region LC3MissesInThread
Application Phase( USER_REGION, swim.f, 84 )
calc2( CALL_REGION, swim.f, 92 ) 0.022 calc2( SUB_REGION, swim.f, 315 )
( PARALLEL_REGION, swim.f, 332 0.028 ( DO_REGION, swim.f, 336 ) 0.028 Application Phase( USER_REGION, swim.f, 84 )
calc2( CALL_REGION, swim.f, 92 ) 0.022 calc2( SUB_REGION, swim.f, 315 )
unew( DATA_STRUCTURE, swim.f, 3 ) 0.279 vnew( DATA_STRUCTURE, swim.f, 3 ) 0.281 pnew( DATA_STRUCTURE, swim.f, 3 ) 0.281 Application Phase( USER_REGION, swim.f, 84 )
calc2( CALL_REGION, swim.f, 92 ) 0.022 calc2( SUB_REGION, swim.f, 315 )
( LOOP_REGION, swim.f, 360 ) 0.053 Application Phase( USER_REGION, swim.f, 84 )
( DO_REGION, swim.f, 116 ) 0.046 unew( DATA_STRUCTURE, swim.f, 3 ) 0.046 vnew( DATA_STRUCTURE, swim.f, 3 ) 0.046 pnew( DATA_STRUCTURE, swim.f, 3 ) 0.046 Application Phase( USER_REGION, swim.f, 84 )
calc3z( CALL_REGION, swim.f, 145 ) 0.043
The severity shown is simply the miss rate. If the severity is redefined to take into account also the amount of time spent in the code region, the last found property for routineCALC3Zis the most critical.
We also tested SWIM on the SGI Altix Bx2 at Leibniz Computing Centre. We run it with 16 and 32 threads on this ccNUMA architecture and applied the Refine Property Strategyfor cache problems on the level two data cache. The results for SWIM running with 16 threads
Region LC2DMissRateInSomeThread UnbalC2DMissRate (DO_REGION,swim.f,437) 0.36 3.24
(DO_REGION,swim.f,294) 0.29 14.91 (DO_REGION,swim.f,354) 0.29 5.67 (DO_REGION,swim.f,116) 0.08 ---The results for SWIM running with 32 threads
(DO_REGION,swim.f,437) 0.30 11.97 (DO_REGION,swim.f,354) 0.24 16.46 (DO_REGION,swim.f,116) 0.08 0.74
SWIM has cache problems on almost the same regions in both configurations. What we observe is that the problem of unbalanced cache misses is aggravated when running with 32 threads.
7
Summary
Periscope is an automatic performance analysis tool for high-end systems. It applies a distributed online search for performance bottlenecks. The search is executed in an incremental fashion by either exploiting the repetitive behavior of program phases or by restarting the application several times.
The search strategies defining the refinement of found properties into new candidate properties are loaded dynamically so that new strategies can be inte-grated without recompilation of the tool.
This article presented the architecture of the agents and the integration of the search strategy with the agent’s components and the monitoring system. Search strategies are assembled from building blocks called search bricks. The presented strategies have been developed for searching memory access inefficien-cies in OpenMP codes.
Future work will focus on developing search strategies that take into account instrumentation overhead, the limited number of resources in the monitor, the progress of the search in other agents etc. The work presented here is a starting point for the development of more intelligent automatic performance analysis tools.
References
1. T. Fahringer, M. Gerndt, G. Riley, and J. Tr¨aff. Knowledge specification for au-tomatic performance analysis. APART Technical Report, www.fz-juelich.de/apart, 2001.
2. T. Fahringer, M. Gerndt, G. Riley, and J.L. Tr¨aff. Specification of performance problems in MPI-programs with ASL. International Conference on Parallel Pro-cessing (ICPP’00), pp. 51 - 58, 2000.
3. T. Fahringer and C. Seragiotto. Aksum: A performance analysis tool for parallel and distributed applications. Performance Analysis and Grid Computing, Eds. V. Getov, M. Gerndt, A. Hoisie, A. Malony, B. Miller, Kluwer Academic Publisher, ISBN 1-4020-7693-2, pp. 189-210, 2003.
4. M. Gerndt, K. F¨urlinger, and E. Kereku. Advanced techniques for performance analysis. Parallel Computing: Current&Future Issues of High-End Computing (Proceedings of the International Conference ParCo 2005), Eds: G.R. Joubert, W.E. Nagel, F.J. Peters, O. Plata, P. Tirado, E. Zapata, NIC Series Volume 33 ISBN 3-00-017352-8, pp. 15-26a, 2006.
5. M. Gerndt and E. Kereku. Selective instrumentation and monitoring.International Workshop on Compilers for Parallel Computers (CPC 04), 2004.
6. E. Kereku and M. Gerndt. The EP-Cache automatic monitoring system. Interna-tional Conference on Parallel and Distributed Systems (PDCS 2005), 2005. 7. B.P. Miller, M.D. Callaghan, J.M. Cargille, J.K. Hollingsworth, R.B. Irvin, K.L.
Karavanic, K. Kunchithapadam, and T. Newhall. The Paradyn parallel perfor-mance measurement tool. IEEE Computer, Vol. 28, No. 11, pp. 37-46, 1995. 8. Ph. C. Roth, D. C. Arnold, and B. P. Miller. MRNet: A software-based
multi-cast/reduction network for scalable tools. SC2003, Phoenix, November, 2003. 9. C. Seragiotto, H. Truong, T. Fahringer, B. Mohr, M. Gerndt, and T. Li.
Stan-dardized Intermediate Representation for Fortran, Java, C and C++ programs.
APART Working Group Technical Report, Institute for Software Science, Univer-sity of Vienna, Octorber, 2004.
10. F. Wolf and B. Mohr. Automatic performance analysis of hybrid MPI/OpenMP applications. 11th Euromicro Conference on Parallel, Distributed and Network-Based Processing, pp. 13 - 22, 2003.