Opportunity
The landscape of the medical technology,
medical biotechnology and industrial biotechnology
sectors in the UK
Contents
Ministerial Foreword Executive Summary Introduction
Pharmaceutical Sector
Bioscience & Health Technology Database 2010 Chapter 1: Global Market Overviews
1.1 Medical Technology Market 1.2 Medical Biotechnology Market 1.3 Industrial Biotechnology Market Chapter 2: Medical Technology Sector
2.1 Sector Definition 2.2 Sector Overview
2.3 Turnover, Employment and Segmentation 2.4 Company Size and Activity
2.5 UK Profile
2.6 Medical Technology Pipeline and Sector Investment 2.7 Trade
2.8 Geographical Distribution of Medical Technology Companies Chapter 3: Medical Biotechnology Sector
3.1 Sector Definition 3.2 Sector Overview
3.3 Turnover, Employment and Segmentation 3.4 Company Size and Activity
3.5 UK Profile
3.6 Medical Biotechnology Pipeline
1 2 6 8 10 11 11 11 12 13 13 13 13 19 20 24 25 26 28 28 28 29 33 35 37
Chapter 4: Industrial Biotechnology Sector 4.1 Sector Definition
4.2 Sector Overview
4.3 Turnover, Employment and Segmentation 4.4 Company Size and Activity
4.5 UK Profile
4.6 Geographical Distribution of Industrial Biotechnology Companies Appendix I: Acknowledgements
Appendix II: Database Construction Methodology and Segmentation Appendix III: Segmentation Reference Chart
Appendix IV: References
41 41 41 42 44 47 48 50 52 54 56
Ministerial Foreword
The UK life sciences industry is a high-tech and innovative industry which is vital to the economic prosperity and growth of the UK. Life sciences businesses will help us to meet the big societal challenges of our age from addressing the needs of an ageing population through developing advanced diagnostics and medicines, to improving our sustainability and ability to feed a growing population.
Collaboration between Government, industry and the national and regional support networks is an important component of the UK’s strength in life sciences. Begun in June 2008, the database of companies active in the Medical Technology, Medical Biotechnology and Industrial Biotechnology sectors across the UK is a key example of this collaborative approach. This initiative has enhanced our understanding of these sectors and forms an important part of the evidence base on which policy development depends.
It also supports UKTI’s work in promoting the UK Life Science industry to overseas procurers, investors and influencers, and a public facing Company Directory is being developed using a sub-set of the information from the database to highlight UK capabilities to both national and international markets.
The first analysis and commentary document from the database, entitled “Strength and Opportunity: The landscape of the medical technology, medical biotechnology and industrial biotechnology enterprises in the UK,” was published in December 2009. We are pleased to see that many organisations and Government Departments are using the data to promote these enterprises in the UK.
Since last year’s publication, the database has been updated and we are delighted to present this updated commentary, which forms the second report in an annual series. The commentary reveals the continued strength of these sectors in the UK. This covers over 4000 companies, spread across the UK, employing approximately 93,500 people and generating a turnover of nearly £19bn.
We are pleased to see the positive outcome of this continued collaboration and would like to thank all those who have given their time and expertise.
The Rt Hon David Willetts MP
Minister of State for Universities and Science DEPARTMENT FOR BUSINESS,
INNOVATION AND SKILLS
Earl Howe
Parliamentary Under Secretary of State for Quality
Executive Summary
In 2010 the medical technology and diagnostics, medical biotechnology and industrial biotechnology landscape in the UK contains just over 4,000 companies, with a combined turnover of £19bn, employing 93,500 people across the UK. The sectors overlap in terms of the technologies used in the products and services or in the market addressed. The medical and industrial biotechnology sectors are based on the application of life science for the production of new medicines and industrial processes or products. The medical technology and biotechnology sectors produce products and services for the global healthcare industry and the NHS.
This commonality of science and market applies equally to the pharmaceutical sector, which has traditionally developed medicines based on chemistry and sells into healthcare markets around the world. Over the last 10-15 years the pharmaceutical industry has increasingly applied biotechnology to enhance the discovery, development and testing of new medicines. As these technologies have been applied, new types of medicines have been developed to complement chemically derived products including those containing antibodies, DNA and stem cells. The pharmaceutical industry, with a turnover of £15bn in 2008 and employing 45,000 people shares a common heritage with the sectors covered in Bioscience & Healthcare Technology Database.
The medical technology, medical biotechnology and industrial biotechnology sectors in the UK are competing for a share of global markets which are exhibiting strong growth rates. The global medical technology market is estimated to be worth £150-170bn1 and the proportion of healthcare expenditure spent on medical technology is increasing. The global medical biotechnology market is estimated to be worth nearly £50bn and is rapidly growing its share of the total medicines market. Worldwide interest in the application of biotechnology to industrial production has created the potential for significant growth. This market is forecast to grow to £150-360bn by 20252.
With growing multi-billion global markets, a strong UK science base and an existing company base supported by a strong supply chain, the medical technology, medical and industrial biotechnology sectors have shown resilience against the background of a global recession. Figure 1 shows turnover, employment and company numbers comparison data between 2009 to 2010 for all three sectors. Whilst the number of companies has shown a modest decline in all three sectors due to mergers & acquisitions and companies ceasing trading, employment has increased in all three by on average 3%. Turnover comparisons show an excellent performance with medical biotechnology posting 18% growth in one year and medical technology achieving a 4% growth. A small decrease in turnover in the industrial biotechnology market and a large increase in employment of 16% suggests that this industry is emerging and continuing to invest in the capability to drive future growth.
1 The Medical Device Market: United Kingdom”, March 31st 2009, Espicom Business Intelligence
2 IB 2025 Maximising UK Opportunities from Industrial Biotechnology in a Low Carbon Economy: A report to government by the Industrial Biotechnology Innovation and Growth Team May 2009
Figure 1.Company Numbers, Turnover and Employment for the UK medical technology, medical and industrial biotechnology sectors between 2009 and 2010
Executive Summary 20 Change 2009 to 2010 15 10 5 Percentage 0 -5
Company Turnover Employment
Numbers -10
Medical Biotechnology Medical Technology Industrial Biotechnology
Medical Technology Sector
The UK medical technology sector in 2010 consists of 3,034 companies generating a
turnover of £13.1bn and employing 55,000 individuals, producing a diverse range of products from positron emission tomography for advanced imaging and diagnosis to surgical gowns and instruments. While all segments of the sector have significant turnover, the four largest segments are single use technology, in-vitro diagnostic technology, orthopaedic devices and wound care management, all with turnovers exceeding £1bn and together comprising nearly 40% of the entire sector turnover. The sector exhibits strong export performance growing 23.4% in USD in the first two months of 2010.
The sector is dominated by small medium size enterprises (SMEs) which make up 99% of the sector but has a significant number of large companies with 71 of these having more than 100 employees. The largest employment segment consists of specialist suppliers which make up a sophisticated supply chain employing 7,600 people in areas such as regulatory advice, contract design and contract manufacturing.
The year on year comparison in company numbers, turnover and employment shows a resilient sector, with a 3% decline in company numbers having a minor impact on a turnover and employment growth of 3-4%. The decline in company numbers also masks the creation of 10 new companies over the year. The aggregate growth in turnover contains some
high performing segments such as the implantable devices, anaesthetic and respiratory segments which all grew by over 10%.
The medical technology sector in the UK is widely dispersed across the country as shown in the maps in Section 2.8. Concentrations of economic activity based on turnover and employment are identifiable in the West Midlands, East of England and the South East.
The industry exhibits good levels of innovation with 25% of all companies in the database indicating they are conducting research and development. Between 2004-2008, the UK industry had 80-100 medical devices gaining approval for marketing in the USA. This high level of innovation and large global markets has historically attracted investment into the sector. However, in 2008-2009 this dropped significantly against the background of a global recession.
Medical Biotechnology Sector
In 2010 the UK medical biotechnology sector consists of 942 companies generating a turnover of £5.5bn and employing 36,700 people. The sector uses a range of technologies from chemistry to the latest developments in stem cell science to produce medicines and other therapeutics to treat disease such as cancer, central nervous system disorders and infections. Over 50% of companies use the latest biotechnologies such as gene therapy and stem cells. The largest segment in terms of turnover at £2.6bn, are the 557 specialist suppliers that include contract research organisations, manufacturers and suppliers of specialist technology services such as genomics and proteomics. This complex supply chain supports companies developing and marketing medicines, that generate a turnover of £2.7bn, with small molecule, antibody and therapeutic protein companies representing the largest segments. Across the sector, 63% of all companies have activity in central nervous system, oncology, infection and immune therapies.
The sector is composed of 97% SMEs and 28 larger companies that employ 250 or more employees. The UK is home to 165 medical biotechnology companies with a turnover in 2010 of greater than £5m. The sector has a mix of start-up and established companies with 14% companies less than three years old and 42% established for over 10 years. The advanced therapy medicinal products or regenerative medicine segment contains the youngest companies.
The sector shows rising turnover and employment progression, with an 18% growth in turnover and a 3% growth in employment between 2009 and 2010. The small molecule, therapeutic proteins and specialist services (which includes Contract Research Organisations and Contract Manufacturing Organisations) all achieved over 10% growth in turnover
between 2009 and 2010. However, the sector had a 4% drop in the number of companies. The sector shows greater geographical concentration than the medical technology and industrial biotechnology sectors, with the East of England accounting for 27% of all turnover, 24% of all employees and 24% of all companies. Other major concentrations of economic activity are to be found in Scotland and the North West of England.
The UK medical biotechnology sector has a strong track-record in taking products from research into development. An analysis of the pipeline of products for the companies in the database shows 465 therapies in all stages from discovery to regulatory filing. Small molecule products are the largest class and 46% of all products are based on the advanced biotechnologies such as proteins, antibodies and gene therapy.
Executive Summary
Industrial Biotechnology Sector
The UK has a number of companies that are developing, manufacturing and marketing industrial products and services based on biotechnology. This sector of companies is key to the development and scale-up of industrial biotechnology and its adoption into the wider industrial manufacturing sector. There are 55 companies in the UK whose prime activity and turnover is derived directly from the application of biotechnology to make industrial products. The sector shows a turnover of £308m in 2010 and employs over 1000 people. Not captured in these numbers is the economic activity that is associated with the use of the products or processes produced by these companies. For example, the production of a pharmaceutical intermediate by a large pharmaceutical company using an enzyme developed and sold by one of these 55 companies would not be included.
Fine & speciality chemicals, food & drink, and biofuels make up the largest number of product and process companies, representing 48% of the sector turnover. These companies are supported and complemented by a group of specialist suppliers providing items such as engineering equipment, design and analytical services. The most frequently employed technology across the sector is fermentation followed by biomass processing. An analysis of the business activities of companies shows that a majority are involved in research & development and manufacturing.
The industrial biotechnology sector is mainly composed of SMEs with 86% of the companies being formed over four years ago.
Overall between 2009 and 2010, the comparison shows a large increase in employment of 16% and a 2% decrease in turnover. These numbers mask a strong performance in the pharmaceutical intermediates segment and a 19% decrease in turnover for biofuel companies.
The small number of companies makes conclusions about geographical concentration in the UK of limited value. Initial observations show large percentages of the UK turnover located in the North West of England and in Yorkshire and Humberside.
Introduction
The UK life sciences industry is an example of a high-tech and innovative industry where excellence in science is translated into commercial success, requiring highly skilled workers and strong collaboration between industry, academia and the public sector. The industry brings the UK economic growth and job creation, as well as broader social and environmental benefits. The industry has a major contribution to the delivery of high-quality healthcare, modern manufacturing and industrial processes and to the transition to a low carbon economy.
The UK’s life sciences industry has strengths across all of its sectors and those in the medical technology, medical biotechnology and industrial biotechnology sectors are clearly demonstrated in this report. The medical biotechnology sector leads Europe in the number of drugs in all stages of clinical development3. The UK medical technology industry is the second largest in Europe4 and has a strong track record of innovation. Currently UK companies lead Europe in having the most number of devices undergoing clinical development for registration in the US5.
Industrial biotechnology is starting to provide economic benefits to companies through lower operating costs, increased productivity and a reduced environmental footprint. Indeed, this emerging technology has the potential to play an essential part in the creation of a low-carbon knowledge based bio-economy in the UK. It is expected that biotechnology in industry and primary production will contribute to 2.7% of the GDP across OECD countries by 2030 (in contrast to less than 1% in 2004)6.
The need for better industry data to allow policy makers to understand more fully the medical technology, medical biotechnology and industrial biotechnology sectors was raised by various government and industry initiatives. The Standard Industrial Classification (SIC) codes used by the Office for National Statistics (ONS) do not provide a comprehensive picture of the life sciences industry and its specialist support organisations.
The Department for Business Innovation and Skills (BIS), the Department of Health (DH) and UK Trade and Investment (UKTI) collaborated with the regional and national networks that support these sectors, to develop a database of companies that are active in the UK in the medical technology, medical biotechnology and industrial biotechnology sectors. The Biotechnology and Health Technology Database is now in use across these three government departments.
This comprehensive in-house data resource is improving the understanding of these sectors and facilitating effective and evidence based policy development that is benefiting industry. Furthermore, UKTI use this information to promote the UK’s Life Science industries to overseas procurers, investors and influencers as part of the UK Life Sciences Marketing Strategy.
3 Beyond Borders. Global biotechnology report 2009. Ernst and Young 4 EUCOMED Medical Technology Brief 2007
5 BioPharm Insight
Introduction
This report is the second in the series that analyses the information contained in the database, supplemented by data from other sources. The report uses the updated 2010 data set and allows policy makers to compare against last year’s information to see how these sectors are changing. The detailed analysis of each sector is contained in the individual chapters. The sector and sub-sector definitions, the methodology used and summary
Pharmaceutical Sector
As the life sciences industry has grown over the last 20 years, the sector classification of pharmaceutical, biotechnology and medical technology has become increasingly blurred. Pharmaceutical companies were traditionally defined as companies that developed drugs based on the discovery and development of small molecules. Increasingly, as the potential and success of so called large molecules such as peptides, antibodies and nucleic acids has been demonstrated, the portfolios of pharmaceutical companies have changed to accommodate these new technologies.
The changes in the healthcare market over the last 10 years has challenged many of the business models of the pharmaceutical companies who have responded by embracing the new technologies of biotechnology and diversifying into areas such as diagnostics and consumer healthcare. With this continuing trend it has become increasingly difficult to separate pharmaceutical business from biotechnology. Equally, large biotechnology companies are not excluding small molecules from their portfolios and all companies involved in life sciences apply biotechnology tools and techniques in the discovery and development of new therapies.
The Bioscience & Health Technology Database excludes the activities of large pharmaceutical companies in the discovery and development of small molecule drugs but includes data on their biologics activities where this can be separately identified. To provide a more complete picture of the UK life sciences industry, key data on the pharmaceutical sector is summarised below to complement the data emerging from the database.
Many of the world’s leading pharmaceutical companies have significant manufacturing and/ or R&D operations in the UK. Two leading companies, GSK and AstraZeneca, have their corporate headquarters here and the world’s largest pharmaceutical company, Pfizer, has its only major R&D centre outside the US at Sandwich in Kent.
Figures from the Business Enterprise R&D survey show that 27,000 people7 were employed in industry-based pharmaceutical R&D in the UK in 2008.
In 2008, around 45,000 people were employed in 375 companies for which the primary activity is classed as pharmaceutical manufacturing8. This may exclude companies for which the primary focus in the UK is non-manufacturing activities such as R&D or regulatory work and employment in companies such as Contract Research Organisations (CROs) to which pharmaceutical companies are increasingly outsourcing activities, such as R&D, regulatory, administrative and marketing functions.
7 Full Time Equivalents. ONS Business Enterprise Research & Development 2008 8 ONS Annual Business Inquiry 2008, data collected under SIC 2007
Pharmaceutical Sector
Pharmaceutical manufacturing companies had a turnover of £15.2bn in 2008 and
accounted for £8.6bn in Gross Value Added (GVA), some 5.76% of all manufacturing GVA9. Pharmaceutical exports in 2009 were £21.3bn (up from £18bn in 2008), the largest of any manufacturing category with a positive trade balance overall of £7.2bn10 (Note: exports apparently exceed turnover, however not all exports of pharmaceuticals will have originated with those companies classified primarily as pharmaceutical manufacturers in the Annual Business Inquiry).
Pharmaceutical companies spent £4.3bn in the UK in 2008 on internal R&D, funding 27% of all such industrial R&D in the UK. A further £824m was spent on external R&D within the UK. Of the £4.3bn spent on internal R&D, £227m was capital expenditure and £1.7bn on salaries and wages11. There is more pharmaceutical R&D spend in the UK than any other European country and approximately 20% of European R&D spend in 2008 was in the UK12. Globally, only the US and Japan account for more pharmaceutical R&D spend13.
9 ONS Annual Business Inquiry 2008. data collected under SIC 2007 10 ONS UK Trade in Goods Analysed in Terms of Industry
11 ONS Business Enterprise Research & Development 2008
12 European Federation of Pharmaceutical Industries and Associations 2010 13 OECD STAN R&D Expenditure in Industry (ISIC Rev.3) – ANBERD ed 2009
Bioscience & Health
Technology Database 2010
After the completion of the Bioscience & Health Technology database construction and the publication of the commentary document in December 2009, a review of the database content was undertaken. As a result of this analysis, a number of adjustments were made to the 2009 dataset to improve the accuracy following comments received from the data partners. As a result of these changes, the 2009 dataset was adjusted to include 445 companies that were now deemed to be in scope (i.e. approximately 10% or more of their turnover could be attributed to one of the major segments). 85 companies were removed from the database as these were deemed to be duplicates or out of scope.
In addition to the changes to companies included in the database, the turnover in scope of 65 companies was adjusted to better reflect their activities. These turnover changes were primarily for larger companies with a turnover of greater than £50m. Company financial data was improved across the 2009 data set due to better matching of the data received with external sources. These changes included financial data on 476 of companies in the 2009 dataset.
The overall impact of these changes is that the database in 2010 contains 4,220 individual company sites with a total turnover of all activity in scope of £19bn.
In total there are 1,740 companies in the database with 2009 and 2010 financial information. Turnovers within these companies account for a total of £13.5bn and therefore cover a significant portion of total turnover. Financial information on all companies in the database is not possible due to the exemptions allowed to small companies to file abbreviated accounts. There are 3,084 companies with information on employment for both years, accounting for a total of 64,140 employees. Therefore, where comparisons are presented in the commentary, it is based on a subset of the total number of companies in the database.
Chapter 1
Global sector Market
Overviews
The medical technology, medical biotechnology and industrial biotechnology sectors in the UK are linked either by their focus on a common marketplace (healthcare) and/or by their use of common technologies. From an economic perspective they are important in that each sector typically produces higher value products and services for markets which are or have the potential to be global in scale and require innovation for continuing success.
1.1.
Medical Technology Market
The medical technology market is estimated to be worth £150-170bn worldwide with growth rates forecast at 10% per annum over the next 5-6 years and the market size will approach £300bn by 201514. This growth is driven by the ageing of the world’s population and the per capita income increases in healthcare expenditure across developed countries.
Overall in Europe, medical technology expenditure is 6% of total healthcare expenditure and is increasing with new innovations expanding the capability of the technology15. The USA is the largest market worth just over £70bn and has a strong supply base with the majority of world’s largest medical technology companies originating in the country. Europe is the second largest market worth £57bn with a supplier base of 11,000 companies employing some 435,000 people16.
1.2.
Medical Biotechnology Market
The explosion of knowledge and understanding of biology including genetics, biochemistry and physiology has enabled innovative companies to develop new, effective and safe
treatments for diseases such as cancer and diabetes. The application of new techniques has allowed major pharmaceutical companies and start-ups to identify new targets for small and large molecule based drugs. The database and the analysis in this commentary include SMEs that are developing both types of compounds.
Therapies based on small molecules represent the largest proportion of sales in the global pharmaceutical market. However, drugs developed from large molecules are the fastest growing group, currently accounting for 17% of global pharmaceuticals sales17. The market associated with large molecules (or medical biotechnology), shows that currently there are approximately 145 products on the market with 11% of all clinical trials involving a large molecule or biotechnology based product18. The global medical biotechnology market is estimated to be worth £45-48bn with growth rates of more than 20% per annum between 2002-07 which is more than double the rate for the pharmaceutical market19. The USA is the largest single market with 65% of all sales, followed by Europe which represents 30% of the global market20. The major classes of products are, erythropoietins, anti-cancers, and
anti-diabetic treatments accounting for some 45% of all sales21.
14 The Medical Device Market: United Kingdom”, March 31st 2009, Espicom Business Intelligence 15 Eucomed Medical Technology Brief, May 2007
16 http://www.eucomed.org/~/media/7804F449C2154F8E9207E8E57B19DD4B.ashx 17 IMS Health, MIDAS, MAT Mar 2009
18 Consequences, Opportunities and Challenges of Modern Biotechnology in Europe, April 2007, JRC, European Commission
19 IMS Health, MIDAS, MAT Mar 2009 20 IMS Health, MIDAS, MAT Mar 2009 21 IMS Health, MIDAS, MAT Mar 2009
In Europe the medical biotechnology sector is a major employer with 96,500 people employed in approximately 2,200 companies. The industry is research intensive, with
European companies spending around £6.6bn per annum on research and development22.
1.3.
Industrial Biotechnology Market
The industrial biotechnology market is relatively new and emerging with the potential to achieve sales of £150-360bn in the chemical sector alone by 2025 from a base, worth an estimated at £35-53bn world-wide23. This strong growth potential is driven by the ability to provide alternative production processes for oil or gas based chemicals. For example, the use of biological process to produce ethanol or new polymers for plastics has the potential to contribute to the reduction in the dependence of the world’s economies on relatively high carbon consuming processes. Around the world, governments are investing significant resources in underpinning research. The OECD reports twenty-one governments budgeted to invest £280m into biofuels research alone in 200724.
22 Biotechnology in Europe: 2006 Comparative Study, Critical I
23 Maximising UK Opportunities from Industrial Biotechnology in a Low Carbon Economy, A report to government by the Industrial Biotechnology Innovation and Growth Team, May 2009
Chapter 2
Medical Technology Sector
2.1.
Sector Definition
The definition used for companies included in the medical technology and diagnostics sector are those whose major business activity involves the development, manufacture, or distribution of medical devices as defined by European Union Medical Devices Directive (93/42/ECC) and companies who have significant activity, defined as more than 10% of their turnover, in supplying specialist services into the sector. Examples of companies in the professional services segment include those providing regulatory advice or design consultancy to medical technology companies. These companies represent a vital part of the overall supply chain and 14% of the sector employment. This sector definition is wider than that typical adopted which tends to primarily focus on the regulatory definition of a medical device. However, in the context of analysing the overall economic impact and trend of the medical technology sector, it is important to include companies that provide vital services to companies whose primary activity is the development, manufacturing and selling of medical technology.
2.2.
Sector Overview
In 2010 the UK medical technology sector within the Bioscience & Health Technology Database, contains 3,034 companies, which employ over 55,625 individuals and have a combined annual turnover of £13.1bn. Single use technology, in-vitro diagnostics, orthopaedic devices and wound care are the four largest segments all with turnovers
greater than £1bn. There has been a 3% decrease (a loss of 82 companies) in the number of medical technology companies between 2009 and 2010 although this masks the formation of 10 new companies in the year. The sector has experienced a 3% increase in the number of employees and a 4% increase in turnover in the sector, led by ophthalmic devices and implantable devices companies respectively.
The sector is widely distributed across the UK, with concentrations of turnover and employment in the West Midlands, East of England, and the South East. The sector is dominated by SMEs who make up 99% of all companies in the sector. Within this number there are 425 companies with turnover greater than £5m.
2.3.
Turnover, Employment and Segmentation
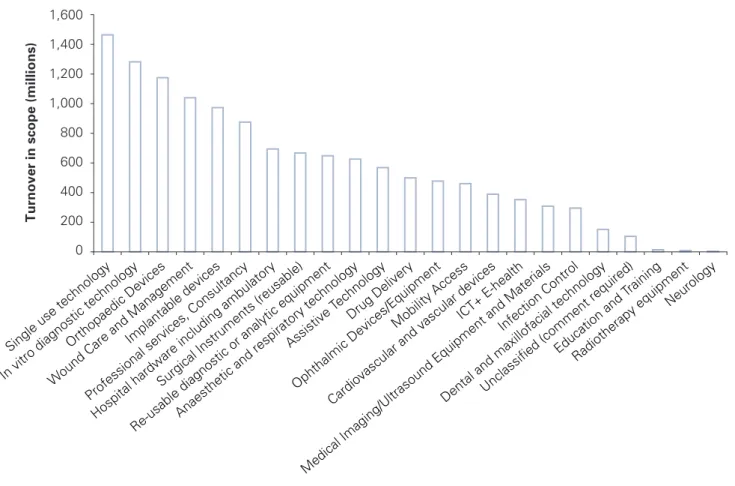
The total turnover within each segment is shown in Figure 2. Single use technology, in vitro diagnostic technology, orthopaedic devices and wound care management are the top four segments by turnover, with combined sales totalling almost £5bn in 2010. The top segments are consistent with those highlighted in 2009. However, single use technologies have risen from 4th to 1st, while wound care has fallen from 1st to 4th place. This is a consequence of a drop in UK turnover in the wound care market. These four segments make up 38% of the total UK turnover in medical technology compared to 40% in 2009.
Figure 2.Turnover by medical technology segment in the UK 0 200 400 600 800 1,000 1,200 1,400 1,600 Tu rnov er in scope (millions )
Single use technology In vitro diagnostic technology
Orthopaedic Devices
Wound Care and Management
Implantable devices
Professional services, Consultancy Hospital hardware including ambulatory
Surgical Instruments (reusable)
Re-usable diagnostic or analytic equipmentAnaesthetic and respiratory technology
Assistive T echnology
Drug Delivery
Ophthalmic Devices/Equipment Mobility Access
Cardiovascular and vascular devices ICT+ E-health
Medical Imaging/Ultrasound Equipment and Materials Infection Control
Dental and maxillofacial technologyUnclassified (comment required)
Education and T raining
Radiotherapy equipment Neurology
The comparative analysis between 2009 and 2010 is based on 1351 companies for which financial data is available for 2009 and 2010 and shows a 4% increase in turnover. Analysis of the best and worst performing segments by turnover (Figure 3) shows that the implantable devices segment has seen the highest increase (23%), followed by anaesthetic and respiratory technology (11%) and ophthalmic devices (8%). The segments which have seen the largest drops in turnover are wound care and management (14%), surgical instruments (13%) and medical imaging/ultrasound (2%).
Medical Technology Sector
Figure 3.Turnover in Medical Technology: Top and bottom 3 segments
-20.0 -15.0 -10.0 -5.0 -5.0 10.0 15.0 20.0 25.0 Implantable devices A n aesthetic an d respiratory technology Ophthalmi c devices/equipment M edica l imaging/ul tr as o u n d Surgical instruments W ound care an d management
The distribution of employment across all the segments gives a different ordering and this can be seen in Figure 4. As in the 2009 commentary document, professional services employ the largest proportion of individuals with 7,585 employees. In the database, professional services cover a wide range of activities that are part of the extended supply chain and are vital to the efficient operation of the sector. The largest activities within professional services by employment are companies offering regulatory advice, legal
services and the provision of servicing and maintenance representing 7.5%, 7.1% and 3.7% respectively of all employment in the segment.
The other top employment areas within medical technology are single use technology, re-usable diagnostics or analytical equipment and in vitro diagnostic technology. These segments, along with wound care, orthopaedic devices, assistive technology and hospital hardware all have similar numbers of employees ranging between 3500 and 4800 and they form the bulk of employers in the medical technology sector.
Figure 4.Employee numbers by medical technology segment in the UK 0 1000 2000 3000 4000 5000 6000 7000 8000
Professional services, Consultancy Single use technology
Re-usable diagnostic or analytic equipment
In vitro diagnostic technologyWound Care and Management Orthopaedic DevicesAssistive T
echnology
Hospital hardware including ambulatory
ICT+ E-healthDrug DeliveryMobility Access Infection Control
Medical Imaging/Ultrasound Equipment and Materials Cardiovascular and vascular devices
Surgical Instruments (reusable)Ophthalmic Devices/Equipment Dental and maxillofacial technology
Anaesthetic and respiratory technology Unclassified (comment required)
Implantable devices Education and T raining Neurology Radiotherapy equipment Number of Employees
The comparison of the employment numbers in medical technology between 2009 and 2010 is based on 2328 companies (which represent 77% of the total number of medical technology companies within the database) and is shown in Figures 5 and 6. This shows that employment has increased by 3% across the medical technology sector. There are 14 segments in which employment has increased, two segments where it has remained static and six segments where employment has fallen. The segment with the largest employment increase in the past 12 months is ophthalmic devices which has seen an 18% increase in its employment, followed by neurology with 14% and cardiovascular and vascular devices with 13%.
Figure 5.
Medical technology employment: Segments with increased employment
20% 18% 16% 14% 12% 10% 8% 6% 4% 2% 0% phthalmic Devices/Equipmemt Neurology Cardiovascular and V
ascular DevicesMobility Access Radiotherapy Equipment
Implantable DevicesHospital Hardware Wound Care and Management
Single Use T echnology
In Vitro Diagnostic T echnology Professional Services
Infection Control ICT and E-health Education and T
raining
Medical Technology Sector
The segment that has seen the steepest decline in employment figures is drug delivery, which has seen a 7% drop. This is followed by anaesthetic and respiratory technology (6% decrease) and dental and maxillofacial technology (4% decrease).
Comparing the turnover and employment data by segment shows no discernible correlation between the two numbers. There are examples of segments where turnover has increased with employment and examples of a negative correlation. More annual data points would be required to detect emerging trends.
Figure 6.
Medical technology employment: Segments with static or decreased employment
0% -1% -2% -3% -4% -5% -6% -7% -8% Orthopaedic Devices Re-usable diagnostic or anal yt ic equipm en t Me dical Imaging/ Ul trasound A ssistive T echno logy Surgical Instruments Dental and maxillofacial technology A naesthetic and respiratory technology Drug De liver y
The distribution of the number of companies in each segment gives another indication of the sector as a whole and is shown in Figure 7. Once again, as last year the professional services and consultancy segment contains the most companies. Within this segment regulatory advice, legal advice and maintenance companies represent the largest sub-segments. Unsurprisingly given the modest change in the total number of companies
between 2009 and 2010 (3% decreases see Figure 8) the order of segments by the number
Figure 7.
Company numbers by medical technology segment in the UK 500 450 400 350 300 250 200 150 100 50 0 Number of Companies
Professional services, Consultancy Assistive T
echnology
Single use technology n.e.c.
Re-usable diagnostic or analytic equipment n.e.c. In vitro diagnostic technology Hospital hardware including ambulatory
Mobility Access Orthopaedic Devices
ICT + E-health
Wound Care and Management Infection Control
Dental and maxillofacial technologySurgical Instruments (reusable) n.e.c. Drug Delivery
Medical Imaging/Ultrasound Equipment and Materials Anaesthetic and respiratory technology
Ophthalmic Devices/EquipmentUnclassified [comment required] Cardiovascular and vascular devices
Implantable devices n.e.c.Education and T raining
Radiotherapy equipment Neurology
The total number of companies involved in medical technology has dropped 3% between 2009 and 2010. This overall number does mask the creation of 10 new companies, a figure that is lower than the average of 28 per year up to 2009 highlighted in a recent report25. No individual segment has increased in overall company numbers in 2010 while a number have shown a small decrease over the same time frame. Figure 8 shows the three highest and three lowest performing segments in this regard between 2009 and 2010. Companies providing reusable surgical equipment, infection control and neurology have seen the largest overall changes in company numbers with a percentage loss of 6%, 6% and 13% respectively.
Figure 8.
Company number changes by medical technology segment in the UK
0 50 100 150 200 250
Medical Technology Sub-Sector
Number of Companies 2009 2010 2009 2010 11 88 233 105 118 15 11 88 233 99 111 13
Neurology Drug Delivery Single use technology Surgical Instruments (reusable) Infection Control Radiotherapy equipment
Medical Technology Sector
2.4.
Company Size and Activity
The vast majority of companies in the medical technology sector are small to medium size enterprises (SMEs), with less than 250 employees. The overall distribution is shown in Figure 9. In the UK, the data available for 2010 shows that 99% of medical technology companies are SMEs which is consistent with the figure from 2009. Within the sector, 63% are micro-companies (employing less than 10 people), which compares to 67% in 2009. Given that this represents a comparison over 12 months, it is not surprising that this distribution has not changed significantly. In the UK there are 71 medical technology companies that have 100 or more employees. This employee per company distribution is similar to that of all industries in the UK where 99.8% of all companies have less than 250 employees26. However, the medical technology sector does have a relatively lower percentage of micro-companies; 63% compared to 90% for all UK manufacturing27.
Figure 9.
Distribution of medical technology companies by employee bands
0-4 44% 5-9 19% 10-19 12% 20-49 16% 50-99 6% 100-249 2% 250+ 1%
The distribution of total turnover within the sector shows that 92.5% of all medical
technology companies, for whom financial data is available, have a turnover in the range of £100k-£5m. The UK is home to 425 companies in this sector that have an annual turnover of over £5m.
26 Small and Medium Enterprise Statistics for UK and the Regions, BIS: http://stats.bis.gov.uk/ed/sme 27 Small and Medium Enterprise Statistics for UK and the Regions, BIS: http://stats.bis.gov.uk/ed/sme
25% of companies identified, indicated that they are conducting research and development activity. This figure has stayed consistent from 2009. Data collected through the standard methodology included financial information on the research and development expenditure per company. However, on further analysis of these figures, it is clear that in aggregate, they do not give an accurate figure. The accounting definitions and practices for recording R&D expenditure vary for all industries and makes collection of this data for non-listed companies difficult. 44% of all medical technology companies within the UK have active manufacturing activities. Again this figure has stayed consistent from 2009 to 2010.
The age profile of companies within the medical technology sector (as illustrated in Figure 10) shows that the majority of companies are well established, with 56% of all medical technology companies being over 10 years old. Drug delivery (3.5%) and mobility access companies have the greatest proportion of very young companies (less than two years old) while ophthalmic devices (72.5%) and reusable surgical equipment (64.2%) have the greatest proportion of established companies (10 years or more).
Figure 10.
Profile of UK medical technology sector by company age
Less than 2 years 2% 2- 3 Years 8% 4- 9 Years 34% 10 years 56% 2.5.
UK Profile
All parts of the UK have company activity within the medical technology sector. Figure 11 shows a combination of turnover, employees and number of companies within the medical technology sector in the UK. The distribution shows that there is no clear link between the number of companies within a region and the number of employees or turnover. However, a significant proportion of the turnover in scope (20%) within medical technology is generated from companies based in the South East of England despite only having 12% of the total number of companies.
Medical Technology Sector
Figure 11.
Distribution of turnover, employment and companies for the UK medical
technology sector 0 10 20 30 40 50 60 70 80 90 100
Companies Employees Turnover in Scope
Percentage (%)
Northern Ireland Scotland Wales South West South East London East of England West Midlands East Midlands Yorkshire and the
Humber
North West North East
The geographical distribution of company size by turnover is shown in Figure 12. Across the UK, all areas have companies in all size ranges and in all areas between 25% and 45% of companies have turnovers in scope of over £1m a year.
Figure 12.
Distribution of turnover, employment and companies for the UK medical
technology sector 0 10 20 30 40 50 60 70 80 90 100 Percentage (%)
North EastNorth West Yorkshire and Humber
East MidlandsWest MidlandsEast of England London
South EastSouth West Wales
Scotland Northern Ireland
The segmentation methodology enables the identification of activities across the medical technology sector in the UK. Figure 13 shows that the West Midlands contains the most companies, followed by the East Midlands and then the East of England. This is consistent with the 2009 data. Together these three regions account for 42% of the total medical technology companies within the UK. This percentage share has not changed since 2009. Most areas in the UK have companies active in all segments. The West Midlands has the highest number of assistive technology companies and together with the East of England and South East England have a high number of the UK’s in-vitro diagnostic companies.
Figure 13.
Number of medical technology companies per segment
0 100 200 300 400 500 600
West MidladsEast MidlandsEast of EnglandSouth East
Yorkshire and the Humber
North WestSouth West Scotland Wales
North East London Northern Ireland N um be r of C om pa ni es
Education and Training
Professional services, Consultancy ICT+ E-health
Hospital hardware including ambulatory Mobility Access
Assistive Technology Implantable devices n.e.c.
Re-usable diagnostic or analytic equipment n.e.c. Single use technology n.e.c.
Surgical Instruments (reusable) n.e.c. Infection Control
Drug Delivery
Dental and maxillofacial technology Ophthalmic Devices/Equipment Neurology
Cardiovascular and vascular devices Orthopaedic Devices
Anaesthetic and respiratory technology
Medical Imaging/Ultrasound Equipment and Materials Radiotherapy equipment
In vitro diagnostic technology Wound Care and Management
Medical Technology Sector
The employment pattern across these companies (detailed in Figure 14) shows that the highest employment numbers in the medical technology sector are in the South East of England, followed by the West Midlands and the East of England. Companies in the South East employ 13% of the UK wide medical technology workforce, the top three regions account for 39% of the total employment in this sector.
Figure 14.
Total number of employees in medical technology companies per segment
0 1000 2000 3000 4000 5000 6000 7000 8000 South East
West MidlandsEast of EnglandEast Midlands
Yorkshire and the Humber
South WestNorth West
Wales Scotland
Northern Ireland
North East London
N um be r of E m p lo yees
Education and Training
Professional services, Consultancy ICT+ E-health
Hospital hardware including ambulatory Mobility Access
Assistive Technology Implantable devices n.e.c.
Re-usable diagnostic or analytic equipment n.e.c. Single use technology n.e.c.
Surgical Instruments (reusable) n.e.c. Infection Control
Drug Delivery
Dental and maxillofacial technology Ophthalmic Devices/Equipment Neurology
Cardiovascular and vascular devices Orthopaedic Devices
Anaesthetic and respiratory technology
Medical Imaging/Ultrasound Equipment and Materials Radiotherapy equipment
In vitro diagnostic technology Wound Care and Management
Mapping the total turnover shows a different ordering. Figure 15 shows that companies based in the South East and East of England have the highest turnovers, representing 35% of the total UK turnover, a distribution that is consistent with 2009.
Figure 15.
Total Turnover per medical technology segment by UK region
0 500 1000 1500 2000 2500 3000 South East
East of EnglandNorth West Yorkshire and Humber
West Midlands
Wales Scotland
South WestEast MidlandsNorth East London
Northern Ireland
Turnover in Scope (millions)
Education and Training
Professional services, Consultancy ICT+ E-health
Hospital hardware including ambulatory M obility Access
Assistive Technology Implantable devices n.e.c.
Re-usable diagnostic or analytic equipment n.e.c. Single use technology n.e.c.
Surgical Instruments (reusable) n.e.c. Infection Control
Drug Delivery
Dental and maxillofacial technology Ophthalmic Devices/Equipment Neurology
Cardiovascular and vascular devices Orthopaedic Devices
Anaesthetic and respiratory technology
Medical Imaging/Ultrasound Equipment and Materials Radiotherapy equipment
In vitro diagnostic technology Wound Care and Management
2.6.
Medical Technology Pipeline and Sector Investment
The medical technology industry is characterised by a high rate of product innovation and short life-cycles for some segments. One measure of the health of the UK industry is to look at the number of devices from UK-headquartered companies that have been approved for marketing in the world’s largest medical technology market, the USA.
Medical Technology Sector
The BioPharm Insight28 database shows that for UK companies, forty-four devices received approval between January and October 2010 (Figure 16). This is consistent with numbers in the same period in 2009. Between 2009 and October 2010 there have been a total of 105 devices approved. Between 2004 and 2008 the numbers of approvals were consistently around 80-100 per annum. The trend since 2008 is for approvals per annum to decrease, and a pro-rating of the year-to-date 2010 data is consistent with this trend.
Figure 16.
Number of Medical Devices for UK companies gaining approval in the USA
0 20 40 60 80 100 120 2004 2005 2006 2007 2008 2009 2010 (Jan-Oct) Nu mb er of A ppr o val s
Medical technology has not always attracted the same level of investments as the medical biotechnology sector. In recent years this has been changing with venture funds investing more readily into medical technology companies due to an apparent change in the attitude of investors attracted by the high growth rates, and shorter and less risky approval routes within the sector. However, recent investment trends show that this period of increased investment is slowing. Figures in 2008, from Ernst and Young Global biotechnology report 2010, showed a decrease in venture capital financing of 19.5% and this downward trend has continued into 2009 where there has been a further drop of 17%29. It should be noted that this trend was not consistently seen throughout Europe. In Switzerland an increase in venture funding of 57% was seen in 200930.
2.7 .
Trade
The UK market for medical technology and supplies is estimated to be £5.3bn31. Espicom estimates that the real annual growth over the next five years to be 3.6% in dollar terms32, equal to only 1.6% in terms of local currency. This will take the overall market to just under £6.3bn by 2015.
In local currency terms, UK exports of medical technology generally performed well in 2009, although this translated to sharp falls when viewed in Euros or US dollars33. Performance since the end of 2009 has markedly improved however, with exports for the first two months of 2010 up 23.4% in US$ terms34. The trend has been sharply downward since the latter part of 2008, especially when viewed in Euros or US$. This has continued in 2009 -2010, with imports falling from just under £5bn to £3.4bn35.
28 BioPharm Insight 2010
29 Ernst and Young Global biotechnology report 2010 30 Ernst and Young Global biotechnology report 2010 31 Med Tech Storyboard, Espicom 2010
32 Med Tech Storyboard, Espicom 2010 33 Med Tech Storyboard, Espicom 2010 34 Med Tech Storyboard, Espicom 2010 35 Med Tech Storyboard, Espicom 2010
2.8.
Geographical Distribution of Medical Technology Companies:
Medical Technology Sector
UK medical technology industry – profile
•
A total of 3,034 companies with a combined in-scope turnover of
£13.1bn. This is a 4% rise in turnover from last year.
•
Total number of employees is 55,625. This is a 3% rise from last year.
•
25% of companies investing in R&D.
•
44% of companies are involved in manufacturing.
•
99% of companies have less than 250 employees.
•
93% have turnovers in the range of £100k to £5m per annum.
•
The UK is home to 425 companies with turnovers in excess of £5m
per annum.
•
56% of all companies are over 10 years old.
•
Exports for the first two months of 2010 up 23.4%.
Top three segments in the sector
Turnover Employment No. of Companies
Single Use Technology Professional services Professional services
In-vitro diagnostics Single use technology Assistive technology
Medical Biotechnology Sector
3.1
Sector Definition
This sector includes companies:
•
with an involvement in the discovery, development or manufacturing of biopharmaceuticals;•
that offer specialised, sector specific services to biopharmaceutical companies such as regulatory or legal advice, contract manufacturing or research services;•
SMEs involved in the discovery and development of chemical “Small Molecules.” The activities of large pharmaceutical companies in the development and manufacture of small molecules are excluded from the scope. However, the divisions of large (non-SME) pharmaceutical companies that develop or manufacture medical biotechnology products are included where data on these is available and separately identifiable.The medical biotechnology sector in the database has been divided into seven segments based on the products or services they develop or offer (see Appendix III). The database allows companies to be classified as being active in more than one of these segments. In the analysis presented here, companies have been analysed by their primary activity from which the majority of turnover and employment is derived.
There are six product segments and a specialist service segment. The six former segments are classified according to the technology employed rather than the condition treated, for example companies that develop, manufacture or sell medicines based on antibodies and small molecules. Companies have also been classified according to the traditional therapeutic categories, although the majority of the analysis presented is based on technology employed.
3.2.
Sector Overview
In 2010 the UK medical biotechnology sector contains 942 companies with a combined turnover of £5.5bn employing 36,700 people. This includes 345 or 37% of the sector
companies that have at least one major activity in the development, manufacturing or selling of therapeutic products. There are also 40 companies (4% of the total) where there was not sufficient publicly available information to allocate them to a level one classification. For these companies involved in therapeutics, 50% use small molecule technology, with the remainder using technologies based on biological material, such as antibodies or
proteins. 63% of all companies are specialist service providers such as consultants, material and equipment suppliers and drug development services. This structure of the medical biotechnology sector in the UK indicates a well developed supply chain with a significant number of companies able to outsource non-core activities.
Medical Biotechnology Sector
The turnover comparison for the total UK medical biotechnology sector shows an increase of 18% between 2009 and 2010, while the sector employment numbers show a 3% increase over the same period. The number of companies in the total sector has fallen by 4% from 2009 to 2010.
The UK medical biotechnology sector is involved in a wide range of therapeutic areas.
However over 50% of all companies are focused on the design of therapies and technologies for central nervous system disorders or oncology.
Medical Biotechnology companies are spread right across the UK although there is a degree of concentration with over half of the total turnover being located in the South East and the East of England.
3.3.
Turnover, Employment and Segmentation
The distribution of the £5.5bn turnover for the medical biotechnology sector by individual segment is shown in Figure 17. There are 168 companies in the sector using small molecule technology which is similar to the proportion of those using technology based on biological material (antibodies, therapeutic proteins, advanced therapy medicinal products, gene & cell therapies, vaccines, and blood and tissue products). The largest segment in terms of turnover is the specialist services segment which consists of companies providing regulatory advice, general consultancy and specialist analytical services. For companies involved in developing, manufacturing or marketing final products, the largest segment in terms of turnover is small molecules at £1.6bn. All other segments that are involved in using biological based technologies have a combined turnover of £1bn.
Figure 17.
Turnover in UK Medical Biotechnology Companies by Segment
0 500 1,000 1,500 2,000 2,500 3,000
Specialist Services Small Molecules Antibodies Therapeutic
Proteins Medicinal ProductsAdvanced Therapy
(ATMPs)
Vaccines Blood & Tissue
Products
Companies that use small molecule technology employ 7,668 people representing 21% of the sector employment. The pattern of employment by segments in 2010 is the same as 2009, with the majority of employees in the sector working for specialist service
providers. This division of employment allows companies developing therapeutic products to concentrate resources on the core activities of research, development and marketing while outsourcing non-core activities to specialists.
Figure 18.
Employees in UK Medical Biotechnology Companies by Segment
0 2,000 4,000 6,000 8,000 10,000 12,000 14,000 16,000 18,000
Specialist Services Small Molecules Antibodies Therapeutic
Proteins Vaccines Medicinal ProductsAdvanced Therapy
(ATMPs)
Blood & Tissue Products
Number of Employees
The structure of the medical biotechnology sector is further reflected in the number of companies per segment shown in Figure 19. Specialist suppliers dominate with 557 companies, which is 59% of all companies in the sector. Also shown in Figure 19 is the change in companies per segment between 2009 and 2010, which shows an overall fall of 4%. All segments with the exception of vaccines show a reduction in the number of companies, from a mixture of merger, acquisition or companies that have ceased trading.
Medical Biotechnology Sector
Figure 19.Number of UK Medical Biotechnology Companies by Segment
0 50 100 150 200 250 300 350 400 450 500 550 600 Specialist Services/Suppliers
Small Molecules Therapeutic Proteins
Advanced therapy Medicinal Products
(ATMPs)
Antibodies Vaccines Blood & Tissue Products
Segment
Number of Companies
2009 2010
Figure 20 shows the percentage changes from 2009 to 2010 by segment. Although blood and tissue products shows the greatest fall, this only represents an actual fall of two
companies, while there has been a reduction of 13 companies in both specialist services and small molecules. The number of advanced therapy medicinal products (ATMP’s) companies fell from 48 to 44.
Figure 20.Change in UK Medical Biotechnology Company Numbers by Segment
-16 -14 -12 -10 -8 -6 -4 -2 0
Blood & Tissue
Products ATMPs Small Molecules Antibodies TherapeuticProteins Services/SuppliersSpecialist Vaccines Segment
Although the sector has shown a 4% fall in company numbers from 2009 to 2010, sector
turnover and employment trends are up 18% and 3% respectively. Figure 21 shows turnover
and employment trends by segment. The data for turnover is based on 363 companies for which data is available for 2009 and 2010. Specialist suppliers, small molecules and therapeutic proteins all show a significant increase in turnover but without a corresponding increase in employment. Antibodies companies and vaccine companies show increases in employment without a significant change in turnover. ATMP companies show an increase in employment but a decrease in turnover.
Figure 21.
Changes to the UK Medical Biotechnology Company Turnover and
Employment by Segment -15 -10 -5 0 5 10 15 20 25 30 Specialist
Services/Suppliers Small Molecules
Therapeutic
Proteins Unclassified
Blood &
Tissue Products
Antibodies Vaccines (ATMPs)
Segment
Percentage change (2009 to 2010)
Turnover Employment
The specialist service segment is the largest in the sector based on all measures and therefore of significant economic importance. Figure 22 gives a breakdown of the services being offered by these companies. Specialist consultants are the largest sub-segment with 371 companies offering a whole range of services including intellectual property advice, drug development expertise and Good Manufacturing Practice consultancy. Specialist suppliers are the second largest sub-segment with 314 companies offering a range of equipment, consumables and contract services. Although the remaining three sub-segments are smaller they are still significant in absolute numbers of companies and provide a range of high technology analytical services.
Medical Biotechnology Sector
Figure 22.
Distribution of UK Medical Biotechnology Specialist Services
Companies by Sub-Segment 0 50 100 150 200 250 300 350 400 Specialist Consultants Specialist Suppliers
Proteomics Bioinformatics Genomics
Type of Specialist Service
Number of Companies
3.4.
Company Size and Activity
The UK medical biotechnology sector is dominated by SMEs with 97% of the companies having less than 250 employees. Figure 23 shows the sector has almost half its companies with less than five employees and 71% with fewer than 20. However, 165 companies have a turnover of £5m or greater and 29 companies have 250 employees or more.
Figure 23.Distribution of UK Medical Biotechnology Companies by Employees
0-4 49% 5-9 13% 10-19 10% 20-49 12% 50-99 6% 100-249 7% 250+ 3%
Figure 24 shows the age range of medical biotechnology companies, this shows a healthy mix of young and older companies. 42% of companies are over 10 years old indicating the UK has a sustainable medical biotechnology industry sector. Further analysis of company age by segments shows that the segments showing significantly different age profiles to the average are ATMP companies which are younger and vaccines companies which are older than the average for the sector.
Figure 24.Distribution of UK Medical Biotechnology Companies by Age
Less than 2 years 2% 2- 3 Years 12% 4-9 Years 45% 10 years 41%
Figure 25 shows, for those companies where information is available, the main therapeutic category they are targeting. Central nervous system and oncology medicines are the top two therapeutic categories with over 90 companies together representing 52% of the total. Other common indications being addressed are infections and the immune system. Most of the other Therapeutic Areas are being addressed by between 20 and 30 companies.
Figure 25. Distribution of UK Medical Biotechnology Companies by Therapeutic Area
0 10 20 30 40 50 60 70 80 90 100 Eye OncologyInfections Immune System
Respiratory SystemReproductive Health
Skin
Nutrition and BloodEndocrine SystemMusculoskeletal
Anaesthesia
Medical Biotechnology Sector
3.5.
UK Profile
Figures 26, 27 & 28 shows the distribution of medical biotechnology economic activity across the UK expressed by the location of the number of companies, turnover and
employment by segment. The East of England has approximately a quarter of all economic activity with 27% of total turnover, 24% of the employees and 24% of the total number of companies in the sector. The East of England combined with the South East dominates the medical biotechnology sector in the UK with 53% of the total turnover, 45% of total employees and 38% of the total companies. The data suggests that the cluster in these two regions is more mature, especially in the South East. This latter area has 14% of the total number of companies and 26% of the total turnover, indicating a number of larger companies within the cluster.
Figure 26.Number of Companies in the UK Medical Biotechnology Sector by Segment
0 50 100 150 200 250 East of En glan d Sout h Ea st Scot land North West London Yorks hire an d th e Hu mber North East Wales West Midl ands East Midla nds Sout h W est North ern Ire land Region N um be r o f C om pa ni es
Specialist Services Blood & Tissue Products Small Molecules Vaccines Advanced Therapy Medicinal
Products (ATMPs) Therapeutic Proteins Antibodies
Scotland and the West Midlands are the only regions to register a slight increase in company numbers between 2009 and 2010. A third of the companies in London and the South East are primarily concerned with biopharmaceuticals, a higher proportion than other regions.
Figure 27.Employees in the UK Medical Biotechnology Sector by Segment 0 1000 2000 3000 4000 5000 6000 7000 8000 9000 South East East of England North West Scotland
Yorkshire and the Humber
London North East Wales Northern Ireland West Midlands Region Number of Employees
Specialist Services Blood & Tissue Products Small Molecules Vaccines Advanced Therapy
Medicinal Products (ATMPs)
Therapeutic Proteins Antibodies
All areas of the UK where there is significant medical biotechnology sector activity have large numbers of companies in the specialist services segment. This is the normal structure of biotechnology clusters. The structure in Scotland is unusual in that it is dominated by the specialist services segment as shown in Figure 28. This due to the large number of contract research organisations (CROs) and bio-analytical testing companies in Scotland.
Medical Biotechnology Sector
Figure 28.Turnover in the UK Medical Biotechnology Sector by Segment
1,200 1,000 800 600 400 200 0 1,400 1,600
Turnover in Scope (£ millions)
East of England
South East Scotland LondonNorth West Yorkshire & Humber
North East
Wales
Northern IrelandWest Midlands South West
East Midlands
Blood & Tissue
Products Vaccines Advanced Therapy MedicinalProducts (ATMPs) Therapeutic Proteins Antibodies Small Molecules Specialist Services
3.6
Medical Biotechnology Pipeline
The health of the medical biotechnology sector is often measured by the pipeline of products in development, particularly those that are in human trials. The 2010 report by Ernst and Young36 detailed that the total number of drugs in clinical development in Europe showed a 16% growth which is similar to the growth witnessed over the last few years. The UK continued to take the lead, accounting for 20% of the total products in clinical development in Europe37.
The BioPharm Insight38 database, cross referenced with companies in the database, produced a snap-shot of the pipeline which is shown in Figure 29. The total number of products in development is 465, the majority of which are small molecule drugs. This is similar to the analysis undertaken in 2009. The total number of antibody, protein, vaccines and advanced therapies products (gene therapy, cell therapies etc.) in development is 182. These segments represent products developed using the most advanced of the biotechnologies.
36 Ernst and Young, Beyond Boarders, Global biotechnology report 2010 37 Ernst and Young, Beyond Boarders, Global biotechnology report 2010 38 BioPharm Insight, 2010
Figure 29.UK Medical Biotechnology Pipeline 0 50 100 150 200 250 300 Disc over y/Pre clinic al IND Filed /Pha se 1 Phas e 2 Phas e 3 Regu lator y Filin g N um be r of Th er ape ut ic P rod uc ts
Specialist Services Blood and Tissue Products Small Molecules Vaccines
Advanced Therapy Medicinal Products
Therapeutic Proteins Antibodies
3.7
Sector Investment
The investment community has historically seen biotechnology as having high potential to generate significant return on investment. In 2009 the total investment into all European biotechnology sectors, of which medical is the largest, from all the financing sources reached €2.8bn39. The UK had the largest number of individual financings in Europe and was second only to Switzerland in the total amount of venture capital raised40.
39 Ernst and Young, Beyond Boarders, Global biotechnology report 2010 40 Ernst and Young, Beyond Boarders, Global biotechnology report 2010
Medical Biotechnology Sector