CHAPTER 4: NET WORTH, ASSETS AND
LIABILITIES
♦ A strong balance sheet with low levels of debt ensures the continued provision of core government services during periods of volatility in revenue and investment returns.
♦ New South Wales State sector net worth is forecast to increase by $36 billion, between 1999 and 2007, to $115 billion.
♦ General government equity in the public trading enterprises sector has increased by $7.8 billion between 1999 and 2003 demonstrating that investment in the sector has created value.
♦ General government net debt will continue to decline to around $4 billion as at 30 June 2003. By 2007 net debt is forecast to be about $2.4 billion, 0.7 percent of gross state product.
♦ Interest expenses on borrowings will reduce from $1,362 million in 1999 to $712 million in 2007.
♦ HIH compulsory third party motor vehicle and home warranty insurance claims, assumed by the New South Wales Government, will be fully met. Over $150 million will be paid out to former policyholders during 2003. Outstanding liabilities will be reduced to $85 million by 2007.
♦ Unfunded superannuation has been adversely impacted by the decline in world stock markets and longer life expectancy of pension scheme members, which will result in an approximate $1.8 billion increase in liabilities to $13.2 billion at 30 June 2003. Benefits will be fully funded by 2030, fifteen years earlier than anticipated when the funding plan was introduced in 1993.
♦ General government net financial liabilities are forecast to decline by $3 billion between 1999 and 2007, to $25 billion, primarily reflecting the reduction in net debt.
♦ State net financial liabilities are expected to increase by $8 billion during the same period, to $49 billion.
♦ Government business assets are expected to grow, between 1999 and 2007, by about $28 billion.
♦ The value of taxpayers investment in government businesses will increase by $8.9 billion, in the next four years, largely as a result of these new infrastructure investments.
♦ Net financial liabilities as a percentage of gross state product have reduced substantially with the state sector expected to decline from 26.7 percent in 1995
Some definitions
♦ The total state sector consists of government businesses and the general government sector. Except where otherwise stated, this chapter deals with the
general government sector.
♦ Government businesses are public trading or financial enterprises.
♦ Net worth is the net value of financial assets, including the value of owning government businesses, plus land and physical assets less total liabilities.
♦ Liabilities are existing obligations to make payments in the future.
♦ Financial assets are cash, advances (loans made) and investments, excluding the value of owning government businesses.
♦ The difference in value between liabilities and financial assets is net financial liabilities.
♦ Net debt is the difference in value between borrowings (loans received) and all financial assets outside superannuation funds.
♦ Unfunded superannuation is the difference in value between existing obligations to pay benefits and the financial assets in superannuation funds.
♦ Insurance liabilities are existing obligations to pay claims already incurred.
4.1 INTRODUCTION
Total State sector net worth will grow from $78,740 million in 1999 to a projected $100,423 million at 30 June 2003. Net worth is forecast to increase to $114,854 million by 30 June 2007. Table 4.1 details asset and liability holdings over this eight year period. The table shows a continuous rise in total assets amounting to $57,108 million offset by a more moderate increase in total liabilities of $20,994 million over the period.
The increase in total assets reflects the Government’s ongoing investment in the infrastructure of the State with land and fixed assets increasing by $43,356 million, well in excess of depreciation and disposal of surplus assets. The increase in liabilities over the period is more than accounted for by increased superannuation and employee entitlements.
Land and fixed assets consist of investment in hospitals, schools, roads, bridges, public transport, public housing, sporting facilities, as well as the State’s electricity, water and ports infrastructure provided by the commercial authorities.
Table 4.1: New South Wales State Sector Net Worth Revised Budget 1999 $m 2000 $m 2001 $m 2002 $m 2003 $m 2004 $m 2005 $m 2006 $m 2007 $m GFS BALANCE SHEET Assets Financial Assets
Cash and Deposits 2,496 1,780 1,915 3,119 2,274 1,971 1,887 1,763 1,744 Advances paid 249 315 286 368 422 382 359 366 386 Investments, Loans and Placements 7,598 7,089 6,955 9,680 11,723 13,004 14,722 17,162 20,114 Other Non-Equity Assets 4,320 4,766 4,911 4,737 4,355 4,516 4,620 4,679 4,677 Equity Assets 149 184 160 559 530 541 559 582 588
Total Financial Assets 14,812 14,134 14,227 18,463 19,304 20,415 22,147 24,552 27,509 Non-Financial Assets
Land and Fixed Assets 118,997 123,597 128,030 136,537 142,011 145,850 149,980 158,912 162,353 Other Non-Financial Assets 727 1,053 1,151 1,198 1,298 1,427 1,583 1,636 1,782
Total Non-Financial Assets 119,724 124,650 129,181 137,735 143,309 147,277 151,563 160,548 164,135
TOTAL ASSETS 134,536 138,784 143,408 156,198 162,613 167,692 173,710 185,100 191,644 Liabilities Deposits Held 1,016 944 753 2,445 2,214 2,198 2,181 2,178 2,176 Advances Received 2,270 2,142 2,041 1,826 1,788 1,694 1,652 1,510 1,437 Borrowing 28,979 26,212 25,240 25,000 25,093 26,494 27,956 29,233 30,642 Superannuation 8,179 5,284 7,977 11,723 15,706 17,468 19,318 21,263 23,317 9,934 10,150 11,234 12,053 12,551 12,878 13,343 13,922 14,554 Other Non-Equity Liabilities 5,418 6,215 4,662 4,721 4,838 4,572 4,495 4,664 4,664
TOTAL LIABILITIES 55,796 50,947 51,907 57,768 62,190 65,305 68,946 72,770 76,790
GFS NET WORTH 78,740 87,837 91,501 98,430 100,423 102,387 104,765 112,330 114,854 Estimates
Other Employee Entitlements and Provisions
As at 30 June
Actual
Chart 4.1 shows that on a per capita basis the net worth of NSW citizens will increase by approximately 35 per cent between 1999 and 2007.
Chart 4.1: State Sector Net Worth as at 30 June ($ per person) 10,000 12,000 14,000 16,000 18,000 1999 2000 2001 2002 2003 2004 2005 2006 2007 $ per person
The State sector’s modest increase in borrowings of $1,663 million between 1999 and 2007 will be the result of government businesses borrowing to fund improved infrastructure (refer section 4.2), offset by debt repayments for the general government sector. Debt in the general government sector continues to decline in accordance with the Government’s objective to eliminate general government net debt by 2020. The ongoing debt reductions are a result of seven cash budget surpluses, business asset sales and the regearing of the electricity industry.
The Government is also committed to its other liability management fiscal strategy objectives (refer Chapter 1) of fully funding general government superannuation liabilities by 2030 and fully funding the Treasury Managed Fund self insurance scheme by 2003.
World stockmarket declines and changed actuarial assumptions for life expectancy of scheme members have increased unfunded superannuation in 2003. The gross liability will continue to increase to about 2013 and then steadily decline as current active members retire and as mortality rates increase.
Lower than expected investment returns and recognition of claims incurred but not reported have also adversely impacted the Treasury Managed Fund self insurance scheme. The Government will provide $824 million additional capital in June 2003 to ensure full cash funding of claims is maintained.
4.2 GENERAL GOVERNMENT NET WORTH AND THE
PTE SECTOR
Government businesses play a significant role in providing the State with vital energy, transport, ports and water infrastructure. The quality of this infrastructure makes an important contribution to the efficiency of the State’s economy and the living standards of the community.
Over the last decade the Government has implemented reforms in the PTE sector aimed at replicating the disciplines and incentives that lead private sector businesses towards efficient commercial practice. The operating and investment decisions of the PTE sector are now made on the basis of a rigorous commercial policy framework.
The commercial nature of the PTE sector is an important consideration in an evaluation of the financial performance of the total State sector. In the general government sector, the Government has reduced debt and established sustainable funding levels to meet other liabilities. Similar debt targets in the PTE sector would inhibit its ability to respond to commercial opportunities and undertake appropriate investments.
The PTE sector typically is profitable. In the six years to 2002-03, the PTE operating surplus averaged nearly $500 million and is projected to remain in a healthy positive position for the foreseeable future. In the past, the sector has generated a large cash surplus from its operating activities which has generally been sufficient to cover capital expenditure. Over the forward estimates period, capital expenditure will be greater than the cash operating surplus and the shortfall will need to be met by borrowings.
The PTE sector is currently undertaking major capital investments in response to the growing demand for services and the need to maintain modern and efficient infrastructure for the NSW economy. Chart 4.2 shows on a GFS cash basis that the capital expenditure planned by the PTE sector is in real terms close to its highest level over the last four decades. Without these investments the viability of the enterprises, including nearly $1.5 billion a year government businesses provide as a return on the State’s capital (in dividends and tax equivalent payments) would be adversely impacted.
Chart 4.2: PTE New Fixed Capital Expenditure: 1961-62 to 2006-07 Real 2001 dollars -500 1,000 1,500 2,000 2,500 3,000 3,500 4,000 4,500 1961-6 2 1966-6 7 1971-7 2 1976-7 7 1981 -82 1986 -87 1991-9 2 1996-9 7 2001-0 2 2006-0 7 $m
In the next two years, the PTE sector will continue to increase nominal capital expenditure to reach a peak of $4 billion in 2005-06. This is 77 percent higher than the trough in 1997-98. Capital expenditure decisions by PTEs are mainly commercially based and are expected to generate revenues that provide an adequate return, allowing for risk. It is these revenues that support the sector’s debt levels and return on equity.
Electricity, transport and water sectors account for most PTE capital investment (refer Table 4.2). Underlying this investment is revenue growth at an average annual rate of 4.5 percent over the next four years. Revenue growth will ensure that the PTE sector maintains a healthy operating surplus despite the increased interest expenses arising from the need to raise debt to fund higher levels of capital expenditure.
Table 4.2: Gross Fixed Capital Investment by Sector Sector Electricity Distribution 4,330 28% Transport 4,022 26% Water 2,597 17% Other - Electricity Transmission 1,417 9% - Electricity Generation 831 5% - Ports 497 3% - Miscellaneous 1,758 11% Total 15,452 100% 2003-04 to 2006-07 Estimates $m 2003-04 to 2006-07 Share %
The performance of individual PTEs and the sector in aggregate should reflect reasonable commercial outcomes, allowing for the constraints under which a number of PTEs operate. One indicator of commercial performance is the value of taxpayers’ investment in the PTE sector, represented in the financial statements as general government sector equity.
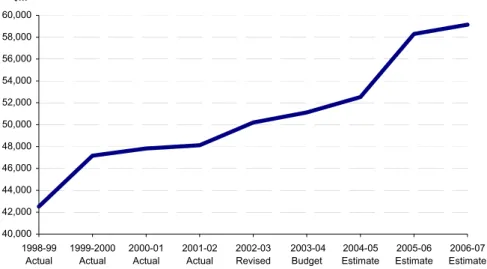
General government sector equity in the PTE sector has increased by over $7.8 billion from 1998-99 to 2002-03, even after a $3.2 billion regearing of electricity entities (refer Chart 4.3). PTE sector equity is expected to continue growing throughout the forward estimates period, with a projected $8.9 billion total increase. Refer to Table 1.3, Chapter 2 for further information.
Government business assets are expected to grow between 1998-99 and 2006-07 by about $28 billion, from $59 billion to $87 billion.
Chart 4.3: General Government Equity in the PTE Sector (a) 40,000 42,000 44,000 46,000 48,000 50,000 52,000 54,000 56,000 58,000 60,000 1998-99 Actual 1999-2000 Actual 2000-01 Actual 2001-02 Actual 2002-03 Revised 2003-04 Budget 2004-05 Estimate 2005-06 Estimate 2006-07 Estimate $m
(a) Includes impact of Sydney Organising Committee for the Olympic Games and Sydney Paralympic Organising Committee The growth in general government equity reflects the value created by the current round of investment in commercially productive operations.
4.3
STATE SECTOR NET FINANCIAL LIABILITIES
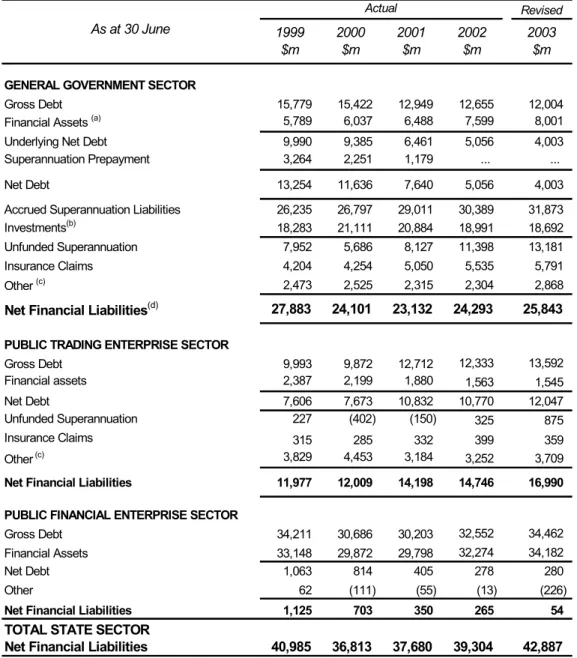
Table 4.3 shows the net financial liabilities of the different sectors.
GENERAL GOVERNMENT SECTOR
Net financial liabilities are forecast to decline by about $3 billion over the eight year period ending 30 June 2007, to around $25 billion. This reduction primarily reflects the ongoing reduction in net debt during the period. In recent years the decline in net debt has been fully offset by unfunded superannuation increases. Further details are provided in Sections 4.6 and 4.7.
Table 4.3: Net Financial Liabilities by Sector Revised 1999 $m 2000 $m 2001 $m 2002 $m 2003 $m
GENERAL GOVERNMENT SECTOR
Gross Debt 15,779 15,422 12,949 12,655 12,004
Financial Assets (a) 5,789 6,037 6,488 7,599 8,001
Underlying Net Debt 9,990 9,385 6,461 5,056 4,003
Superannuation Prepayment 3,264 2,251 1,179 ... ...
Net Debt 13,254 11,636 7,640 5,056 4,003
Accrued Superannuation Liabilities 26,235 26,797 29,011 30,389 31,873
Investments(b) 18,283 21,111 20,884 18,991 18,692
Unfunded Superannuation 7,952 5,686 8,127 11,398 13,181
Insurance Claims 4,204 4,254 5,050 5,535 5,791
Other (c) 2,473 2,525 2,315 2,304 2,868
Net Financial Liabilities(d) 27,883 24,101 23,132 24,293 25,843
PUBLIC TRADING ENTERPRISE SECTOR
Gross Debt 9,993 9,872 12,712 12,333 13,592 Financial assets 2,387 2,199 1,880 1,563 1,545 Net Debt 7,606 7,673 10,832 10,770 12,047 Unfunded Superannuation 227 (402) (150) 325 875 Insurance Claims 315 285 332 399 359 Other (c) 3,829 4,453 3,184 3,252 3,709
Net Financial Liabilities 11,977 12,009 14,198 14,746 16,990 PUBLIC FINANCIAL ENTERPRISE SECTOR
Gross Debt 34,211 30,686 30,203 32,552 34,462
Financial Assets 33,148 29,872 29,798 32,274 34,182
Net Debt 1,063 814 405 278 280
Other 62 (111) (55) (13) (226)
Net Financial Liabilities 1,125 703 350 265 54
TOTAL STATE SECTOR
Net Financial Liabilities 40,985 36,813 37,680 39,304 42,887
As at 30 June
Actual
(a) Gross amount of insurance assets are included in financial assets in accordance with Australian Bureau of Statistics Standards. (b)
Investments include balance of General Government Liability Management Fund, (GGLMF).
(c) Mainly represented by employee entitlements, such as long service leave.
(d) Equity investment in the PTE/PFE sectors is excluded to give a more conservative picture of the general government sector’s
LIABILITY PROJECTIONS
Over the forward estimates period, state sector net financial liabilities will increase in nominal terms but decline as a percentage of gross state product, as shown in Table 4.4 and Chart 4.4 respectively.
Table 4.4: Net Financial Liabilities Forecasts
Actual Revised Budget
As at 30 June 2002 2003 2004 2005 2006 2007 $m $m $m $m $m $m
General Government Sector
Net Debt(a) 5,056 4,003 3,737 3,590 2,909 2,358
Unfunded Superannuation(b)
11,398 13,181 13,983 14,094 13,938 13,514
Insurance Gross Claims(c) 5,535 5,791 5,987 6,268 6,629 7,044
Other(d) 2,304 2,868 2,291 2,111 1,969 1,984
Total 24,293 25,843 25,998 26,063 25,445 24,900
State Sector
Net Debt(a) 16,104 16,329 17,527 18,949 19,747 20,491
Unfunded Superannuation(b) 11,723 14,055 14,970 15,191 15,148 14,838 Insurance Gross Claims(c) 5,989 6,188 6,379 6,659 7,024 7,447
Other(d) 5,488 6,315 6,014 6,000 6,300 6,505
Total 39,304 42,887 44,890 46,799 48,219 49,281
Estimates
(a) Excludes balances held in GGLMF.
(b) GGLMF investments included in superannuation asset balances.
(c) Gross amount of insurance assets are included in financial assets in accordance with Australian Bureau of Statistics Standards. (d) Other employee entitlements and provisions.
Chart 4.4: Net Financial Liabilities as at 30 June (% of GSP)
18.4 7.6 15.0 19.9 15.5 14.4 13.2 10.7 9.7 9.7 9.9 9.4 8.9 8.2 26.7 22.0 20.6 16.3 15.9 15.8 16.4 16.2 16.0 25.5 19.4 15.5 0 5 10 15 20 25 30 1995 1996 1997 1998 1999 2000 2001 2002 2003 (est) 2004 (est) 2005 (est) 2006 (est) 2007 (est) %
4.4
GENERAL GOVERNMENT SECTOR INSURANCE
The Treasury Managed Fund (TMF) is a self-insurance scheme owned and underwritten by the Government. The TMF covers workers’ compensation, public liability and other insurance for all budget dependent agencies. Crown cash grants totalling $824 million will fully fund the TMF outstanding claims by 30 June 2003. Future investment earnings (assuming normal investment market conditions prevail) and agency premiums will maintain full funding.The TMF’s overall purpose is to provide a structure and a range of services that assist budget dependent agencies to reduce the impact of risk exposures and hence maximise resources available to support their core businesses. Fund members receive financial incentives to motivate best management practices through “hindsight adjustments” to premiums that are based on the agencies’ experience. The Auditor-General’s September 2001 report to Parliament on the collapse of HIH Insurance noted that agencies not covered by the TMF had incurred an estimated $30 million loss through the HIH collapse. A key recommendation of this report was:
“The current structure of the Treasury Managed Fund should be reviewed to determine whether it is beneficial to include all non-budget dependent agencies under the cover provided.”
Treasury and the fund manager, GIO Australia, are currently conducting this review. Two information sessions for agencies were held in November 2002 and March 2003 to outline the services and insurance coverage provided by TMF membership. A number of small to medium sized non budget dependent organisations have since joined the scheme.
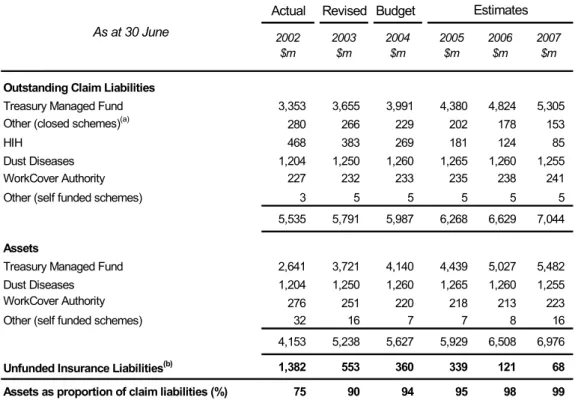
Table 4.5: General Government Sector Insurance Forecasts
Actual Revised Budget 2002 $m 2003 $m 2004 $m 2005 $m 2006 $m 2007 $m
Outstanding Claim Liabilities
Treasury Managed Fund 3,353 3,655 3,991 4,380 4,824 5,305 Other (closed schemes)(a) 280 266 229 202 178 153
HIH 468 383 269 181 124 85
Dust Diseases 1,204 1,250 1,260 1,265 1,260 1,255 WorkCover Authority 227 232 233 235 238 241 Other (self funded schemes) 3 5 5 5 5 5 5,535 5,791 5,987 6,268 6,629 7,044
Assets
Treasury Managed Fund 2,641 3,721 4,140 4,439 5,027 5,482 Dust Diseases 1,204 1,250 1,260 1,265 1,260 1,255 WorkCover Authority 276 251 220 218 213 223 Other (self funded schemes) 32 16 7 7 8 16 4,153 5,238 5,627 5,929 6,508 6,976
Unfunded Insurance Liabilities(b) 1,382 553 360 339 121 68 Assets as proportion of claim liabilities (%) 75 90 94 95 98 99
As at 30 June
Estimates
(a) Closed schemes include the Transport Accident Compensation Fund and the Government Workers Fund whose outstanding claims are funded by the Crown Entity.
(b) Does not include liabilities under the worker’s compensation scheme for private sector employees.
Increased funding of the TMF will eliminate the Scheme’s unfunded outstanding claim liabilities in 2003. The Dust Diseases Board liabilities have increased due to a change in their claims recognition policy to recognise liabilities on a claims incurred basis. This is offset by an equivalent asset receivable which recognises the Board’s legislative power to adjust employer premiums in order to fund future claims.
In order to maintain the community’s confidence in the insurance industry, the Government assumed liability for the outstanding compulsory third party motor vehicle insurance claims under policies in force with HIH prior to 31 December 2000, and for claims under the home warranty insurance scheme in respect of HIH policies entered into prior to 15 March 2001.
HIH claim liabilities assumed by the Government totalled over $600 million. During 2003 claim payments to previous HIH policyholders will exceed $150 million.
The continuing HIH claim payments and the anticipated increase in TMF financial assets will reduce net liabilities over the forward estimates period. Insurance assets as a proportion of liabilities will rise from 75 percent in 2002 to 99 percent by 2007.
HIH ROYAL COMMISSION REPORT
The report by the Honourable Mr Justice Owen into the collapse of the HIH Insurance Group was released on 16 April 2003. The Commissioner has recommended that the Australian Accounting Standards Board amend general insurance accounting standard AASB1023 to provide for the following:
♦ prudential margins for outstanding claims with levels of adequacy of
75 percent;
♦ in estimating the value of liabilities, future cash flows be discounted using a
risk-free rate.
If adopted by the TMF these recommendations would require an increase in asset reserves of approximately $500 million. The TMF generally maintains assets sufficient to meet the actuarial central estimate of liabilities and uses a liability valuation discount rate which reflects the forecast investment returns of the TMF balanced asset portfolio.
The Commissioner’s recommendations are appropriate to ensure the ongoing solvency of the private sector insurance industry. However, it is not necessary for a sovereign government such as New South Wales with a AAA credit rating and stable cash flows to provide additional funding to the TMF for contingency reserves. These resources are better utilised to support core government services.
4.5
PUBLIC LIABILITY AND OTHER INSURANCE
ISSUES
The collapse of HIH Insurance Group and the tragic events of 11 September 2001 reduced the availability of insurance cover on the local and international market. The insurance market cycle was already entering a period of premium increases following a number of years of poor financial results.
As a result community and small business groups have faced difficulties in obtaining public liability and professional indemnity insurance cover at affordable
The NSW Government has acted to mitigate these impacts in New South Wales through tort law reform, arrangements for bulk-buying of public liability insurance and by working with the insurance industry to stabilise premiums and increase insurance availability.
New South Wales has led public liability reforms in Australia. Other states are now adopting many of these initiatives as all governments accept that these measures will assist to restore the insurance market.
The NSW Parliament passed the Civil Liability Act 2002 to implement Stage One
of the Government’s law reform program. Key features of Stage One included:
♦ upper limits for non-economic loss and lost earnings;
♦ application of a claim threshold of 15 percent in respect of general damages;
♦ new interest calculations and discount rates for damages awards;
♦ limit on legal costs in small claims; and
♦ penalties for making unmeritorious claims.
Stage Two of the Government’s legislative program, the Civil Liability
Amendment (Personal Responsibility) Act 2002 has also been passed by
Parliament. This legislation includes measures to:
♦ limit the scope of reasonable foreseeability;
♦ introduce a new defence for professionals sued for negligence;
♦ introduce proportionate liability for certain claims; ♦ limit liability in tort of a public or other authority;
♦ protect good Samaritans and volunteers from liability for their acts; and
♦ facilitate structured settlements in personal injury cases.
The insurance industry has responded to these initiatives with the establishment of Community Care Underwriting Agency (CCUA). CCUA is a specialist agency of leading insurers Allianz Australia, IAG and QBE Insurance (Australia) Limited, offering public liability insurance to not for profit organisations.
Another insurer, Suncorp GIO, has announced that it will make public liability insurance available to a much broader range of businesses, consumers and community groups.
However, the Government has been concerned that the insurance industry passes on the savings generated through these reforms. The NSW Government has called on the Commonwealth for greater transparency in the insurance industry and for stringent monitoring by both the Australian Prudential Regulatory Authority and the Australian Competition and Consumer Commission.
Following a series of Ministerial meetings on insurance issues attended by Commonwealth, State and Territory Ministers, all Australian jurisdictions agreed to a landmark package of negligence law reforms.
These meetings also focused on the difficulties faced by professionals in obtaining professional indemnity insurance at a reasonable price. Ministers agreed to work urgently towards developing a nationally consistent model for proportionate liability for economic loss. The changes would mean that defendants would each be liable only to the extent that they have contributed to a plaintiff’s economic loss.
The collapse of HIH Insurance severely dislocated the home warranty insurance market. HIH’s share of this market was approximately 30 percent. Following the World Trade Centre terrorist attack the home warranty market was again in turmoil with the withdrawal from the market of another provider, Dexta, and certain reinsurers.
The NSW and Victorian Governments have implemented revised reinsurance arrangements that have allowed the existing two insurers to continue in the market. The Government has announced an inquiry into home warranty insurance, to be chaired by Mr Richard Grellman. He will investigate the adequacy of the existing scheme, as well as other industry based models. The inquiry’s final report is due by 30 September 2003.
4.6
GENERAL GOVERNMENT SECTOR NET DEBT
The Government has a strong commitment to responsible financial management,
consistent with the goals of the General Government Debt Elimination Act 1995.
Cash surpluses, asset sales and capital repatriations have reduced general government net debt to a sustainable level, and will see net debt eliminated by 2020.
Table 4.6: General Government Sector Net Debt Revised Budget 1999 $m 2000 $m 2001 $m 2002 $m 2003 $m 2004 $m 2005 $m 2006 $m 2007 $m Gross Debt Borrowings(a) 13,450 13,190 10,847 10,765 10,149 10,236 10,187 9,823 9,696 Advances Received 2,270 2,142 2,041 1,826 1,788 1,694 1,652 1,510 1,437 Deposits Held 59 90 61 64 67 67 67 67 67 15,779 15,422 12,949 12,655 12,004 11,997 11,906 11,400 11,200 Financial Assets(b) Cash 1015 481 1,096 1719 1,112 908 962 758 688 Investments 3,118 3,860 3,950 4,359 5,383 5,913 5,964 6,370 6,804 Advances 1,656 1,696 1,442 1,521 1,506 1,439 1,390 1,363 1,350 5,789 6,037 6,488 7,599 8,001 8,260 8,316 8,491 8,842 Net Debt 9,990 9,385 6,461 5,056 4,003 3,737 3,590 2,909 2,358 Underlying Actuals As at 30 June Estimates
(a) Excludes borrowings for accelerated superannuation contributions in 1998-99.
(b) Includes financial assets which have been allocated to fund insurance claims, but excludes balances held in the GGLMF.
Table 4.7 shows the composition of the $8,151 million reduction in general government net debt from 1995 to 2003. A large part of the reduction in net debt, ($3,368 million) has come from the consistent application of cash surpluses. Public trading enterprise regearing has also made a significant contribution to the reduction. Asset sale proceeds have assisted, though to a lesser extent.
The net debt to gross state product ratio is forecast to be 0.7 percent by 2007 (Chart 4.5).
Table 4.7: Annual Movement in General Government Underlying Net Debt 1995-96 to 2002-03
Estimate Total since
1995-96 $m 1996-97 $m 1997-98 $m 1998-99 $m 1999-00 $m 2000-01$m 2001-02$m 2002-03$m 1 July 1995 $m Opening Balance 12,154 11,092 11,042 10,403 9,990 9,385 6,461 5,056 12,154
Underlying Cash (Surplus)/Deficit 262 (110) (6) (408) (874) (733) (1,265) (234) (3,368) PTE Regearing (1,491) ... 92 (50) 50 (2,583) ... (710) (4,692) Privatisation proceeds ... ... (937) ... ... ... (669) (122) (1,728) Premium on debt repayment 83 46 121 60 55 309 100 18 792 Assumption of Freightcorp debt ... ... ... ... ... ... 308 ... ... Other 84 14 91 (15) 164 83 121 (5) 845
Closing Balance 11,092 11,042 10,403 9,990 9,385 6,461 5,056 4,003 4,003
Total (Reduction)/Increase (1,062) (50) (639) (413) (605) (2,924) (1,405) (1,053) (8,151)
Actual
Chart 4.5: General Government Sector Underlying Net Debt as percentage of Gross State Product, as at 30 June
7.4 6.3 5.8 5.2 4.7 4.2 2.7 0.7 2.0 1.5 0.9 1.2 1.4 0 1 2 3 4 5 6 7 8 1995 1996 1997 1998 1999 2000 2001 2002 2003 (est) 2004 (est) 2005 (est) 2006 (est) 2007 (est) %
The interest expense on gross debt should fall from $1,362 million to $712 million between 1999 and 2007. The fall in interest expense is due to the ongoing reductions of debt and a lower average interest rate. As old loans in the debt portfolio mature, they are replaced with new loans at lower prevailing interest rates.
In 1999, for every revenue dollar received, 4.7 cents was required to meet loan interest payments. By 2007 it is expected that 1.8 cents in the dollar will be
Chart 4.6: General Government Sector Gross Debt Interest Expense, and as a percentage of Budget Revenue
0 200 400 600 800 1,000 1,200 1,400 1,600 1998-99 1999-2000 2000-01 2001-02 2002-03 (est) 2003-04 (est) 2004-05 (est) 2005-06 (est) 2006-07 (est) cents 0 1 2 3 4 5 $m
interest expense (lhs) cents per revenue dollar (rhs)
4.7
GENERAL GOVERNMENT SECTOR UNFUNDED
SUPERANNUATION
The decline in the world equity markets over the last two years has sharply reduced superannuation fund investment returns with adverse impact on the State’s superannuation funding position.
Some recently identified improvements in pensioner life expectancy and a trend for retiring public servants to prefer a pension rather than a lump sum have exacerbated the increase in unfunded liabilities. These factors have similarly affected most jurisdictions in Australia.
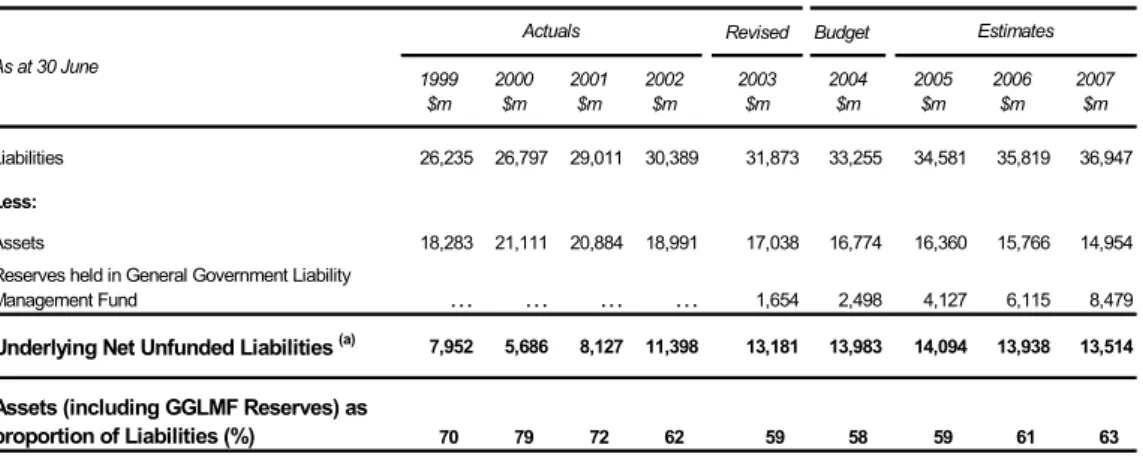
Based on current actuarial estimates, unfunded superannuation liabilities will increase by about $2.1 billion to $13.5 billion, for the five year period ending 30 June 2007 (refer Table 4.8). This increase is largely explained by the combination of several major factors:
♦ the expected continuation of negative Pooled Fund investment returns during
2002-03. The return in 2001-02 was negative 7.3 percent while the return for 2002-03 is currently forecast to be around negative 3 percent compared to the previous budget assumption of positive 7 percent. The expected negative return in 2002-03 will increase 30 June 2003 unfunded liabilities by around $1,400 million.
♦ the 2003 triennial actuarial review of the superannuation schemes has identified that pensioner mortality has steadily improved over the last five years. This is consistent with trends in other jurisdictions in Australia and has increased the cost of total future pension payments. The increase in total unfunded superannuation liabilities, due to past and expected future improvements in mortality, has been actuarially calculated to be about $580 million.
♦ the review has also noted a decrease in the percentage of superannuation
scheme members converting their pensions to lump sums (which are on average less costly to employers), increasing unfunded liabilities by around $204 million.
Table 4.8: General Government Sector Unfunded Superannuation Liabilities (a)
Revised Budget 1999 $m 2000 $m 2001 $m 2002 $m 2003 $m 2004 $m 2005 $m 2006 $m 2007 $m 26,235 26,797 29,011 30,389 31,873 33,255 34,581 35,819 36,947 Less: 18,283 21,111 20,884 18,991 17,038 16,774 16,360 15,766 14,954 … … … … 1,654 2,498 4,127 6,115 8,479 7,952 5,686 8,127 11,398 13,181 13,983 14,094 13,938 13,514 70 79 72 62 59 58 59 61 63 Estimates
Reserves held in General Government Liability Management Fund
Assets (including GGLMF Reserves) as proportion of Liabilities (%)
Actuals As at 30 June
Liabilities
Underlying Net Unfunded Liabilities (a)
Assets
(a) Includes assets and liabilities of both employers and employees. The time series is adjusted to take into account that New South Wales no longer recognises any superannuation liability for Universities. Includes STC Pooled Fund schemes, Parliamentary Contributory Superannuation Scheme and Judges Pension Scheme.
Over the forward estimate period to 30 June 2007 unfunded superannuation is expected to stabilise because assets, including balances in the General Government Liability Management Fund, are projected to increase steadily to around $23 billion by 30 June 2007. Investment returns are forecast to return to the current actuarially assumed long-term average rate of positive 7 percent per annum.
Gross liabilities will continue to grow to 2013, before gradually declining. Liabilities reduce after 2013 due to the retirement of active members. Superannuation will be fully funded in 2030, at which time assets are projected to match liabilities at approximately $24 billion.
Chart 4.7: Projected General Government Superannuation Gross Liabilities, Assets and Net Liabilities
0 10000 20000 30000 40000 50000 199 5 2000 2005 201 0 201 5 2020 2025 203 0 $m
Liabilities Assets Unfunded Liabilities
The cumulative average real rates of return on Australian equities from 1900 to the end of each decade to 2000 is shown in Chart 4.8. The cumulative average real rate of return over the 100 years was 7.5 percent. The lowest cumulative average at the end of any decade was 7.3 percent (1979). International equity returns were also high, with real rates of return in the United States of 6.7 percent, Japan 4.5 percent and United Kingdom 5.8 percent.
If the trend of the last 100 years continues over the next 27 years, an average nominal investment return from 2003 to 2030 of at least 7 percent would be achieved. Actual returns will also be influenced by the superannuation asset portfolio’s strategic asset allocation during the period. The Pooled Fund nominal return for the ten year period ended 31 May 2003 was 7.5 percent compared to the Intech Financial Services survey average manager return of 7.3 percent.
Chart 4.8: 100 Year History of the Australian Equity Market (a) -10 -5 0 5 10 15 20 1909 1919 1929 1939 1949 1959 1969 1979 1989 2000
10- year returns Cumulative average real return
(a) Data for Australian equities are described in Officer’s chapter in Ball, Brown, Finn and Officer 1989 “Share Markets and Portfolio Theory” and updated in a publication by Dimson, Marsh and Staunton (2002) from the London Business School.
SUPERANNUATION FUNDING PLAN
In 1993, the aim was to fully fund superannuation liabilities by 2045. As a result of higher than originally estimated employer contributions, various liability management initiatives and favourable actual investment returns over a number years, the Government brought forward the full funding target date by fifteen years from 2045 to 2030.
The current 2003 unfunded liability estimate of $13,181 million is $1,555 million lower than the original funding plan forecast of $14,736 million despite recent negative investment returns and adverse changes in actuarial demographic assumptions.
The Government is committed to meeting the 2030 target date. Employer contribution levels will be periodically reassessed to ensure they remain sufficient to achieve full funding.
A new non-superannuation investment fund (the General Government Liability Management Fund) has been established to accumulate Crown employer
Contributions to the General Government Liability Management Fund over the forward estimates period have been increased. This results from the allocation of estimated cash surpluses between net debt reduction and greater contributions to the Fund, than required by the previous funding plan, to achieve the key fiscal objectives of eliminating net debt by 2020 and fully funding superannuation liabilities by 2030.
4.8
FINANCIAL RISK MANAGEMENT
The Public Authorities (Financial Arrangements) Act 1987 (PAFA Act) contains
controls to manage risks resulting from financial arrangements of government agencies. This Act regulates government agencies’ powers to borrow, use derivatives, invest, use funds managers and enter into joint ventures or joint financing arrangements. The PAFA Act also provides for government guarantees of financial arrangements entered into under the Act.
Treasury has initiated a review of the risk management policies and procedures of PAFA Act Authorities.
The major financial liabilities of the State are centrally managed.
INSURANCE MANAGEMENT
The Treasury Managed Fund (TMF) provides insurance for all budget dependent agencies and those non-budget dependent agencies that have chosen to join the Fund. It is government policy to self insure those risks that experience shows can be managed by an organisation of its size and to reinsure those risks it cannot. The TMF’s gross liabilities are actuarially assessed quarterly.
In 2002-03 the Government invested a further $824 million to fully fund the TMF. The investments are held by the NSW Treasury Corporation (TCorp) in its TCorp HourGlass facilities or directly in a managed bond portfolio. The TMF portfolio value is approximately $3.7 billion and bonds represent an average of 60 percent of investments. A memorandum of understanding between TCorp and the Treasury details investment policies and procedures and benchmarks for each asset class.
DEBT MANAGEMENT
The debt portfolios of the Crown and the Roads and Traffic Authority together represent 95.8 percent of the debt of budget dependent agencies. These portfolios are managed by TCorp. Debt management has the twin objectives of a) minimising the market value of debt subject to specified risk constraints over the long term and b) minimising the cost of debt.
TCorp uses an active management style with the aim of adding value relative to a benchmark portfolio. This involves positioning the portfolios according to TCorp’s view of future interest rates. Memoranda of understandings between Treasury, the Roads and Traffic Authority and TCorp constrain the management of the portfolios. These include a requirement to adhere to finance expense budget allocations which are agreed at the beginning of each financial year.
SUPERANNUATION MANAGEMENT
Nearly all new public servants now join accumulation schemes which are fully funded and pose no risk to the Government. The SAS Trustee Corporation (STC) is the trustee for all defined benefit schemes covering budget dependent agencies. The STC is required by legislation to arrange a triennial review of all defined benefit schemes under its administration. The current review should be finalised by December 2003. All demographic and economic assumptions used in calculating the gross liabilities are assessed against current experience. Where it is known that these assumptions will change, the new assumptions have been used in the 2003-04 budget calculations.
The Trustee reviews the STC Pool Fund’s strategic asset allocation annually. Currently the amount invested in growth assets is approximately 75 percent with the balance in bonds and cash.
The Crown contribution to defined benefit superannuation schemes for 2002-03 is being invested through the General Government Liability Management Fund. These funds are currently being held as cash pending a long term investment decision.
4.9 FINANCIAL
ASSET
MANGEMENT
THE ROLE OF ASSETS IN FINANCIAL MANAGEMENT
Government determines the level of financial assets to be invested from the funding plans constructed to achieve the targets set for fully funding its liabilities. These policy targets are 2003 for the Treasury Managed Insurance Fund, 2020 for general government debt and 2030 for superannuation.
With a credit rating of AAA, there is no need for the Government to hold additional prudential reserves. Maintaining a strong balance sheet allows the Government to better deal with volatility of taxation revenues and investment markets without impacting the level of core government service provision.
Treasury commissioned InTech Financial Services to review the management of financial risks inherent in holding assets. The review endorsed the current policy approach of fully funding liabilities or constructing a funding plan to fund liabilities within a reasonable timeframe.
Investment income is expected to return to be a growing proportion of total budget revenues.
Table 4.9: Investment Income as Proportion of Total Budget Revenue Revised Budget 1998-99 1999-2000 2000-01 2001-02 2002-03 2003-04 2004-05 2005-06 2006-07 $m $m $m $m $m $m $m $m $m Investment Income 412 476 471 282 354 637 747 877 1,011 Budget Revenue 28,937 30,533 32,118 33,752 35,198 35,936 37,037 39,127 40,586 Income % of Budget 1.4% 1.6% 1.5% 0.8% 1.0% 1.8% 2.0% 2.2% 2.5% Actual Estimates
The ratio of financial assets to liabilities is expected to improve over the forward estimates period.
Table 4.10: General Government Sector Financial Assets, and Ratio to Liabilities
Actual Revised Budget 2002 $m 2003 $m 2004 $m 2005 $m 2006 $m 2007 $m Superannuation 18,991 17,038 16,774 16,360 15,766 14,954
Liability Management Fund 1,654 2,498 4,127 6,115 8,479
Insurance 4,153 5,238 5,627 5,929 6,508 6,976
Other 3,446 2,763 2,633 2,387 1,983 1,866
Total Financial Assets 26,590 26,693 27,532 28,803 30,372 32,275
Gross Debt (a) 12,655 12,004 11,997 11,906 11,400 11,200
Insurance 5,535 5,791 5,987 6,268 6,629 7,044 Superannuation 30,389 31,873 33,255 34,581 35,819 36,947 Other Liabilities 2,304 2,868 2,291 2,111 1,969 1,984 Total Liabilities 50,883 52,536 53,530 54,866 55,817 57,175 Assets/Liabilities 52% 51% 51% 52% 54% 56% As at 30 June Estimates
All financial assets outside superannuation funds are reported against debt liabilities in accordance with Australian Bureau of Statistics methodology.
ASSETS: RETURNS AND RISKS
The higher the allocation to growth assets (shares and property), the greater is the expected average return and the wider is the expected range of returns.
The average duration of liabilities is the time during which half the future cash payments will be made. For superannuation liabilities, the average duration is about 12 years and for insurance and debt liabilities, about four years.
For liabilities of different duration, assets are invested in different portfolios. During 2002-03, the assets of the General Government Liability Management Fund were held in cash, pending a decision about asset allocation. The strategic asset allocations of the various asset portfolios held in the general government sector are shown in chart 4.9.
Chart 4.9: General Government strategic asset allocations, 2002-03 40% 75% 61% 39% 60% 25% 0 5 10 15 20 25 30
Superannuation GGLMF Insurance Other Total
$ billion
Growth Assets Fixed Interest, Cash and/or receivables
Government requires a long-term average return on investments that at least equals the discount rate used in constructing funding plans for the relevant liabilities. The discount rate is the rate at which future cash payments are discounted back to today’s dollar value.
For superannuation liabilities, the discount rate used in the funding plan is 7 percent per annum. To earn an average investment return of 7 percent per annum requires a moderately high allocation to growth assets (shares and property).
BOND MARKETS
CommonwealthNew South Wales participated in the recent Federal Government review of the Commonwealth Government Securities (CGS) market. The State’s submission supported the maintenance of the CGS market and urged the Commonwealth to consider the allocation of any surplus cash to commence Federal funding of their unfunded superannuation.
It was thus encouraging that the Commonwealth announced that it will ensure that sufficient CGS remain on issue to maintain a viable market and will consider funding superannuation if their level of financial assets exceed short term liquidity needs.
New South Wales
The reduction in general government net debt is managed while maintaining a viable NSW State government bond market. Chart 4.10 illustrates the profile of benchmark TCorp bonds currently outstanding.
Chart 4.10: Benchmark TCorp Bonds outstanding (May 2003)
0 1 2 3 4 5 7.0% Apr 2004 6.5% May 2006 8.0% Mar 2008 7.0% Dec 2010 6.0% May 2012 $ Billion
4.10 OTHER LIABILITIES
Other liabilities represent employee entitlements and provisions. Employee entitlements are annual leave, vested sick leave, long service leave and superannuation. Superannuation has been discussed in section 4.7. Annual leave 2002-03 liabilities are $1,012 million (2001-02 $915 million). Vested sick leave accumulates in a similar manner to annual leave entitlements. The 2002-03 amount is $150 million (2001-02 $142 million).
Long service leave liabilities primarily represent leave entitlements of employees in budget dependent agencies. The majority of employees take their entitlement at retirement. The liability in 2001-02 was $1,916 million and has increased to $2,250 million in 2002-03. This increase has been primarily due to a change in the method of valuation in accordance with Australian Accounting Standard AASB 1028. The method has changed from the nominal method to the present value method.