PUBLIC
SAP HANA Cloud Integration for process integration
2015-05-10
Content
1 Understanding the Basic Concepts. . . . 4
1.1 Runtime in Detail. . . 4
Virtual System Landscapes. . . 7
2 Installing and Configuring the Tool. . . . 8
3 Monitoring (Integration Operations Feature in Eclipse). . . .9
3.1 Launching the Integration Operations Feature. . . .9
3.2 Overview of Integration Operations Perspective. . . .10
3.3 Node Explorer (View). . . .11
3.4 Message Monitoring. . . 12
Message Status. . . .14
3.5 Deployed Artifacts. . . 15
3.6 Data Store Viewer. . . .17
3.7 Properties View. . . 19
Properties View for Nodes. . . 20
Properties View for Messages - Message Processing Log. . . 22
Properties View for Deployed Artifacts. . . 25
3.8 Aggregated Data View. . . .26
3.9 Component Status View. . . .27
Runtime Status. . . 31
Component Monitors. . . .32
Monitoring External Reachability of Tenant Management Nodes. . . 32
Monitoring External Reachability of Runtime Nodes. . . 32
3.10 Tail Log View. . . 33
3.11 Tasks View. . . .34
3.12 Deploying an Artifact. . . 35
Deploying a Keystore. . . .37
Deploying a Known Hosts Artifact. . . .38
Deploying a PGP Public Keyring. . . 38
Deploying a PGP Secret Keyring. . . .39
Deploying an OAuth2 Authentication Artifact. . . .40
Deploying and Editing a User Credentials Artifact. . . 41
3.13 Testing an Outbound Connection. . . .43
SSL Outbound Connection Test. . . 44
SSH Outbound Connection Test. . . .45
4.1 Message Monitor. . . 47
4.2 Integration Content Monitor. . . 50
5 Security Artifact Renewal. . . . 54
5.1 Use Cases. . . .54
5.2 Involved Roles. . . 57
5.3 Security Artifact Renewal for Transport Level Security. . . .57
Security Artifact Renewal for HTTPS-Based Communication. . . .57
Security Artifact Renewal for SFTP-Based Communication. . . .69
5.4 Security Artifact Renewal for Message Encryption/Signature. . . .72
Security Artifact Renewal for PKCS#7/CMS. . . 72
Security Artifact Renewal for OpenPGP. . . .82
Security Artifact Renewal for XML Digital Signature. . . 90
Security Artifact Renewal for WS-Security. . . .93
6 Concepts of Secure Communication. . . .109
6.1 HTTPS-Based Communication. . . .109
Technical Landscape. . . .109
How Basic Authentication Works. . . 111
How Certificate-Based Authentication Works. . . 112
Certificate Chains. . . .113
Requirements for Keystore Passwords. . . .114
Load Balancer Root Certificates Supported by SAP. . . .115
6.2 SFTP-Based Communication. . . 116
How SFTP Works. . . 116
6.3 Message-Level Security. . . .117
How PKCS#7 Works. . . .119
How XML Signature Works. . . 121
How WS-Security Works. . . .123
1
Understanding the Basic Concepts
This section provides an overview of the concepts and terms.
1.1
Runtime in Detail
For different customers separate resources (in terms of: memory, CPU, file system) of the cloud-based integration platform are allocated – although all customers might share the same hardware. This concept is also referred to as tenant isolation.
Note
A tenant represents the resources of the cloud-based integration platform allocated for a customer. Typically one tenant is defined for each customer connected to the platform.
At runtime, data to be exchanged between the involved customers is processed on a cluster of different virtual machines hosted in the SAP cloud, at which each virtual machine is assigned to the corresponding tenant allocated for the connected customer.
Note
A virtual machine (VM) is a software implementation of a machine that executes a program like a physical machine.
It is always made sure that the involved virtual machines are strictly separated from each other with regard to the related customers. In addition to that, each tenant uses a separate database schema which guarantees that data of different customers is strictly separated.
Note
The architecture guarantees that different tenants are unable to interfere and that physical resources of the cloud platform are partitioned per tenant.
The runtime environment is composed of a cluster of virtual processes, where-by the message processing tasks for a tenant are performed within a dedicated Java Virtual Machine (JVM process or VM process). The individual processes are also referred to as nodes of the cluster.
Table 1:
Kind of Node Purpose
Tenant management node Performs tenant-specific management tasks like, for exam ple, starting tenant-specific runtime nodes or deployment of artifacts like integration flows or keystores, for example.
Runtime node Processes messages for a tenant.
Services required for message processing like, for example, routing or mapping, are implemented as subsystems of the node.
Note
There is the option to set up multiple tenant management nodes for a tenant in order to implement failover scenarios and thus to ensure high availability. When one management node fails, one of the additional nodes can take over the tasks.
A cluster for a tenant (shortly referred to as tenant cluster) is composed of one (or more) tenant management nodes and one or more runtime nodes.
Tenant clusters of different customers (customers) are strictly separated from each other and are unable to interfere.
In the Operations user interface (Node Explorer), the different kinds of nodes are arranged in the following way.
1.1.1
Virtual System Landscapes
There are different virtual system landscapes within SAP HANA Cloud.
The runtime components can be operated on the following of these landscapes.
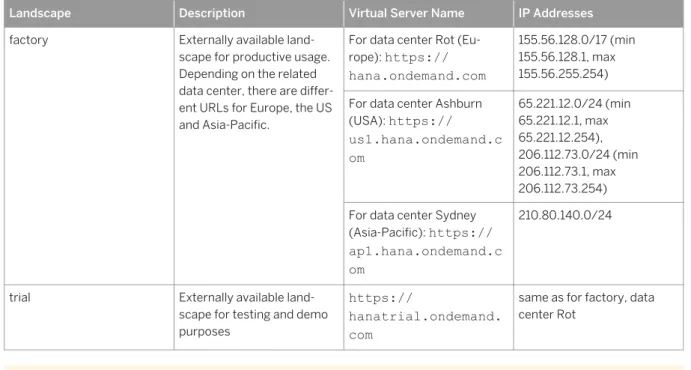
Table 2: Virtual System Landscapes
Landscape Description Virtual Server Name IP Addresses factory Externally available land
scape for productive usage. Depending on the related data center, there are differ ent URLs for Europe, the US and Asia-Pacific.
For data center Rot (Eu rope): https:// hana.ondemand.com
155.56.128.0/17 (min 155.56.128.1, max 155.56.255.254) For data center Ashburn
(USA): https:// us1.hana.ondemand.c om 65.221.12.0/24 (min 65.221.12.1, max 65.221.12.254), 206.112.73.0/24 (min 206.112.73.1, max 206.112.73.254) For data center Sydney
(Asia-Pacific): https:// ap1.hana.ondemand.c om
210.80.140.0/24
trial Externally available land
scape for testing and demo purposes
https://
hanatrial.ondemand. com
same as for factory, data center Rot
Note
The IP addresses are required by the customers to configure the firewall settings (IP whitelisting) to enable their system to connect to the cloud-based integration platform. Note that the table lists ranges of
supported IP addresses rather than fixed IP addresses. This has the following advantage: In case of hardware problems at the cloud-based integration platforms side, the customer can quickly switch to another machine (with another IP address) without the need to change the configuration in the back-end system.
Ports for Outbound Communication
When configuring an outbound channel (receiver adapter), make sure to use the following standard ports.
For outbound HTTP/HTTPS connections, always use port 443.
For SFTP connections, make sure that the SSH data channel between the SAP cloud platform and the SFTP
2
Installing and Configuring the Tool
You need to install the Eclipse feature locally and then connect your locally installed Eclipse to SAP HANA Cloud Integration. In particular, you connect to the tenant cluster, which is that set of virtual machines allocated for your organization or company in SAP HANA Cloud.
Prerequisites
Your SAP contact has provided you with the URL of the tenant management node.
Context
The tenant management node is that virtual process of your tenant cluster that is responsible for the operation and management of your tenant cluster. It is the connection point for your organization or company to SAP HANA Cloud Integration.
Procedure
1. Install the features by following the instructions provided at: SAP HANA Cloud Integration Tools
2. Start Eclipse.
3. In the operation subsystem preferences ( Window Preferences SAP HANA Cloud Integration
Operations Server ) specify the URL provided to you by SAP.
4. To start working with the Integration Operations tooling, open the Integration Operations perspective in
3
Monitoring (Integration Operations
Feature in Eclipse)
The Integration Operations feature provides functions for performing administrative tasks related to SAP HANA Cloud Integration (SAP HCI) runtime clusters and to message monitoring.
This section provides information on the editors and the views of the Integration Operations perspective.
Note
You can also find the documentation of this feature at: http://help.sap.com/cloudintegration under System Administration and Maintenance Information.
3.1
Launching the Integration Operations Feature
To launch the Integration Operations, you start the locally installed Eclipse application.
Context
Procedure
1. Install Eclipse and the dependent plug-ins (features) as described in the section referred to below. 2. Specify the connection to the management node as described in the section referred to below.
3. Start Eclipse. Depending on the version of your Integration Operations feature, the following information is displayed in a popup window during Eclipse startup and connection to the management node.
Option Description
Your Eclipse client is newer than the connected Opera tions Server.
Your (local) Eclipse client connects to a management node (Operations Server) with an older software version. In that case, not all functions might work as expected.
Your Eclipse client is older than the connected Opera tions Server.
Your (local) Eclipse client connects to a management node (Operations Server) with an newer software version. In that case, the client should be updated by installing a newer version of the feature. The popup window offers a link to the update function of Eclipse.
Related Information
Installing and Configuring the Tool [page 8]
3.2 Overview of Integration Operations Perspective
The following table summarizes the available elements of the Integration Operations perspective. The editors and views are explained in detail in the corresponding sections.
Table 3:
Element Description
Node Explorer (view) Displays the tenant cluster (tenant management node and assigned runtime nodes)
Message Monitoring (editor tab) Displays all messages processed by the tenant cluster.
Deployed Artifacts (editor tab) Displays deployed content
Aggregated Data (view) Displays statistical data related to message processing for a participant or runtime node (as selected in the Node Ex plorer).
Properties (view) Displays:
● Message processing log (for a message selected in Message Monitoring editor)
● Properties for nodes selected in Node Explorer or Node History
● Log information for deployed artifacts (if the Deployed Artifacts editor is opened and an artifact is selected) Component Status (view) Displays the status of the components (for example, of de
ployed artifacts) on a specific runtime node of a participant.
Tasks View Displays the status of the recent user tasks performed on
the cluster.
TailLog (view) Displays the newest entries of the log of a runtime node or of a management node.
Most editors and views provide information on the cluster or on the message processing in table format. Note that you can sort the content of a table in different ways by simply clicking ion the header of the column by which you want to sort.
When you select an entry in a view or an editor (for example, a message in the Message Monitoring editor), you can select the following functions in the context menu:
● Refresh
Copies the name of the selected object (for example, the selected message in the Message Monitoring editor) to the clipboard.
● Show Properties
Opens the Properties view for the selected object, for example, opens the message processing log for the selected message (displayed in the Properties view).
3.3 Node Explorer (View)
The Node Explorer displays the structure of a cluster.
In particular, the Node Explorer displays the tenant management node and assigned runtime nodes.
At top (below the tenant name), the tenant management node is displayed. The tenant management node has the prefix TM. Below the tenant management node, the runtime nodes are displayed which are assigned to the tenant management node.
For more information on the concepts behind SAP HCI clusters and how an SAP HCI is composed, see the SAP
HCI Operations Guide under Understanding the Basic Concepts Summary of Concepts and Terms SAP
HANA Cloud Integration Runtime in Detail .
Runtime nodes with the following status are displayed:
● LIVE – Node is up and running.
● LAUNCHING – Node has been launched but is not yet live (up and running).
● STOPPING – Node is stopping but not yet shut down.
● FAILED – Node failed during launching operation or due to a crash.
● ERROR – Node is in an error state, for example content deployment request on the node was not
successful.
● UPDATING – Node is updating. While in this state, the node is not able to receive further deployment requests.
● INACTIVE – Node is not accessible for external communication.
Nodes with status INACTIVE are greyed out in the Node Explorer.
Note
When you position the cursor on the tenant name, the following information is displayed in a tooltip: Version of the corresponding SAP HANA Cloud Integration software
When you position the cursor on a tenant management node or on a runtime node, the following attributes of the node are displayed in a tooltip:
● Name: host name of the node
● Node Type: IFL or IFL_MAP for runtime nodes, TENANT_MGMT for tenant management nodes
● Status
● Last Time Alive
● Version: Version of the corresponding SAP HANA Cloud Integration software
When you double-click (or click) a runtime node, the content of the currently opened view is updated. In order to display the properties of a runtime node, position the cursor on the node and choose Show Properties in the context menu. The attributes of the runtime node are then displayed in the Properties view. From the Node Explorer you can select the following functions in the context menu:
Table 4:
Cursor Position Available Functions
Cursor positioned on the tenant Show Message Processing Log
Opens the Message Processing Log (MPL). The MPL pro vides information on the steps during the processing of a message
More information: Properties View for Messages - Message Processing Log [page 22]
Deploy Artifacts ...
You can deploy artifacts (integration content or a security artifacts like a keystore).
More information: Deploying an Artifact [page 35]
Test Outbound Connection ...
You can test an outbound connection for the tenant. More information: Testing an Outbound Connection [page 43]
Cursor on tenant management node Show Properties
Opens the Properties view for the tenant management node.
Cursor on runtime node Show Properties
Opens the Properties view for the runtime node.
Remove Node
You can stop or remove an individual runtime node.
In the menu bar of the Node Explorer tab, you can select the following functions:
● Refresh
● Open Connection Preferences
You can open a dropdown listbox and select one of the previously used management node URLs.
3.4 Message Monitoring
The Message Monitoring editor displays all messages processed for a tenant according to the filter settings. To open message monitoring, double-click the tenant in the Node Explorer.
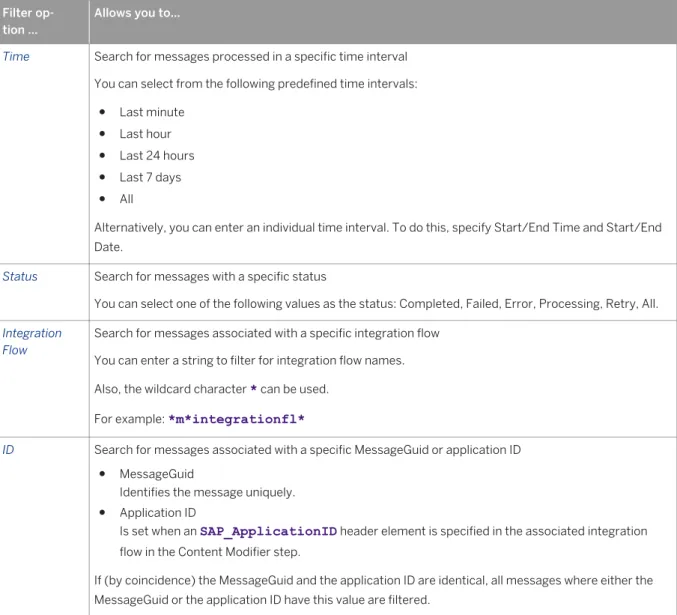
To display messages, you can specify the following filter criteria:
Table 5: Filter Options Filter op
tion ...
Allows you to...
Time Search for messages processed in a specific time interval You can select from the following predefined time intervals:
● Last minute ● Last hour ● Last 24 hours ● Last 7 days ● All
Alternatively, you can enter an individual time interval. To do this, specify Start/End Time and Start/End Date.
Status Search for messages with a specific status
You can select one of the following values as the status: Completed, Failed, Error, Processing, Retry, All.
Integration Flow
Search for messages associated with a specific integration flow You can enter a string to filter for integration flow names. Also, the wildcard character * can be used.
For example: *m*integrationfl*
ID Search for messages associated with a specific MessageGuid or application ID ● MessageGuid
Identifies the message uniquely. ● Application ID
Is set when an SAP_ApplicationID header element is specified in the associated integration flow in the Content Modifier step.
If (by coincidence) the MessageGuid and the application ID are identical, all messages where either the MessageGuid or the application ID have this value are filtered.
In case you have configured a message aggregation use case (using the Aggregator step in the integration flow), you have the option to show the status of the source messages (that are to be aggregated) and of the aggregated message.
To use this option, select the Include Dependent Messages checkbox. When you have activated this option, the message aggregate is displayed as first row in the table, whereas the source messages are listed below.
Note
A maximum of 200 messages are displayed.
Once you have specified and applied the filter settings,the messages are displayed in a table below the filter settings.
● Processed At
Displays the time when the message processing finished.
● Status
Specifies the end-to-end status of message processing.
For more information on the possible values, see the section referred to at the end of this topic.
● Receiver
Displays the receiver of the message.
● Processing Time
● Integration Flow
Displays the name of the integration flow that specifies the details of message processing.
● Application ID
Is set when an SAP_ApplicationID header element is specified in the associated integration flow in the Content Modifier step.
Selecting a message in the Message Monitoring editor determines the content displayed in the Properties view (message processing log).
Related Information
Message Status [page 14]Message Processing Log for Aggregated Messages [page 24]
3.4.1 Message Status
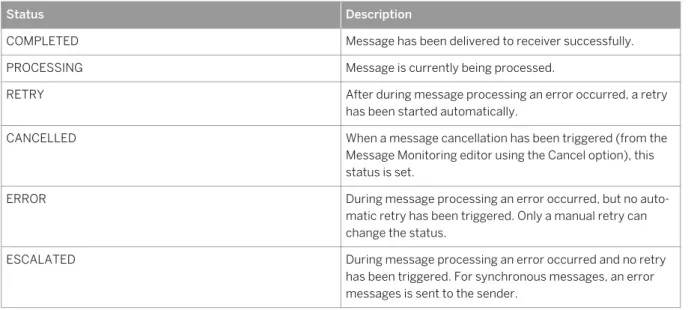
Messages processed on a tenant can have one of the following status.
Table 6: Message Status
Status Description
COMPLETED Message has been delivered to receiver successfully.
PROCESSING Message is currently being processed.
RETRY After during message processing an error occurred, a retry
has been started automatically.
CANCELLED When a message cancellation has been triggered (from the
Message Monitoring editor using the Cancel option), this status is set.
ERROR During message processing an error occurred, but no auto
matic retry has been triggered. Only a manual retry can change the status.
ESCALATED During message processing an error occurred and no retry
has been triggered. For synchronous messages, an error messages is sent to the sender.
Status Description
FAILED Message processing failed, message has not been delivered
to receiver and no retries are possible
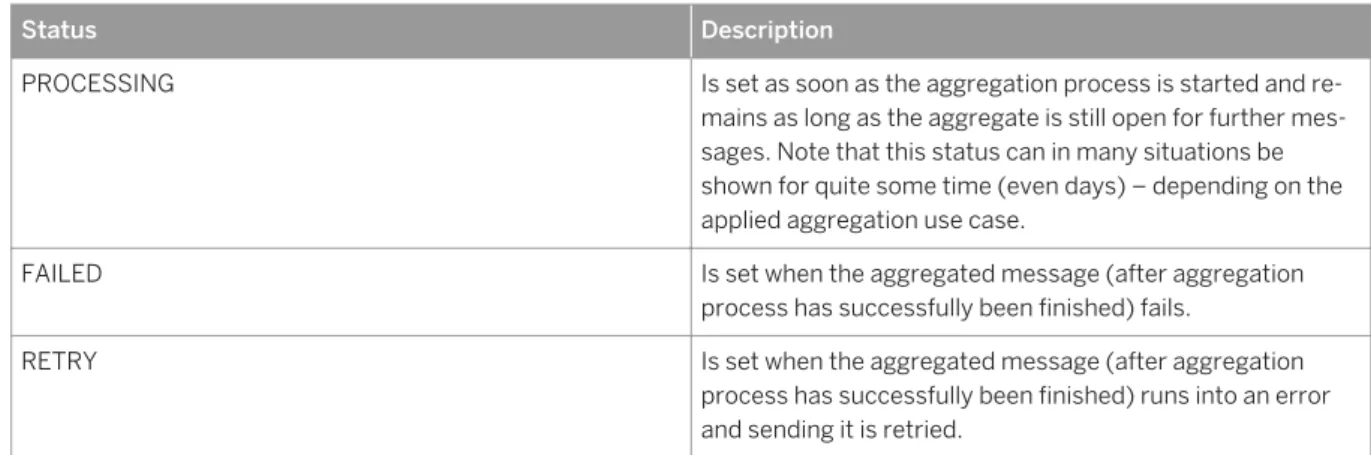
An aggregated message processing log (MPL) can have the following status values:
Table 7: Status of Aggregated Messages
Status Description
PROCESSING Is set as soon as the aggregation process is started and re
mains as long as the aggregate is still open for further mes sages. Note that this status can in many situations be shown for quite some time (even days) – depending on the applied aggregation use case.
FAILED Is set when the aggregated message (after aggregation
process has successfully been finished) fails.
RETRY Is set when the aggregated message (after aggregation
process has successfully been finished) runs into an error and sending it is retried.
3.5 Deployed Artifacts
The Deployed Artifacts editor provides an overview of deployed artifacts, for example, integration content and security artifacts.
In particular, the editor displays artifacts deployed on the tenant. For each artifact, the following information is displayed:
Table 8: Attributes Displayed in the Deployed Artifacts Editor
Attribute Description
Name Version
Type Possible values:
● CREDENTIALS (to specify user credentials for basic au thentication)
● JAVA_KEYSTORE (to store private and public keys) ● SSH KNOWN HOSTS (for known hosts file when using
Secure Shell protocol (SFTP))
● PGP_PUBLIC_KEYRING (to store public keys when us ing the Open Pretty Good Privacy (PGP) standard) ● PGP_SECRET_KEYRING (to store public and private
keys when using the Open Pretty Good Privacy (PGP) standard)
Attribute Description
NodeType Indicates the node type related to the artifact.
Possible values:
● IFL - for runtime node ● IFLMAP - for runtime node
● TENANT_MGMT - for tenant management node
Note
When you deploy a security artifact on a tenant, it will be made available to all runtime nodes (of the tenant). This behavior is made visible by setting the value of the <Node Type> attribute to TENANT_ALL in the Deployed Artifacts editor.
Deploy State Indicates if an artifact has been deployed successfully on a tenant.
Possible values: ● Stored ● Started ● Deploying ● Deployed ● Error
Indicates errors during deployment of an artifact. For example, if a wrong passphrase is specified during deployment of a keystore, the keystore will be de ployed, but the Deploy State gets the ERROR value. The Tasks View also shows this deployment error.
Note
How this state is related to the Synch State attribute is described under: Component Status View [page 27].
When you select an artifact, the logging entries for the deployment of that artifact are displayed in the
Properties view.
From the Deployed Artifacts editor, you perform the following tasks:
● Deploying artifacts
● Undeploying artifacts
● Downloading artifacts
Note
When you select a CREDENTIALS artifact (for User Credentials) you also have the option to edit the artifact (Edit button). For more information, see the detailed chapter referred to below under Related Links.
Related Information
Deploying an Artifact [page 35]3.6 Data Store Viewer
The Data Store Viewer displays the content of selected transient data stores available for a tenant. A transient data store temporarily stores messages for later processing. An integration flow can write messages to a transient data store or read messages from it.
To open the Data Store viewer, in Node Explorer double-click a tenant and open the Data Store Viewer tab. Users assigned to the following authorization groups can access the Data Store Viewer:
● AuthGroup.IntegrationDeveloper
● AuthGroup.Administrator (for the tenant administrator)
The available transient data stores are listed in a table – dependent on the filter criteria.
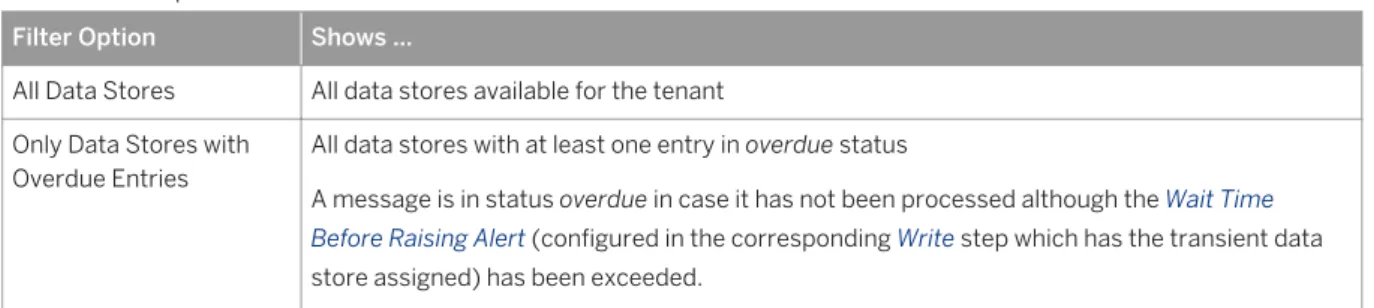
Table 9: Filter Options
Filter Option Shows ...
All Data Stores All data stores available for the tenant Only Data Stores with
Overdue Entries
All data stores with at least one entry in overdue status
A message is in status overdue in case it has not been processed although the Wait Time Before Raising Alert (configured in the corresponding Write step which has the transient data store assigned) has been exceeded.
The following attributes are shown for the selected tenant.
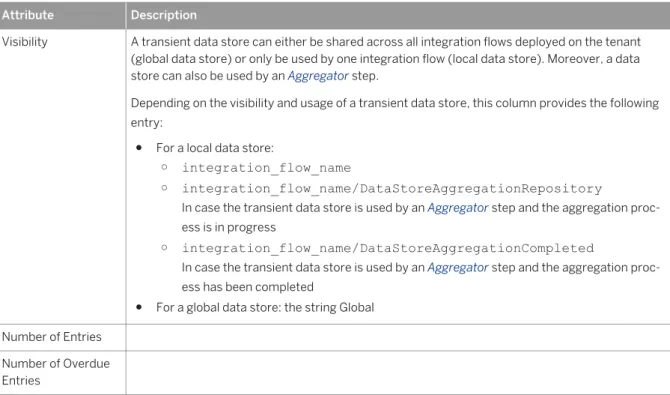
Table 10: List of Data Stores Attribute Description Data Store Name
Attribute Description
Visibility A transient data store can either be shared across all integration flows deployed on the tenant (global data store) or only be used by one integration flow (local data store). Moreover, a data store can also be used by an Aggregator step.
Depending on the visibility and usage of a transient data store, this column provides the following entry:
● For a local data store:
○ integration_flow_name
○ integration_flow_name/DataStoreAggregationRepository
In case the transient data store is used by an Aggregator step and the aggregation proc ess is in progress
○ integration_flow_name/DataStoreAggregationCompleted
In case the transient data store is used by an Aggregator step and the aggregation proc ess has been completed
● For a global data store: the string Global Number of Entries
Number of Overdue Entries
You can filter by typing any string.
When you position the cursor on an entry and you choose Copy in the context menu, you can copy the whole entry (including all table columns).
When you select a data store, the Properties view shows the following information (for the selected data store).
Table 11: Data Store Properties Attribute Description
Entry ID Displays the ID of the data store entry.
This ID can be configured in the corresponding Write step which has the transient data store assigned.
Overdue Indicates if the message is overdue (Yes) or not (No). Overdue Since Indicates the time since the message is overdue.
Written at Provides the time when the message has been received by the integration runtime.
To be Deleted on Provides the time when the message will be deleted (according to the corresponding Write step which has the transient data store assigned).
Up to 500 entries maximum are displayed for a data store by default. In case, there are more than 500 entries, this is indicated, and by clicking a hyperlink you can display the additional entries.
You can apply the following functions on data store entries. The functions are either accessible in the menu bar of the Properties view or by selecting one or multiple entries and choosing the corresponding function from the context menu:
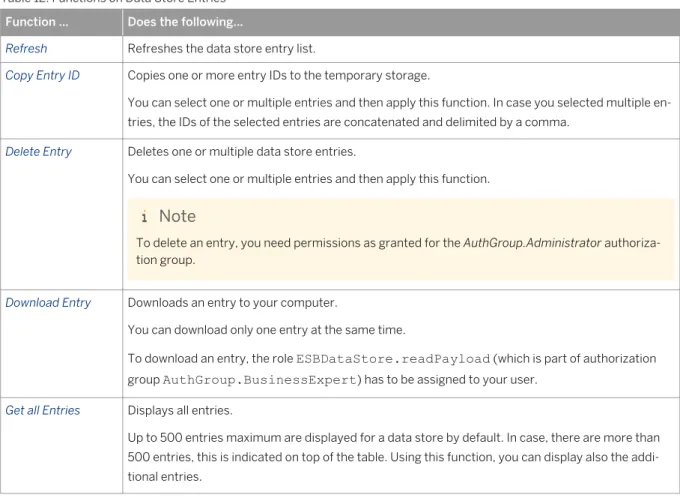
Table 12: Functions on Data Store Entries Function ... Does the following...
Refresh Refreshes the data store entry list.
Copy Entry ID Copies one or more entry IDs to the temporary storage.
You can select one or multiple entries and then apply this function. In case you selected multiple en tries, the IDs of the selected entries are concatenated and delimited by a comma.
Delete Entry Deletes one or multiple data store entries.
You can select one or multiple entries and then apply this function.
Note
To delete an entry, you need permissions as granted for the AuthGroup.Administrator authoriza tion group.
Download Entry Downloads an entry to your computer.
You can download only one entry at the same time.
To download an entry, the role ESBDataStore.readPayload (which is part of authorization group AuthGroup.BusinessExpert) has to be assigned to your user.
Get all Entries Displays all entries.
Up to 500 entries maximum are displayed for a data store by default. In case, there are more than 500 entries, this is indicated on top of the table. Using this function, you can display also the addi tional entries.
3.7 Properties View
The Properties view displays different data, dependend on which entity is selected.
Table 13: Properties View
Selected Entity Content of Properties View Node Explorer: runtime node or the a tenant management
node selected
Properties view contains node properties.
The Properties view is composed of the following tabs: ● Node
● Services
Message Monitoring editor: message is selected Properties view displays the message processing log (MPL) for this message. The MPL provides information on the steps during the processing of a particular message.
3.7.1
Properties View for Nodes
When you select a node, information related to the node are displayed in the Properties view.
3.7.1.1
Node Tab
The following attributes are displayed in the Node tab:
Table 14:
Area Property Description
General Application Specifies the application under which
the related tenant is subscribed. Node Type Specifies the node type. Possible val
ues are:
● IFLMAP for runtime nodes ● TENANT_MGMT for tenant man
agement node
Version Indicates the software version of the
runtime node (“node repo” version; same attribute as displayed as Version in the Properties View when cursor is positioned on the node)
This information is only displayed for nodes in one of the following status: LIVE, REMOVED, STOPPING or UP DATING.
VM Name Name of virtual machine
VM size Virtual machine size (more informa
tion: Starting and Stopping Nodes)
Runtime Info Last Time Alive Indicates time when the node has last
been in status LIVE
Status Indicates status of runtime node that is
also displayed in the Node Explorer (tooltip).
Status Description Provides optionally more information for the current status.
Used CPU Used Memory
Note
The following attributes are only displayed for runtime nodes in status LIVE, ERROR, FAILED, STOPPING: Version, VM Size, Used CPU, and Used Memory.
For nodes in status FAILED, the Version is not displayed in case failed launching of the node has caused this status.
3.7.1.2
Services Tab
The Services tab provides information on the service endpoints that are exposed by a runtime node selected in the Node Explorer.
Note
This information allows the integration content developer to check if the expected endpoints are exposed for the configured integration flows.
The tab displays the following attributes for a runtime node:
List of Integration Flow-Specific Endpoints
All integration flows that are processed by this runtime node and expose an endpoint (for Web service connectivity) are listed. For each integration flow, the integration flow-specific provider endpoint is displayed (next to Endpoint).
Administrators of remote systems who want to connect the remote system as a consumer to the runtime node need the relevant endpoint information. You have the following options to provide the consumer system administrator with the required information (position the cursor on the endpoint and call the context menu).
Table 15: Context Menu Options
Option Allows you to ... Further Options
Copy Endpoint URL Copy the endpoint URL that is displayed on the
Services tab.
The endpoint URL can be used to directly call a runtime node. It contains the server name of the runtime node.
Copy WSDL URL Copy the URL of the WSDL file. For each of these options, you can choose which
kind of WSDL you would like to copy or download. ● Standard
The WSDL includes policies. ● For ABAP Consumer
Option Allows you to ... Further Options
Download WSDL Download the WSDL file. The WSDL includes those elements that are
required to connect an SAP system based on Application Server ABAP.
● Without Policies
The WSDL does not include policies.
3.7.2 Properties View for Messages - Message Processing
Log
When a message is selected in the Message Monitoring editor, the Properties view displays the message processing log (MPL) for this message.
The MPL provides information on the steps during the processing of a particular message.
3.7.2.1
Displaying the Message Processing Log
When you select a message in the Message Monitoring editor, the message processing log is displayed in the Properties view.
Context
To display the MPL for a message flow, perform the following steps.
Procedure
1. In Integration Operations perspective, Node Explorer, double-click on the tenant. 2. The Message Monitoring editor is opened.
3. In the Message Monitoring editor click on the row for the message you like to analyse.
4. In the Properties view, the MPL is displayed. For information on the displayed attributes, see the detailed section referred to unter Related Links.
You can download the log to your local hard disk by selecting the Save function in the menu bar of the
Related Information
Message Processing Log [page 23]3.7.2.2
Message Processing Log
The message processing log displays structured information on the processing of a message. The following table lists the general properties of the message processing log (MPL):
Table 16: MPL Properties
Property Description
ContextName Integration flow name
CopmponentType Runtime component which processed the message at last
IntermediateError Is true, if during message processing an error (even tempo rarily) occurred or message processing needed more than 1 min.
MessageGuid Key which identifies the message uniquely in the database
Node Host name of the node which processed the message
OverallStatus Specifies the end-to-end status of message processing and
corresponds to the Status attribute in the Message Monitor ing editor.
For more information on the statuses, see: Message Status [page 14]
ReceiverId Specifies the name of the receiver as configured in the re
lated integration flow in case if a SOAP or IDOC Endpoint is used.
SenderId Specifies the name of the receiver as configured in the re
lated integration flow in case if a SOAP or IDOC Endpoint is used.
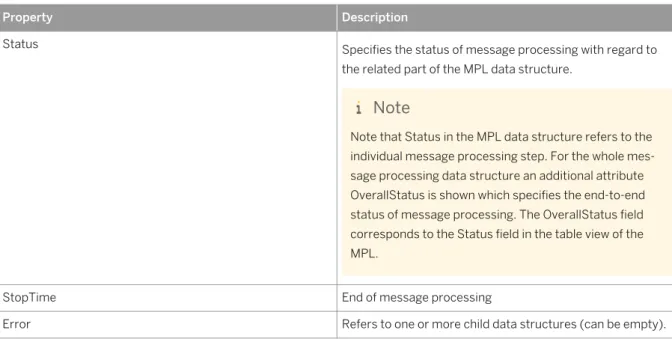
Property Description
Status Specifies the status of message processing with regard to
the related part of the MPL data structure.
Note
Note that Status in the MPL data structure refers to the individual message processing step. For the whole mes sage processing data structure an additional attribute OverallStatus is shown which specifies the end-to-end status of message processing. The OverallStatus field corresponds to the Status field in the table view of the MPL.
StopTime End of message processing
Error Refers to one or more child data structures (can be empty).
The following properties contain technical information.
Table 17: Technical MPL Properties
Property Description
Cxf.* Technical Cxf properties which are required for message
cancellation
StepID ID of the related integration flow step
The involved parts of message processing are displayed as separate child structures. On top of the MPL structure, you find proprties that contain metadata of the message as a whole. Below that, you find entries for each relevant integration flow step. As an example, you can find routing conditions (Xpath expressions) evaluated for the message at runtime. In case a mapping is used, the name of the evaluated mapping is shown. When the corresponding integration flow processes the same sequence of steps multiple times (in a loop), the loops are displayed one after each other on the same level in the MPL structure.
3.7.2.3
Message Processing Log for Aggregated Messages
When you have activated the Include Dependent Messages checkbox for an aggregated message in the message monitoring editor, the MPL of the aggregated message will contain all dependent source messages. The following properties are provided for the aggregated message in the MPL (on the root level of the aggregate):
Table 18: MPL Properties of Aggregated Messages
Property Description
Property Description
AggregateCompletedBy Indicates how the aggregation has been completed. The following values are possible:
● predicate
The complete set of expected messages has been received ● timeout
The complete set of expected messages has not yet been received and no new messages have been received for the period specified in the Completion Timeout This property is set when the aggregated message has been sent.
AggregateTimedOutAfter
The following properties (on the root level of the aggregate) are provided for a specif c aggregation strategy:
Table 19: MPL Properties of Aggregated Messages (for Specif Aggregation Strategy)
Property Description
LastMessageReceived (when
Combine or Combine in Sequence
is specified as Aggregation Algorithm in the Aggregator step)
Indicates if the last message of the aggregate has been received. Possible values:
● true
● false ReceivedSequenceNumbers
(when Combine in Sequence is specified as Aggregation Algorithm in the Aggregator step)
Returns the sequence numbers of the received messages (in interval notation). Example: ReceivedSequenceNumbers =[1,10], [12,20] indicates that message with sequence number 11 is missing.
3.7.3 Properties View for Deployed Artifacts
When you select a deployed artifact in the Deployed Artifacts editor, information related to the artifact are displayed in the Properties view.
The Info tab of the Properties view displays the following information related to the selected artifact:
Table 20: Attributes of Deployed Artifacts
Attribute Description
Deployed By Specifies the user who deployed the artifact.
Deployed From Specifies the IP address of the VM from which the artifact is deployed.
Deployed On Specifies date and time of the deployment task.
Description Displays more information on the artifact.
The following addtional information is only displayed for deployed security artifacts (type User Credentials):
Table 21: Attributes of Deployed Artifacts
Attribute Description
Credential Type Specifies the credential type.
Possible values:
● Default: in case default basic authentication for general SOAP connectivity is chosen
● SuccessFactors: in case basic authentication using the SuccessFactors adapter is chosen
User Specifies the user that is to be authenticated.
Company ID Specifies the client instance used to connect to the Suc
cessFactors system.
This attribute is only displayed for User Credentials artifacts with credential type SuccessFactors.
Server URL Specifies the URL used to connect to the SuccessFactors
system.
This attribute is only displayed for User Credentials artifacts with credential type SuccessFactors.
The Log tab of the Properties view displays logging information on the deployment of the artifact.
3.8 Aggregated Data View
The Aggregated Data view displays statistical data related to message processing. In the header of the Aggregated Data View tab, the following information is displayed:
● When participant is selected:
Statistic for: <selected participant> [Range: Last hour]
● When node is selected:
Statistic for: <participant / selected node> [Range: Last hour]
In the content area of the Aggregated Data view, the following information is displayed:
● Integration flow ID
● Exchanges Total: Displays the total number of messages exchanged.
● Exchanges Failed: Displays number of failed message exchanged.
● Mean Processing Time: Displays the mean processing time for a successful message exchanged. In case no messages have been processed successfully, Mean Processing Time = 0 is displayed.
● CXF(in/out) Invocations: Displays total number of CXF invocations.
● CXF(in/out) Failures: Displays number of failed CXF invocations.
● CXF(in/out) Mean Processing Time: Displays mean processing time for a successful CXF invocation.
For the CXF invocations, the suffix in indicates inbound Web service calls, the suffix out indicates outbound Web service calls.
Note
By default, the filter is set in a way that information is displayed for nodes that have been active during the last hour. To display information related to nodes that have been active earlier, change the filter settings accordingly.
To change the filter settings, click the triangle icon in the menu of the view.
3.9 Component Status View
The Component Status View shows the current status of all components running on the nodes of an SAP HCI cluster.
To display the status of all components of a node, select the node in the Node Explorer and go to the Component Status view.
For each component, the following information is displayed in separate columns:
Table 22:
Attribute Description
Name Name of component
For more information on the different components, see sep arate topic.
Attribute Description
Type Displays the component type.
The following kinds of components are detected in the Com ponent Status View:
● Integration Flow
Artifact that specifies the details of how a message is processed by a node.
● Value Mapping
Artifact that specifies transformations during message processing.
● Keystore
Artifact that contains key pairs for secure connectivity. ● SAP HANA Cloud Integration subsystem.
Indicates a service running on the node which is re sponsible for a specific aspect of message processing. To give an example, there is a subsystem for Web serv ice connectivity (WS Connectivity).
Note
Note
An artifact indicates an element that can be deployed on a tenant and be made available to all runtime nodes (as signed to the tenant).
Attribute Description
Runtime status Indicates if a component is operational on the runtime node.
Note
The runtime status is the same attribute as displayed as
Status in the Aggregated Data View.
For components with status error, you can display error de tails by positioning the cursor on the corresponding compo nent (table row) in the Component Status view and select ing Show Error Details in the context menu.
Error details can be displayed for subsystems as well as for deployable artifacts.
Note
For an operations agent component in status error, the Error Details show which related components are errone ous.
With regard to deployable content such as integration flows and keystores, for example, note the difference between the
Synch State (displayed in the Deployed Artifacts editor) and the Runtime Status (displayed in the Component Status View). To illustrate the difference, there are the following ex amples:
Possible error causes depend on the component. For exam ples of error causes, see table below.
Attribute Description
Synch Status Indicates if an artifact which has been deployed on a tenant has already been replicated and made available to the as signed runtime node.
Note
The Deploy State displayed in the Deployed Artifacts edi tor indicates if an artifact has been deployed successfully on a tenant. After the deployment, the tenant manage ment node and the assigned runtime nodes are being synchronized. After this synchronization process, the ar tifact is been replicated and made available for the run time nodes. The result of this process is indicated with the Synch Status attribute in the Component Status view.
This attribute can have the following values: ● synchronized
Component on selected runtime node is identical with component on tenant management node.
● to be updated
Component on selected node has different ID than component on tenant management node, however, both components have the same name. Therefore, this state implies that the component is to be considered as to be updated.
● to be removed
Component on selected runtime node doesn’t exist on tenant management node at all (by component name). Therefore, this state implies that the component is to be considered as to be deleted.
● unknown
Component on selected runtime node cannot be re lated to a component on the tenant management node (by name). That means, it is not known to the system and no ID has been set for the component. A possible reason for this situation is that this component has been made available for the runtime node by any man ual method but not by the standard deployment proc ess.
Note
This status is only displayed in case the component type is an artifact (integration flow or keystore). ● not applicable
Attribute Description
This Synch Status is not displayed for subsystem com ponent types, because, other than an integration flow or a keystore, a subsystem cannot be deployed and therefore, a synch status has no meaning.
Note
Note the following difference between Aggregated Data view and Component Status view with regard to deployed content:
The Aggregated Data view shows the operative state of the content (for example, if an integration flow runs without errors). The Aggregated Data view shows only the status for integration flow content.
The Component Status view shows if content has reached the node during deployment as well as the actual runtime status of the deployed bundle.
Related Information
Runtime Status [page 31] Component Monitors [page 32]3.9.1
Runtime Status
The runtime status indicates if a component is operational on the runtime node. The following values are possible:
● installed
For a deployable component, this status means: the component has been deployed but not started yet.
● launching
Component is currently being started.
For a deployable component, this status means: the component has been deployed and is currently being started.
● started
Component is started on selected runtime node.
● error ● stopping
3.9.2 Component Monitors
The Component Status view provides an overview of the status of the SAP HCI components on the cluster nodes. This section provides an overview of the available components as well as information on the recommended steps in case a component is in state error.
Table 23: Overview of Components and Recommended Steps in Case of Errors
Component Component Type Description Steps to Resolve Erroneous Runtime State
With regard to artifacts like integration flows, regard the following:
Artifacts are deployed from a tenant management node to the related runtime nodes. At runtime, it has to be made sure that the version of the artifact on the runtime node is the same like the version on the tenant management node. The Component Status view helps you to analyze issues related to that.
Components of type Integration Flow or Value Mapping can be restarted. To do this, select the component and choose Restart (next to the table).
3.9.3 Monitoring External Reachability of Tenant
Management Nodes
Using the Component Status view, you can monitor if the tenant management node can be reached by external calls.
For this purpose the tenant management node calls itself regularly every 30 seconds through the SAP HCI load balancer.
The call simulates the Test Connection function in the Integration Operations cockpit. The corresponding monitor is called Operations Server Connectivity in the Component Status view (for the selected tenant management node).
The component displays an error status if the tenant management node is not reachable via the load balancer for any reason. In this case, the detailed error message displays either the exception (text) or the HTTP return code and text of the last attempt.
Note
You can display the error message in the Component Status view by positioning the cursor on the component and selecting Show Error Details in the context menu.
3.9.4 Monitoring External Reachability of Runtime Nodes
Using the Component Status view, you can monitor if runtime nodes (assigned to the tenant management node) can be reached by external calls. For this purpose, an external SSL call of a runtime node is simulated and monitored using a specific component in the Component Status view.
This monitor displays the basic technical SSL connectivity of a runtime node. To simulate an external call, the following call is performed every 30 seconds on a regular basis:
A tenant management node calls a runtime node (assigned to the tenant management node) via the SAP HCI load balancer.
As monitor for this connectivity test, the following component is displayed in the Component Status view (for the selected tenant management node) as soon as a runtime node has been started:
CXF-endpoint-<node type>-<virtual server> (for example: CXF-endpoint-IFLMAP-intaas) The component displays an error status in one of the following cases:
● The required keystores for the SSL connection are not deployed (or not consistent).
The keystore must contain a a valid client certitifcate that is accepted by the SAP HANA Cloud Integration load balancer as well as the root certificate of the same.
● The runtime node (for which connectivity is to be monitored) does not exist.
3.10 Tail Log View
This view displays the newest entries of the log of a selected node (“tail of the log”). Use this view to search for information in case a node is in an erroneous state.
You can display the tail log of runtime nodes and of tenant management nodes – depending on what is selected in the Node Explorer:
● When you select cluster or a participant in the Node Explorer, the tail log for the tenant management node is displayed.
● • When you select a runtime node or a tenant management node in the Node Explorer, the tail log for the node is displayed.
To display the tail log of a node, perform the following steps:
1. Select the node in the Node Explorer and go to the TailLog View tab. 2. Specify the size of the tail log (in kB) that should be displayed.
3. Using the Search window, you can specify specific strings that are to be highlighted in the tail log. You can navigate (upward or downward) to the next hit.
You can refresh the view.
Note
Recommendation: Check the tail log of a runtime node in case you detect problems with this runtime node in the Component Status View.
Note
Recommendation: Check the tail log of a tenant management node in case of general problems with runtime nodes (for example, in case there are problems with starting (launching) runtime nodes or content deployment).
3.11 Tasks View
This view shows the status of the recent tasks performed, such as deploying content or launching a runtime node.
The following attributes are displayed for each task:
● Task
Provides the name of the task.
● Status
The following status values are possible:
○ new
Task is waiting.
○ Running
Task is in progress.
○ Success
Task has been performed successfully.
○ error
Task has been stopped with an error, a retry is possible.
○ failed
Task has been stopped with an error, no retry is possible.
○ scheduled
Task has been scheduled but not been started yet.
● Start Time
Indicates the start time of the task.
In case a recurring task (job) is displayed, Start Time indicates the time the job has been started first.
● TenantID
Identifies the tenant related to the task.
● User
Displays the user ID that you have used to log on to the Operation Server.
● TaskID
Provides the ID of the task. The following tasks are displayed:
● Launch node
● Update software
● Shutdown node
● Cleanup
● Node discovery
● Node failover
● Node health check
● Node self update
● Send node snapshot
● Deploy content
● Artifact migration
Is displayed when a cluster with deployed security content is updated.
● Generate and Build Project [<Bundle name from Manifest.MF file is shown in this bracket>] - Task related to single project deployment
● Generate and Build Project [Multiple Projects] - Task related to multiple project deployment
Note
By default, the following attributes are displayed for a task: Task (name), Status and Time.
Using the dropdown list in the toolbar of the view (triangle icon), you can show or hide the Task ID and User column.
You can also refresh the view in order to display the latest state.
Using the dropdown list in the toolbar of the view (triangle icon), you can choose between horizontal and
vertical layout for the Tasks View ( Layout Horizontal/Vertical ).
When you select the tenant, the tenant management node or a runtime node in the Node Explorer, the Tasks
View shows the tasks related to the corresponding participant.
When you select the tenant in the Node Explorer, the Tasks View shows the tasks that are related to the tenant. When you select a task, a detailed log is displayed under Task Trace. The log in the Task Trace is available for 24 hrs from the time the task was triggered.
Below you can display more information on each selected task (in the Task Trace).
3.12 Deploying an Artifact
You can deploy different types of artifacts (such as integration content or security-relevant artifacts), each serving a different purpose. To make an artifact available for the runtime, you have to deploy it on the relevant runtime node of a given tenant.
Prerequisites
In the Node Explorer, you have positioned the cursor on the tenant and chosen Deploy Artifact ... in the context menu.
Procedure
1. Select the artifact type.
Option Description
Keystore This artifact contains the public and private key used for certificate-based authentication when send ing a message from a SAP HANA Cloud Integration tenant to a receiver (outbound message process ing). It has to be deployed on the corresponding tenant to enable the tenant to communicate based on public key technology.
The keystore artifact is used to deploy both keystores for SSL and SSH transport security.
Known Host (SSH)
Specifies the known_hosts file used when configuring secure connectivity based on the SSH File Transfer Protocol (SFTP). It contains the public keys and addresses of the “trusted” SFTP servers. The client checks if the server is a trusted participant by evaluating a known_hosts file on the client side: If the server's public key is listed there, the identity of the server is confirmed.
PGP Public Keyring
This artifact contains the public key that enables the tenant to encrypt or verify messages using the Open Pretty Good Privacy (PGP) standard.
PGP Secret Keyring
This artifact contains public and private key pairs for the usage of Open Pretty Good Privacy (PGP). The private key enables the tenant to decrypt or sign messages.
OAuth2 This artifact contains the OAuth login URL to connect to the service provider. The client ID and client secret verifies the identity of the client.
User Creden tials
Specifies user, password (and, depending on the related connectivity option, other attributes) for ba sic authentication.
Note
If you have missed an attribute or you have entered inconsistent passwords, you cannot proceed with the wizard.
The node type is typically predetermined according to the node type that has been specified for the cluster.
2. Choose Next.
Next Steps
To undeploy an artifact, select the artifact in the Deployed Artifacts editor and choose Undeploy. Confirm with
Yes in the next window.
Note
Related Information
Deploying and Editing a User Credentials Artifact [page 41] Deploying a Keystore [page 37]
Deploying a Known Hosts Artifact [page 38] Deploying a PGP Public Keyring [page 38] Deploying a PGP Secret Keyring [page 39]
Deploying an OAuth2 Authentication Artifact [page 40]
3.12.1 Deploying a Keystore
This artifact contains the public and private key used for certificate-based authentication when sending a message from a SAP HANA Cloud Integration tenant to a receiver
Prerequisites
In the Node Explorer you have selected a tenant, in the context menu you have selected Deploy Artifacts..., and then as Artifact Type you have specified Keystore.
You have created a keystore file and stored it on your computer.
Context
Procedure
1. Browse for the keystore file on your computer. 2. Enter the password of the keystore.
This password has been defined when the keystore has been created.
When you enter the password, it is checked if the password is identical to the one specified when the keystore has been created. In case the entered password differs from the original one, an error message is displayed. Also in case the keystore is defect and, therefore, cannot be deployed, an error is displayed. Note that only keystores with the format jks or jceks can be deployed.
Although it is possible to have a keystore without password protection, it is currently (by intention) not possible to deploy an unprotected keystore via the Integration Operations perspective.
3.12.2 Deploying a Known Hosts Artifact
This artifact type specifies the known hosts file used when configuring secure connectivity based on SSH File Transfer Protocol (SFTP). It contains the public keys and addresses of the trusted SFTP servers.
Prerequisites
In the Node Explorer you have selected a tenant, in the context menu you have selected Deploy Artifacts..., and you have specified Known Hosts (SSH)as the Artifact Type.
You have created a known hosts file and stored it on your computer.
Context
Procedure
1. Browse to the known hosts file on your computer. 2. Choose Finish.
3.12.3 Deploying a PGP Public Keyring
This artifact contains the public key that enables the tenant to encrypt or verify messages using the PGP standard.
Prerequisites
In the Node Explorer you have selected a tenant, in the context menu you have selected Deploy Artifacts..., and you have specified PGP Public Keyring as the Artifact Type.
You have created a PGP public keyring file and stored it on your computer.
Procedure
1. Browse to the PGP public keyring file on your computer. 2. Choose Finish.
Related Information
How OpenPGP Works [page 124]3.12.4 Deploying a PGP Secret Keyring
This artifact contains the public and private key pair for the usage of Open Pretty Good Privacy (PGP). The private key enables the tenant to decrypt or sign messages.
Prerequisites
In the Node Explorer you have selected a tenant, in the context menu you have selected Deploy Artifacts..., and you have specified PGP Secret Keyring as the Artifact Type.
You have created a PGP secret keyring file and stored it on your computer.
Context
Procedure
1. Browse to the PGP secret keyring file on your computer. 2. Enter the password of the PGP secret keyring.
This password was defined when the PGP secret keyring was created.
Related Information
How OpenPGP Works [page 124]3.12.5 Deploying an OAuth2 Authentication Artifact
Context
OAuth 2.0 is specification that many web servers use for authorization purposes. If you want to connect to a system that uses OAuth 2.0 authentication, you need to deploy the artifacts using the following procedure.
Note
You can deploy OAuth 2.0 artifact using the Deploy Credentials wizard. For information on deploying credentials, see
Procedure
1. Enter values in fields based on the description given in the table:
Field Description
Name Name of the artifact that you want to deploy on the tenant
Description (optional) Description of the artifact name you are deploying on the tenant
Authentication URL URL that you are using to authenticate the OAuth 2.0 arti fact
Note
You use this URL to login to the service provider
Client ID ID of the client that you are connecting to Client secret Secret key of the client that you are connecting to Scope Access rights you are requesting from the service pro
vider
3.12.6 Deploying and Editing a User Credentials Artifact
To enable an SAP HANA Cloud Integration runtime node to connect as a client to a receiver system using basic authentication or username token authentication, you have to specify the required attributes (for example, user name and password).
Prerequisites
In the Node Explorer you have selected a tenant, in the context menu you have selected Deploy Artifacts..., and you have specified User Credentials as the Artifact Type.
Context
You can specify basic authentication either for a connected SuccessFactors system (through the
SuccessFactors adapter) or for general SOAP connectivity. To enable basic authentication for a runtime node, you specify the user credentials and deploy the attributes (in the form of a User Credentials security artifact) on the corresponding tenant.
This artifact type is also referred to as CREDENTIALS in the Deployed Artifacts editor. In other words: The attributes specified with a User Credentials artifact are summarized as credentials.
Procedure
1. Select one of the following values as Type:
Option Description
Default For general SOAP connectivity
SuccessFactors For connectivity based on the SuccessFactors adapter
2. Specify the other attributes on this wizard page. Specify the following attributes:
Name: Provide a name for the artifact (also referred as credentials name).
Description: You have the option of providing a more elaborate description of the artifact.
User: Specify the user that calls the receiver system.
Password: Specify the password against which the user has to be authenticated.
3. Finalize the deployment of the artifact. The following steps depend on the chosen credential type (either Default or SuccessFactors).
Option Description You have selected Default. Choose Finish.
You have selected SuccessFactors. Choose Next and specify additional attributes on the next wizard page.
4. If you have selected SuccessFactors as Type: Choose Next and specify the following attributes on the next wizard page.
Specify the following attributes:
Attribute Description
Server URL Specify the URL used to connect to the SuccessFactors system.
Example: https://
salesdemo4.successfactors.com:443/ sfapi/v1/soap
Company ID Specify the client instance used to connect to the Suc cessFactors system.
Example: myCompany25
5. Choose Finish.
Next Steps
Note
When you have re-deployed this artifact, you also have to re-deploy and restart all integration flows that use this artifact.
Alternatively, you can deploy User Credentials artifacts in the following way:
● Start the Deploy Artifacts wizard by choosing Deploy in the Deployed Artifacts editor (for a selected tenant).
In the Deployed Artifacts editor you get an overview of all deployed artifacts.
Note
User Credentials artifacts are indicated in the Deployed Artifacts editor by the CREDENTIALS type. You can also use this wizard to edit an existing User Credentials artifact (from the Deployed Artifacts editor).
Note
Note the following when editing an existing User Credentials artifact:
● Specifying a password is not mandatory. However, note that each entry you make when editing the
artifact overwrites existing passwords defined for the artifact prior to using this editor. This is also the case when you provide an empty string for the password.
● If a password has already been defined for the artifact prior to using this editor, you need to re-enter this password. If you do not enter any password, the original password will be overwritten (by an empty string).
Related Information
Properties View for Deployed Artifacts [page 25]
3.13 Testing an Outbound Connection
You can test an outbound connection (for a tenant calling a receiver system).
Context
You can check SSL and SSH connections.
Procedure
1. In the Node Explorer, position the cursor on the tenant. 2. In the context menu choose Test Outbound Connection ....
3. Select the type of connection (SSL Connection or SSH Connection). 4. Choose Next.
5. Depending on the chosen connection type, specify the following settings for the connection:
Option Description For SSL
connec tions
Specify the following settings: ○ Host
Enter the host name of the receiver.
The host name must not contain any path or schema (like, for example, https://). In particular, you must not enter a URL as host name.
○ Port
Enter the port that is to be used for outbound communication. Standard port is 443.
○ Client Certificate Authentication (optional)
Choose this option in case that during the SSL handshake also the tenant (client) is to be authenti cated against the receiver (server).
Option Description
Having selected this option, you can further specify the key to be used for the test (see below). ○ Alias (only in case Client Certificate Authentication has been selected)
Enter the alias that identifies the relevant key pair for client certificate authentication.
In order to enable the tenant to authenticate itself as client against the receiver, a suitable key has to be available in the deploed keystore.
With the Alias field you can narrow down the test that way that a specific key is being used (for exam ple, a key that fits to the configuration settings in the corresponding adapter).
For SSH connec tions
Specify the following settings: ○ Host
Enter the host name of the receiver.
The host name must not contain any path or schema (like, for example, https://). In particular, you must not enter a URL as host name.
○ Port
Enter the port that is to be used for outbound communication. Standard port is 22.
○ User Name
Enter the name of the user under whcih the tenant calls the SFTP server.
6. Choose Run.
Results
If the connection test was successful, the following information is displayed in a popup window:
● For SSL connections:
○ Hostname: Port
○ Used alias (in case a certificate-based connection has been tested)
● For SSH connections:
○ Hostname: Port
○ User Name
Related Information
SSL Outbound Connection Test [page 44] SSH Outbound Connection Test [page 45]
3.13.1 SSL Outbound Connection Test
When you have selected the SSL connection type, the test tool checks the following:
● If the keystore is deployed correctly and contains those keys that are required for the specified authentication method during SSL handshake
The following figure illustrates how an SSL connection test works.
The function tests an SSL handshake that takes place when an HTTPS connection is being built up. For the SSL handshake (to be tested), it is always required that the receiver (server) authenticates itself against the tenant (client).
In case the receiver requires that during the SSL handshake also the tenant (client) is authenticated against the receiver (server), you can configure the connection test accordingly (selecting the Client Certificate Authentication option).
3.13.2 SSH Outbound Connection Test
When you have selected the SSH connection type, the test tool checks the following:
● If the server (host) is reachable for the tenant
● If the SSH server has accepted the user and the key (id_rsa or id_dsa) from the corresponding keystore deployed on the tenant