Research
Discussion
Paper
Trends in the Funding
and Lending Behaviour of
Australian Banks
Chris Stewart, Benn Robertson and
Alexandra Heath
research so as to encourage discussion and comment. Views expressed in this paper are those of the authors and not necessarily those of the Reserve Bank. Use of any results from this paper should clearly attribute the work to the authors and not to the Reserve Bank of Australia.
The contents of this publication shall not be reproduced, sold or distributed without the prior consent of the Reserve Bank of Australia.
ISSN 1320-7229 (Print) ISSN 1448-5109 (Online)
Banks
Chris Stewart*, Benn Robertson** and Alexandra Heath*
Research Discussion Paper 2013-15
December 2013
* Economic Research Department ** Domestic Markets Department
Reserve Bank of Australia
We would like to thank Chris Aylmer, Guy Debelle, Luci Ellis and Paul Veerhuis for useful comments and suggestions. The views expressed in this paper are our own and do not necessarily reflect those of the Reserve Bank of Australia. Any errors are our own.
Authors: stewartc, robertsonb and heatha at domain rba.gov.au Media Office: rbainfo@rba.gov.au
i
This paper describes the Australian banking system, highlighting ways in which it differs from other major banking systems. It draws together themes from previous work conducted at the Reserve Bank of Australia (RBA), and outlines the role the banking system plays in the transmission of monetary policy and the transformation of risk. The paper also discusses some more recent trends, including the increased focus on deposit funding and potential changes in the determination of lending rates due to changes in the pricing of risk. These trends are, in turn, being influenced by changes in the preferences towards, and understanding of, different types of risk by investors, banks’ management and regulators.
JEL Classification Numbers: G01, G2, E4, E5
Keywords: banking, composition of funding, financial crises, interest rates, supply of credit
ii
1. Introduction 1
2. Funding Behaviour 3
2.1 Historical Drivers 4
2.2 Recent Influences and Implications 10
2.2.1 Implications for risks 12
2.2.2 Implications for funding costs 15
2.2.3 Implications for the economy 16
3. Lending Behaviour 20
3.1 Historical Drivers 21
3.2 Recent Influences and Implications 23
3.2.1 Role of the cash rate 23
3.2.2 Pricing of risk 25
3.2.3 Liquidity and maturity transformation 30
4. Profitability 31
5. Conclusion 35
Chris Stewart, Benn Robertson and Alexandra Heath
1.
Introduction
Banks are first and foremost intermediaries between different agents in the economy. They facilitate transactions between these agents by providing a number of services. In particular, banks allow households, businesses and other organisations to transfer funds between each other through payment systems. Through the process of intermediation, banks convert savings into loans and in doing so change their characteristics, such as their maturity. As a result, banks must manage various types of risk, including liquidity and credit risk.
In undertaking intermediation, there are a number of ways in which the Australian banking system differs from many of its international counterparts. These differences have arisen from the interplay of a range of forces such as: the macroeconomic environment; household, business and financial institutions’ preferences; and the regulatory and tax framework. Gizycki and Lowe (2000) and Davis (2011) provide overviews of the evolution of the Australian banking system over the 1990s and 2000s.
This paper discusses how the Australian banking system differs from systems overseas, how it might evolve in the medium term and the potential implications. To do this, we start by focusing separately on bank funding and bank lending, before considering the implications for bank profitability.
On the funding side, one of the most obvious differences between the Australian banking system and its international counterparts is in the share of funding sourced from deposits. Deposits currently comprise just under three-fifths of Australian banks’ funding liabilities. While this has increased considerably in recent years, it is below the share of funding sourced from deposits by many of their international peers (RBA 2012). The corollary of this is that wholesale funding currently makes up a larger share (about 35 per cent) of Australian banks’ funding.
On the lending side, Australian banks tend to carry out more retail banking business than many of their international counterparts. To a large degree, this
reflects their focus on lending to the household sector, rather than lending to the business sector, and the generally small scale of their investment banking activities. Davis (2011) notes that residential loans made up close to 60 per cent of Australian banks’ total loan portfolios in 2009, but less than 40 per cent in the United States and Canada, and 15 per cent in the United Kingdom. The focus on housing lending has, in part, reflected a substantial increase in household sector leverage in Australia over the 1990s and early 2000s to a level consistent with that in most other advanced economies. This was facilitated by a larger decline in nominal interest rates in Australia, associated with a larger fall in inflation over the 1990s, and a gradual easing in credit constraints associated with both increased competition and financial deregulation (Kent, Ossolinski and Willard 2007). At the margin, the relatively low level of government intervention in the residential mortgage-backed securities (RMBS) market might have also contributed. Growth in business sector credit was more muted, largely as a result of the strong increase in external fund raising by businesses over the late 1980s, and businesses re-evaluating their gearing following the early 1990s recession.
The Australian banking system, in contrast to some other large banking systems, predominantly undertakes lending using variable rates. Unlike variable interest rates in a number of other countries, almost all variable-rate housing loans in Australia are set at the lenders’ discretion, rather than as a margin over a benchmark. In Australia, between 1997 and mid 2007, advertised interest rates on mortgages broadly tracked movements in the cash rate. This reflected the stability of risk margins and lenders’ funding costs relative to the cash rate. Despite this, the actual rate paid by borrowers continued to decline throughout this period, reflecting the increasing prevalence of discounts offered to new customers as lenders competed for new loans.
The Australian banking system has performed well for over two decades. Since 1993, the major banks’ profits have grown at an average annual rate of about 15 per cent. Over the same period, these banks have recorded an average return on equity of about 15 per cent, which is roughly in line with the return on equity for other large domestic corporations, as well as banks in other countries prior to the global financial crisis. However, unlike many of their international counterparts, Australian banks did not suffer large falls in profits following the onset of the global financial crisis.
The rest of this paper proceeds as follows. Section 2 discusses the funding behaviour of Australian banks in more detail, exploring the historical drivers for their funding composition, recent influences on this composition, and how it may evolve. In a similar manner, Section 3 examines the historical influences on the lending behaviour of Australian banks and how it might change in the future. Section 4 discusses the implications of these changes for bank profitability and Section 5 concludes.
2.
Funding Behaviour
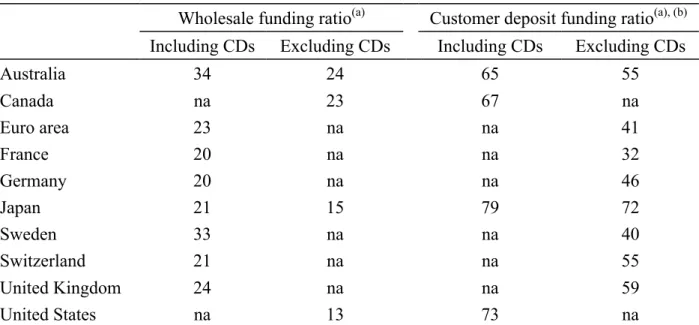
A distinguishing feature of the Australian banking system, relative to its international peers, has been its greater use of wholesale funding, particularly offshore funding (Table 1). This reflects the influence of a range of macroeconomic, institutional and bank-specific factors over the past couple of decades. It is worthwhile noting that differences in statistical definitions play some role in explaining the Australian banking sector’s low use of deposit funding. For example, the RBA treats certificates of deposit and intragroup deposits from offshore entities as wholesale debt based on an assessment of how ‘sticky’ these funding sources might be during a crisis. If they were instead treated as deposit liabilities (as they are in Canada and the United States, where they are covered by deposit insurance), this would add 10 percentage points to the deposit share of funding in Australia and reduce the (short-term) wholesale funding share by the equivalent amount.
Table 1: Funding Composition Across Countries
Per cent
Wholesale funding ratio(a) Customer deposit funding ratio(a), (b) Including CDs Excluding CDs Including CDs Excluding CDs
Australia 34 24 65 55
Canada na 23 67 na
Euro area 23 na na 41
France 20 na na 32
Germany 20 na na 46
Japan 21 15 79 72
Sweden 33 na na 40
Switzerland 21 na na 55
United Kingdom 24 na na 59
United States na 13 73 na
Notes: Funding ratios across banking systems are subject to definitional differences; certificates of deposit (CDs)
are classified as wholesale funding in all countries except Canada and the United States, where these instruments are eligible for deposit insurance
(a) Expressed as a share of funding liabilities (total liabilities including equity, less derivatives and other non-debt liabilities)
(b) Customer deposits are total deposits minus deposits from banks and ‘other monetary financial institutions’, which includes credit unions, building societies and money market funds
Sources: APRA; BIS; Bloomberg; Federal Deposit Insurance Corporation; Office of the Superintendent of Financial Institutions; authors’ calculations; central banks
2.1 Historical Drivers
A number of factors play some role in the Australian banking system’s greater use of wholesale funding relative to some of its international peers. One of the most important was the strong growth in lending to Australian households in the two decades prior to the global financial crisis. This was driven by the household sector’s willingness to increase its gearing that was facilitated by deregulation and the shift to a lower inflation environment, which decreased the cost and increased the availability, of finance. Indeed, Kent et al (2007) note that Australia is one country where these factors are likely to have been particularly strong and operating simultaneously. Banks also continued to intermediate funding for Australian corporations.
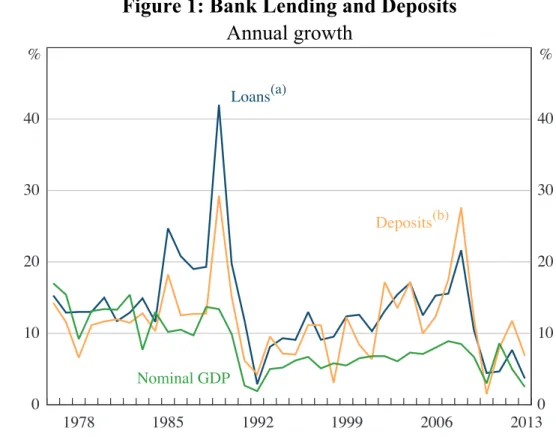
Deposit growth was somewhat slower than credit growth, although it still grew faster than nominal income (Figure 1). This was partly associated with the asset allocation decisions of households. For example, since the early 1990s, Australian households have had a relatively low and decreasing share of their wealth held in financial (for example, non-housing) assets and, within financial assets, a declining share has been held in the form of bank deposits (Ynesta 2008; Davis 2013).1
Figure 1: Bank Lending and Deposits
Annual growth
0 10 20 30 40
0 10 20 30 40
2013
Loans(a)
% %
Deposits(b)
2006 1999
1992 1985
1978
Nominal GDP
Notes: (a) Prior to 1989 includes banks’ holdings of bank accepted bills
(b) Includes certificates of deposit Sources: ABS; authors’ calculations
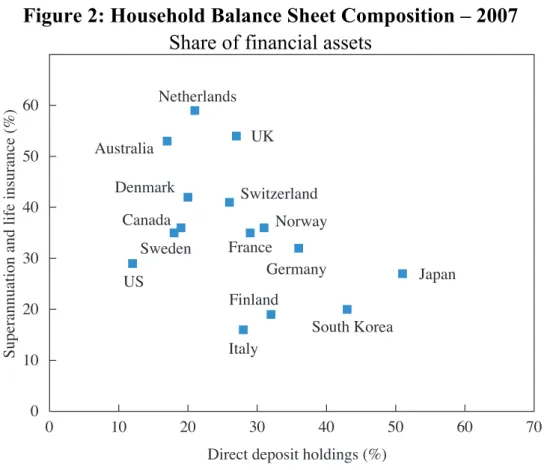
The low share of household financial assets held directly as deposits might be partly explained by the fact that Australia’s compulsory superannuation scheme accounts for a large share of household wealth. This is consistent with cross-country evidence that suggests higher shares of household financial wealth held in superannuation are associated with lower shares of financial assets held directly as deposits (Figure 2). At the same time, however, Australian insurers and
1 To some degree, the relatively high share of household wealth invested in housing assets might reflect the effects of geography and urbanisation on house prices (Ellis and Andrews 2001).
superannuation funds hold a relatively large share of their assets in the form of deposits. In particular, the share of Australian superannuation assets invested in deposits is more than double the median asset allocation share for a number of OECD countries (see Section 2.2). This means that Australian households’ direct
and indirect holdings of deposits are not as low as direct holdings alone would suggest.
Figure 2: Household Balance Sheet Composition – 2007
Share of financial assets
Q Q Q Q Q Q Q Q Q Q Q Q Q Q Q 0 10 20 30 40 50 60
0 10 20 30 40 50 60 70
Australia
Direct deposit holdings (%)
S up er an nu at io n a nd l if e i ns ur an ce ( % ) US Sweden Canada Denmark Netherlands Switzerland UK Italy France Norway Finland Germany South Korea Japan
Source: OECD
In this environment, the increased demand for credit was accommodated through wholesale funding, and much of this funding was obtained offshore. A large share of financial inflows to Australia were intermediated by the banking sector, because the demand for credit was largely from the household sector that did not have direct access to these markets (Debelle 2013a). Regular offshore debt issuance by the banks to support housing lending also reinforced their advantage in issuing more cheaply, and for longer tenors, than was possible for corporations that issued only infrequently.
The trend toward offshore wholesale funding allowed banks to diversify their funding sources and was supported by the ability of banks to effectively hedge
foreign-currency risk. About three-quarters of funds sourced from offshore are denominated in foreign currencies, and the vast bulk of these funds are hedged back into Australian dollars.2 This activity was complemented by natural
counterparties for the other side of the transaction. In particular, offshore issuers wanted to access Australian investors by issuing Australian dollar-denominated bonds in Australia and hedging this back into foreign currency (Ryan 2007). Furthermore, a sizeable proportion of Australia’s superannuation assets are invested in foreign currency-denominated assets, some of which are hedged back into Australian dollars.
Changes in regulations and a shift in emphasis away from ‘asset’ towards ‘liability’ management also encouraged the shift towards wholesale funding from the late 1970s to the late 1980s (Battelino and McMillan 1989). For example, banks started to intermediate a greater share of lending through bill acceptances rather than through deposits, partly to avoid the Statutory Reserve Deposit requirement. In the 2000s, banks’ use of wholesale funding was supported by financial innovation, particularly the parcelling and redistribution of risk through RMBS that were designed, in part, to reduce the capital required to support a given amount of credit (see below).
The size, composition and behaviour of banks operating in Australia are other factors that influence the share of wholesale funding in the banking sector. In terms of size, empirical analysis generally suggests that larger banks are more likely to use wholesale funding because they are better able to overcome the fixed costs involved, particularly with securitisation programs (see, for example, Uzun and Webb (2007), Bannier and Hänsel (2008), and Panetta and Pozzolo (2010)). Given that each of the major Australian banks was among the largest 50 banks globally in 2013, according to both total assets and Tier 1 capital, this evidence is consistent with their relatively high share of wholesale funding.
2 Banks hedge foreign currency-denominated funding to protect themselves from the risk that a depreciation of the Australian dollar will increase the Australian dollar value of their foreign currency-denominated debt and reduce the value of their equity. This is encouraged through APRA’s prudential standards. For larger amounts of wholesale debt, it is also normal practice for banks to match the maturity of their hedges to their borrowings. For a broader discussion of foreign currency hedging by Australian entities see Rush, Sadeghian and Wright (2013).
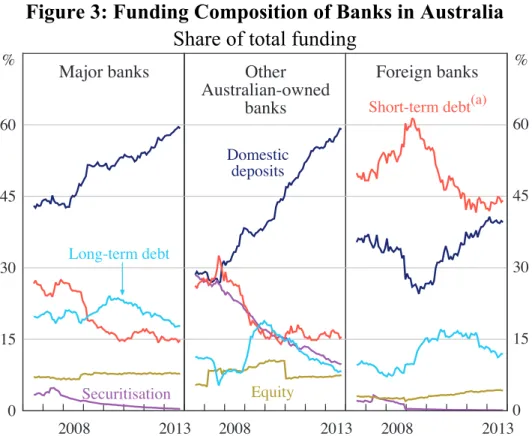
In terms of composition, while foreign-owned institutions generally have considerably more wholesale debt than domestic banks, it is not clear from the available data whether they represent a larger share of banking system assets in Australia than in other countries (Figure 3).3 Having said that, differences in the
relative importance of foreign-owned banks are likely to explain some of the divergence in funding patterns between Australia and countries such as Canada and Japan where there is very little foreign bank activity. Furthermore, the nationality of foreign banks operating in Australia might have some role to play, because banks from different home countries use different expansion and funding patterns (CGFS 2010).
Figure 3: Funding Composition of Banks in Australia
Share of total funding
0 15 30 45 60
0 15 30 45 60
Major banks Other
Australian-owned banks
Foreign banks % %
Short-term debt(a)
Equity Securitisation
Domestic deposits
Long-term debt
2013 2008
2013 2008
2013 2008
Notes: Adjusted for movements in foreign exchange rates; not adjusted for mergers and changes in capital
structures
(a) Includes deposits and intragroup funding for non-residents Sources: APRA; authors’ calculations
3 Foreign banks include both branches and subsidiaries. Note that branches do not have to hold any equity in Australia.
In terms of behaviour, both larger and smaller Australian institutions made increasing use of securitisation before the onset of the global financial crisis. The fall in the cost of securitisation, relative to other potential funding sources, over the late 1990s and early 2000s was sufficient to more than offset the fixed costs of issuance.4 This allowed some smaller, non-deposit-taking lenders to compete
despite having neither balance sheets nor capital bases from which to fund their lending in the traditional sense. They also had the advantage of low costs given that they were unencumbered by large branch networks. The use of RMBS funding allowed the market share of these wholesale lenders to rise to over 10 per cent of housing credit from less than 2 per cent in the late 1990s, while the share of housing lending financed through securitisation rose from about 5 per cent in the mid 1990s to over 20 per cent by mid 2007.
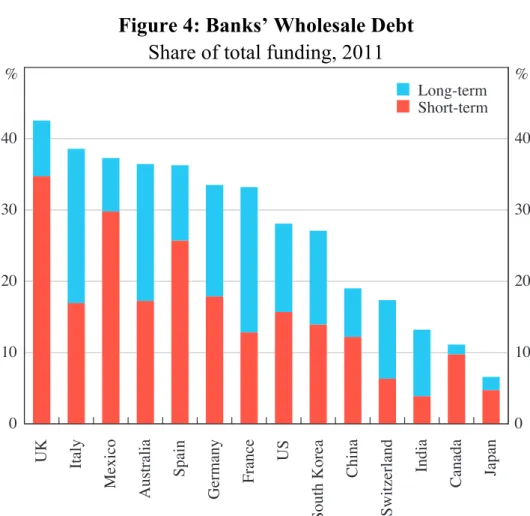
From a risk management and stability perspective, the maturity profile of wholesale debt is an important consideration. Relative to other banking systems, a large share of Australian banks’ wholesale debt is issued with an original maturity of more than one year; this helps to reduce liquidity risks by reducing the rate at which debt rolls over (Figure 4).5 For wholesale debt issued with original
maturities of less than a year, Australian banks make relatively little use of repo funding, which tends to be very short term, and the maturity of Australian banks’ offshore money market funding is generally longer than it is for many of their overseas counterparts.6
4 The use of RMBS was also facilitated by improvements in technology, the fall in nominal interest rates (which made banks’ deposit funding less of an advantage) and, from an investor’s perspective, a relative lack of other high-quality fixed income securities.
5 Within wholesale debt issued with maturities of longer than one year, Australian banks have a similar maturity profile to their overseas counterparts.
6 Some Australian banks use a small proportion of (offshore) short-term wholesale debt to exploit arbitrage opportunities; some offshore short-term assets are funded through offshore short-term liabilities to earn additional interest with no maturity mismatch involved.
Figure 4: Banks’ Wholesale Debt
Share of total funding, 2011
UK Italy
Mexico
Australia
Spain
Germany France
US
South Korea
China
Switzerland
India
Canada Japan 0
10 20 30 40
0 10 20 30 40 Q Long-term Q Short-term
% %
Note: Excludes net repo financing
Sources: BIS; authors’ calculations
Wholesale funding can also help to reduce liquidity risks by diversifying the investor base on the liability side of banks’ balance sheets. It also allows banks to react more quickly to unexpected increases in loan demand on the asset side of their balance sheets. More generally, the relative transparency of the Australian banking system’s activities and its strength – proxied by the quality of its assets, credit ratings, etc – would support a higher share of wholesale funding.
2.2 Recent Influences and Implications
Following the onset of the global financial crisis in 2007, there has been a marked increase in the focus on deposit funding by regulators, ratings agencies, investors, and banks’ own management (Edey 2010). This has been driven by the perceived stability of deposit funding relative to short-term wholesale debt and has resulted in the share of deposit funding in Australia rising to be closer to that in many other countries. At the individual bank level, increasing deposit funding is a way to
reduce liquidity risks. For the banking system as a whole, it can be argued that more deposit funding increases the resilience of the supply of credit to shocks in wholesale funding markets. To the extent that these shifts are related to Basel III and other regulatory changes, they are likely to persist. The increased focus on deposit funding has also been driven by the rapid increase in the cost of some other sources of funding; for example, spreads on RMBS rose to unprofitable levels during the financial crisis.
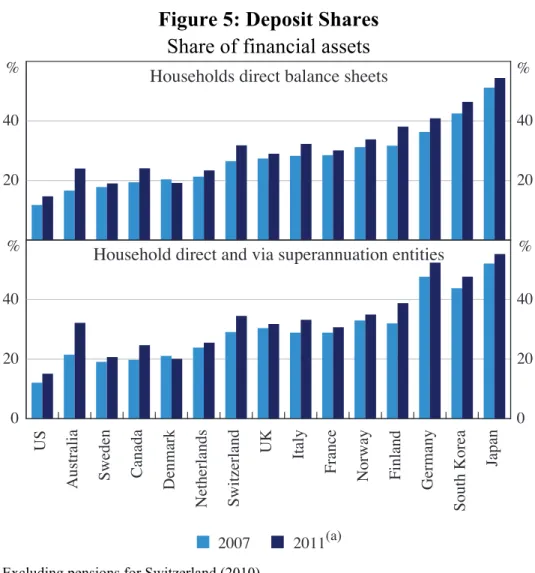
At the same time as the demand for deposit funding from banks has increased, there has been a significant increase in the supply of deposits from Australian households and businesses. All else equal, this has moderated the increase in the cost of deposit funding that would have otherwise occurred. The increase in the supply of deposits has been particularly marked from superannuation funds; the consolidated position of the Australian household sector has gone from investing a relatively low share of its financial assets in deposits relative to other OECD countries to having a roughly comparable share (Figure 5). A notable aspect of this increase has been the role of self-managed superannuation funds. These funds invest a significantly higher share of their assets in deposits, and other interest-bearing securities, than other superannuation funds, and have become increasingly important over the past decade.
Changes in the nature of capital inflows to Australia are also likely to be influencing the banking system’s relative use of deposit funding.7 In recent years, a
greater share of capital inflows to Australia have come from resource companies either borrowing in wholesale markets or through retained earnings, rather than the banking sector (Debelle 2013a). This implies that these companies have had a lower demand for credit intermediated by the Australian banking sector for a given level of activity. At the same time, the amount of deposits ultimately available to the banking system is not likely to have changed much because the proceeds of the corporations’ wholesale debt issues still circulate in the financial system. In combination with the fall in demand by Australian banks for offshore wholesale funding, this implies an increase in the deposit share of funding, which may have moderated some of the increase in the price of deposits relative to wholesale debt.
7 Changes in the willingness of the Australian banking system to use different types of funding will also influence the nature of capital flows to Australia.
Figure 5: Deposit Shares
Share of financial assets
Households direct balance sheets %
20 40
20 40
US
Australia Sweden Canada Denmark
Netherlands Switzerland
UK Italy
France
Norway Finland
Germany
South Korea
Japan
0 20 40
0 20 40 Household direct and via superannuation entities
%
% %
Q 2007 Q 2011(a)
Note: (a) Excluding pensions for Switzerland (2010)
Source: OECD
2.2.1 Implications for risks
Changes in the composition of funding will alter the nature of liquidity risk in the banking sector. How this occurs will depend on a number of factors, including the relative maturity of deposits versus wholesale debt and how banks respond to changes in liquidity risk.
Following the experience of the financial crisis, it is generally argued that deposits are stickier than short-term wholesale debt given switching costs and the presence of (capped) deposit guarantees or depositor preference arrangements. In Australia, for example, while most deposits are ‘at call’, they generally have quite long maturities when depositors’ actual behaviour is considered.8 Furthermore, term
deposits have been responsible for a disproportionate share of the growth in deposits over recent years and now comprise about a quarter of total bank funding. These accounts have an average initial maturity of about six months, and typically roll over a number of times before being withdrawn. In contrast, the average residual maturity of banks’ short-term wholesale funding is somewhere between two and three months.
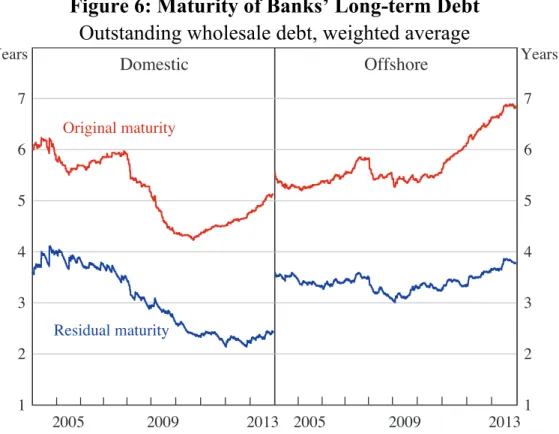
However, the advantages for liquidity of issuing longer-maturity wholesale debt and ensuring a maturity profile that does not have a large share of liabilities maturing in a short period of time should not be overlooked. The average maturity of Australian banks’ long-term wholesale debt is over five years at issuance. Even though the weighted average maturity of domestic debt at issuance has shortened by about a year since the onset of the financial crisis, it remains at over five years, and the weighted average maturity of offshore wholesale debt has increased to just under seven years, driven by the issuance of relatively long-term covered bonds (Figure 6).9
Furthermore, any reduction in liquidity risk arising from a greater share of deposit funding would be illusory if it were to come from investors merely substituting wholesale debt for wholesale deposits. Likewise, an increase in competition for deposits could make them less stable from an individual banks’ perspective by encouraging depositors to be more price-sensitive.
9 A number of factors underpinned the decline in the residual maturity of domestic long-term debt. These include the low level of new issuance combined with the shorter maturity of debt issued during the financial crisis.
Figure 6: Maturity of Banks’ Long-term Debt
Outstanding wholesale debt, weighted average
l l l l l l l l l
1 2 3 4 5 6 7
l l l l l l l l l 1
2 3 4 5 6 7 2013 Original maturity Years Domestic Years Offshore Residual maturity 2009 2013 2009 2005 2005
Sources: Bloomberg; UBS AG, Australia Branch; authors’ calculations
The liquidity-risk advantages of increasing the share of deposit funding could also be offset to some extent if banks were to increase their credit or market risk exposures to boost their returns, given higher funding costs associated with a switch to funding from sources with lower liquidity risk (discussed below).10 This
is more likely to happen if there is less market discipline on banks’ risk-taking because there is less monitoring by investors holding banks’ short-term debt (Calomiris and Kahn 1991), although Eisenbach (2013) suggests that this disciplining role of short-term wholesale debt is too weak during normal market conditions and then excessive during periods of market disruption. The incentives for short-term debt holders to monitor banks are likely to increase with the share of funding that is secured against balance sheet assets, for example through covered bond issuance (Gai et al 2013). Following the crisis, there has been some shift in investors’ preferences towards secured funding, although it has been relatively muted in Australia compared with the shift for euro area banks (CGFS 2013).
10 Recent history provides examples of banks with high shares of deposit funding taking on significant levels of credit and market risk to generate returns. The heavy use of deposits relative to wholesale debt can also mean that losses are concentrated domestically following any failure, rather than being spread across sophisticated investors around the world.
More generally, changes in the nature of capital flows which contribute to an increase in the deposit share of funding might alter the aggregate amount of liquidity risk in the economy. In particular, it is possible that the corporate sector might not be as cognisant of, or well placed to undertake, liquidity risk management as the banking sector. The ability of authorities to detect and react to the build-up or realisation of these risks also differs according to which sectors have undertaken these activities.
2.2.2 Implications for funding costs
The increased emphasis on deposit funding has, and will continue to have, important implications for bank funding costs. In particular, banks’ funding costs are a function of the composition of funding, the cost of the various funding sources, and hedging strategies. One of the most obvious effects of the increased demand for deposit funding, particularly term deposit funding, and the reduction in the use of short-term wholesale debt by Australian banks, has been an increase in the cost of deposits relative to those of wholesale funding (Figure 7; Edey 2010). This has contributed to an increase in banks’ overall funding costs relative to the cash rate (Robertson and Rush 2013).11
The shift towards term deposits, which are generally repriced less frequently, may have marginally slowed the speed with which changes in the pricing of funding instruments flow through to overall funding costs. The transmission of monetary policy to changes in bank funding costs has, however, remained little changed (see Section 3.2.1 for more discussion).
11 All else equal, by reducing banks’ liquidity risk, this compositional change should have reduced the cost of wholesale funding and/or the amount of liquid assets that need to be held.
Figure 7: Major Banks’ Pricing of Term Deposits
-100 0 100 200
-100 0 100 200
Bps 6-month spreads to OIS Bps
Bank bonds 3-year spreads to CGS
Bank bills
2010 2013
Term deposit ‘specials’
2010 2013 2007
Sources: Bloomberg; RBA; Thomson Reuters; UBS AG, Australia Branch 2.2.3 Implications for the economy
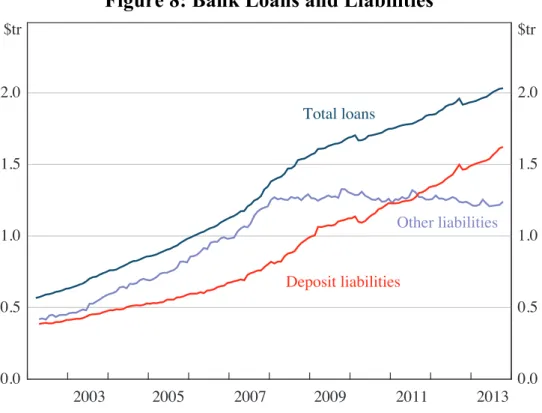
Over recent years, Australian banks have been funding new loans through new deposits, with little net issuance of wholesale debt (Figure 8; RBA 2013). This has resulted in a debate about whether deposit growth will place any form of constraint on lending growth should the rate of credit growth increase or domestic savings decrease (Coffey 2012).
The savings rate is the result of decisions being made by individuals responding to macroeconomic factors such as the level of interest rates. The relationship between the savings rate, deposit growth and credit growth depends on the distribution of individuals in the economy and their preferences for different investment and saving vehicles. These relationships will also depend on whether the demand for credit is satisfied directly from the financial markets or intermediated through the banking system. As such, the relationships between the interest rates on deposits, the savings rate, preferences regarding different savings instruments, and the growth rates of deposits and credit are complex. For example, a savings rate of zero can be consistent with the banking system being fully funded by deposits given that the savings rate is calculated from the income and savings of both savers
and dis-savers. The relationships are even more complicated in an open economy setting.12
Figure 8: Bank Loans and Liabilities
0.0 0.5 1.0 1.5 2.0
0.0 0.5 1.0 1.5 2.0
2013 Deposit liabilities
$tr $tr
Other liabilities Total loans
2011 2009
2007 2005
2003
Sources: APRA; Standard & Poor’s; authors’ calculations
One way to think about these relationships is to consider how the share of deposit funding might be affected by changes in behaviour of different agents, including the official, authorised deposit-taking institution (ADI) and private non-ADI (for example, household) sectors.13 For example:
12 In particular, while capital inflows do not alter the amount of domestic currency in circulation, they could alter the supply of different types of assets if the portfolio preferences of non-resident purchasers of Australian dollars differ from those of the resident sellers of these assets.
13 The ‘Formation Tables’ framework was used extensively in the 1970s and 1980s to monitor changes in private non-bank Australian dollar-denominated deposits and the money supply, and to understand how these were affected by the activities of the Government, central bank and private banks (Valentine 1984). These tables provide an accounting-based reconciliation of these entities’ balance sheets. However, care must be taken with the interpretation of formation tables because they do not provide insights into the causes of money or credit growth. They also became less useful following the floating of the Australian dollar and as a growing body of literature cast doubt over the reliability of the relationship between monetary aggregates and real economic activity. New theoretical models place more emphasis on the information content of credit, rather than money, for economic activity.
• If the Federal Government funds a budget deficit by issuing Commonwealth
Government securities (CGS), there will be no effect on the value of deposits if those securities are purchased by the private non-ADI sector. The initial decline in the deposits held by the non-ADI sector (upon purchase of CGS) will be offset by a subsequent increase in this sector’s deposits as the Government spends the proceeds of the CGS sale. In contrast, if the CGS are purchased by the ADI sector (hereafter banks), the private non-banking sector’s holdings of cash and deposits may increase. For example, if banks purchase CGS using their holdings of cash, these Australian dollars re-enter the economy in the hands of the non-banking sector as the Government uses the funds obtained from the sale of CGS. The end result is that the non-banking sector’s balance sheet has expanded while the banking sector’s balance sheet has changed its composition and, depending on the investment preferences of households, potentially expanded.
• Changes in the banking sector’s asset allocation can also affect total deposits in
the economy. Consider, for example, a desire by the banking sector to increase its holdings of CGS through purchases from the household sector using cash. The household sector will place a significant share of these proceeds back with the banks as deposits. The end result of this change in preferences is that the banking sector will have a larger balance sheet (although no more credit has been provided to the private sector) with a higher share of funding sourced from deposits. Meanwhile, the household sector’s balance sheet has simply changed its composition. This process will be moderated by falls in the yields on CGS relative to the deposit rates banks need to pay to ensure that households are willing to sell their CGS and invest the proceeds in deposits.
• The provision of credit by banks to the non-bank sector will ultimately generate
an increase in the supply of funds back to the banking sector.14 Whether these
14 This discussion focuses on how changes in deposits facilitate bank lending rather than on banks ‘funding’ loans through endogenously creating deposits on their own balance sheet. The latter situation of a bank creating both loans and deposits simultaneously is a possibility in the case where the bank has adequate liquidity and capital. Furthermore, increasing the amount of loans and deposits simultaneously needs to be facilitated by offering the non-bank sector increasingly attractive rates on deposits relative to loans, reducing the bank’s profitability until further expansion is no longer attractive and curtailing the demand for credit.
funds are returned in the form of deposits or some other liability will be influenced by the returns on different liabilities of the banking sector and investors’ preferences towards different types of financial instruments. An increase in interest rates on deposits relative to certificates of deposit will, for example, result in holders of certificates of deposit switching to deposits. Such a divergence in interest rates on deposits and wholesale debt of equivalent maturities has been apparent in recent years (Figure 7).15
In contrast, changes in investors’ preferences between deposits and non-banking sector assets do not necessarily influence the aggregate value of deposits. Households purchasing existing shares using their deposits, for example, will not reduce the aggregate value of deposits if the proceeds of these purchases are also held as deposits by the original owner of these equities.
How the relationship between deposit and credit growth evolves over the short to medium term is difficult to predict. There is, however, no reason to think that any potential adjustment to either a rise in the demand for credit or a reduction in the supply of deposits would be disruptive from a macroeconomic perspective. In particular, the relative price of deposits and banks’ wholesale debt is likely to adjust, as it has over recent years, in response to changes in the desirability of different funding sources. Furthermore, in responding to either unexpectedly high credit growth or lower deposit growth, financial institutions can partially moderate any gap between their budgeted credit and deposit growth rates by altering the interest rates on their lending, deposits and wholesale debt. More broadly, financial institutions may re-evaluate their reluctance to use additional wholesale funding in an environment where demand for credit picks up or the supply of deposit funding slows, given that this is likely to be associated with improved perceptions about the strength of the macroeconomy and financial institutions.
Another implication of the recent increase in the deposit share of funding for some institutions is that the competitive dynamics in lending markets could have become more cyclical. In periods when the volatility of financial markets is relatively low,
15This divergence in the deposit and wholesale funding rates of the major banks is also influenced by competition for deposits from banks with lower credit ratings. That is, in equating the marginal cost of deposits and (lower-rated) wholesale debt, these institutions can increase the cost of deposits for other, higher-rated, institutions.
wholesale funding costs typically fall relative to deposit prices. This provides a competitive advantage to institutions that rely on wholesale funding, rather than an expensive deposit base, and increases the number of institutions in the lending business. However, when wholesale funding conditions become more volatile, the balance of competition will swing the other way in favour of institutions with large deposit bases. Recent experience suggests, however, that the advantage of a larger transaction deposit base in times of financial market volatility may have been mitigated somewhat because the growth in deposits has been in relatively expensive forms, such as term deposits.
In the very long run, there is also potential for there to be more intermediation of savings and lending through financial markets or superannuation funds (Davis 2013). This might, for example, arise if there are further increases in the relative cost of deposits versus wholesale debt or through growth in the size of superannuation assets relative to the rest of the financial system. How intermediation evolves will be a function of many factors, including: the value depositors place on features specific to deposits, such as their low risk due to deposit insurance, access to the payments system etc; the type of superannuation funds that experience the most rapid asset growth, given differences in their asset allocations; and whether some superannuation funds are willing to take on more of the risks traditionally borne by the banking sector by becoming the generator of assets rather than the purchaser.
3.
Lending Behaviour
The mortgage markets of most advanced economies can be characterised by the existence of a small number of key products. Lea (2010) finds that the use of long-term fixed-rate loans is most prevalent in the United States and Denmark, although the prepayment features offered on loans in each of these two countries differ substantially. Medium-term fixed-rate loans, often with rollover options and prepayment penalties, are more common in Canada, Germany and Switzerland. Australia is one of a number of countries with a mortgage market dominated by variable rates. Variable-rate loans featuring an interest rate ‘cap’ are common in Canada, while ‘tracker’ loans – where the variable rate is set as a spread to an independent benchmark rate – have been popular with borrowers in Ireland, Spain
and the United Kingdom. In contrast, Australian variable mortgage rates are set at the lender’s discretion and repayment features are flexible compared with other variable-rate mortgage products.
The typical housing loan in Australia is a prime, full-documentation loan with a 25 to 30 year contractual maturity. Historically, fixed-rate loans have tended to account for less than one-fifth of new housing loans, and typically have a fixed-rate period of less than five years. For businesses, variable interest-fixed-rate loans – whether they reference the cash rate or some other benchmark such as the bank bill swap rate – also account for a majority (over 70 per cent) of business lending. Between 1998 and the onset of the financial crisis, variable interest rates tended to move in line with changes in the cash rate. As Debelle (2004) points out, the Australian experience was not unusual; variable housing indicator rates often moved one-for-one with changes in policy rates in other countries where variable-rate mortgages were prevalent. Since the onset of the financial crisis, there has been a marked increase in the spread between lending and policy rates, in Australia and elsewhere, largely reflecting an increase in funding costs relative to the policy rate.
3.1 Historical Drivers
The popularity of variable-rate mortgages set at the lender’s discretion in Australia reflects a number of historical developments. From a borrower’s perspective, variable-rate mortgages are attractive because they offer greater flexibility in making prepayments than fixed-rate loans (Ellis 2006; Lea 2010). This is a particularly appealing feature for many owner-occupier borrowers because interest payments on owner-occupied mortgages are not tax deductible in Australia as they are in a number of other countries (Ellis 2006, 2010; Daniel 2008). Consequently, when interest rates decline, households may take the opportunity to make additional prepayments on their variable-rate loan (Debelle 2004).16
16 This means that, while Australian households bear more interest rate risk on their mortgage debt compared to households in other countries where fixed-rate loans are more common, this risk is somewhat offset by the greater prepayment flexibility that exists in Australian housing loans.
Lenders may view the prepayment flexibility of variable-rate loans favourably because the ability to prepay enables households to build up a repayment buffer for more difficult times, potentially reducing arrears rates. Australian lenders have often competed for new loans by expanding the prepayment options available to borrowers, such as offering offset accounts and redraw facilities. Furthermore, as most loans are funded from a variety of sources, the ability to adjust variable lending rates at their discretion can assist lenders in maintaining their profitability in the short term by passing on changes in funding costs to borrowers as they occur.
In the early to mid 1990s, a marked increase in competitive pressures, alongside a reduction in risk premia, drove the spread between household mortgage indicator rates and the cash rate down by around 250 basis points (Broadbent 2008). Similar forces also influenced business lending rates over this period. The strong correlation between the advertised indicator lending rates and the cash rate between the late 1990s and 2007 reflects the fact that the cash rate was the key driver of changes in domestic funding costs over this period, and debt funding costs largely tracked movements in the cash rate (Robertson and Rush 2013).
Despite the relative stability of the spread between indicator rates and the cash rate, the spread between actual variable rates paid and the cash rate slowly declined over the decade before the start of the global financial crisis. Small business borrowers experienced a marked decline in spreads as a result of a shift towards greater collateralisation of loans, predominantly secured against residential property, and an increase in competition (RBA 2011).
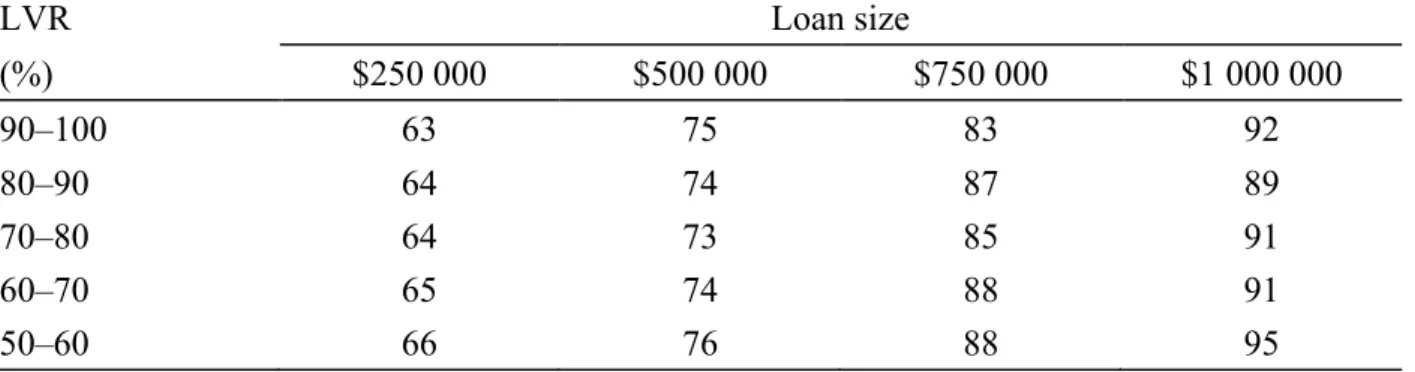
The spread between actual borrowing rates paid by households and the cash rate fell because mortgage discounts became more widespread. Initially, these discounts were offered to high-value customers – typically low-risk customers with high and stable incomes and large loans. The discount reflected their lower risk of default and greater long-term potential profitability to the bank. Over time, lenders have increasingly tried to differentiate between the relative riskiness and potential profitability of different borrowers. This has included, for example, competing for new borrowers with discounts based on both loan size and the loan-to-valuation
ratio (LVR) (Table 2).17 From the lender’s perspective it is advantageous to
compete for new borrowers with discounts because it allows the lender to offer attractive terms to potential new borrowers, without affecting the profitability of outstanding lending. As a result, the effective spread to the cash rate paid by borrowers has declined over the past twenty years.
Table 2: Discounts on Major Banks’ Securitised Residential Mortgages
New loans originated in 2012, basis points
LVR Loan size
(%) $250 000 $500 000 $750 000 $1 000 000
90–100 63 75 83 92
80–90 64 74 87 89
70–80 64 73 85 91
60–70 65 74 88 91
50–60 66 76 88 95
Note: Spread to the major banks’ advertised standard variable indicator rate
Sources: Perpetual; authors’ calculations
3.2 Recent Influences and Implications 3.2.1 Role of the cash rate
Since the onset of the financial crisis, the spread between indicator lending rates and the cash rate has increased across all loan types (Figure 9; Robertson and Rush 2013). This has predominantly reflected an increase in funding costs – particularly the higher costs of deposits and long-term wholesale debt – although increases in risk premia for individual borrowers (see Section 3.2.2), and the increase in liquid assets as a share of banks’ balance sheets, have also contributed.
17 The use of discounts in Australia has been broadly similar to their use in the Canadian market, where borrowers with more equity have also tended to receive larger discounts (Allen, Clark and Houde 2011).
Figure 9: Funding Costs and Variable Lending Rates
Spread to cash rate
-50 0 50 100 150 200
-50 0 50 100 150 200
2013 Bps Bps
Large business(a)
Small business Household and funding Business
Housing
Total outstanding funding costs
2011 2013
2009 2011 2009
2007
Notes: Spreads on outstanding loans
(a) Loans greater than $2 million; includes bill lending Sources: ABS; APRA; Perpetual; RBA; UBS AG, Australia Branch
Despite this, indicator lending rates remain strongly anchored to changes in the cash rate (Figure 10). This has meant that changes in the cash rate are transmitted quickly, and broadly uniformly, to indebted households. The RBA Board has noted that it takes developments in funding costs into account when it determines the appropriate setting of the cash rate and can respond as needed over time (Lowe 2012). This ensures that the structure of interest rates faced by households and businesses is consistent with the desired stance of monetary policy.
Figure 10: Changes in Lending Rates
Average of the major banks’ standard variable rates
-100 0 100 -100 0 100 -200 -100 0 100
-200 -100 0 100 -200
-100 0 100
-100 0 100
C as h r at e ( B p s) 1990–1992 1998–2007 Post-2007 1993–1997
Housing indicator rate (Bps)
C as h r at e ( B p s)
Note: Size of dots represents the frequency with which a change occurred
Sources: RBA; authors’ calculations 3.2.2 Pricing of risk
In setting lending rates, banks incorporate a risk premium designed to cover the credit risks associated with different types of loans. For example, Matić, Gorajek and Stewart (2012) attribute the pricing differential between small business loans secured with residential property and housing mortgages to the higher expected losses on small business loans and their higher capital requirements (Figure 11). Fabbro and Hack (2011) find that only a small portion of the increase in lending rates since the financial crisis can be attributed to a reassessment of risk, with most of the increase reflecting the increase in funding costs. However, there is evidence to suggest that banks are paying more attention to the pricing of risk.
Figure 11: Residentially Secured Small Business Variable Lending Rates
Spread to housing rate
0 50 100 150 200
0 50 100 150 200
Indicator rate
2013 Bps Bps
Average outstanding rate
2009 2005
2001 Sources: ABS; APRA; Perpetual; RBA
In particular, there has been a noticeable increase in the range of spreads charged for business loans. The standard deviation of spreads across lenders’ business loan portfolios has increased to a level similar to that of the late 1990s (Figure 12). This trend is similar across both small and large business lending. The increase in the range of spreads is likely to reflect an increase in the sensitivity of banks to the perceived risks involved in different types of business lending. To a lesser extent, this increased range may also reflect cyclical factors, as banks tend to take a more conservative approach to lending when business conditions are less favourable. A number of banks have reduced their lending to the business sector since the onset of the financial crisis (RBA 2011). This has been associated with a reduction in competition for potentially higher-risk business loans over recent years.
Figure 12: Small Business Interest Rates
Spread to cash rate on outstanding variable-rate loans
Bps
Standard deviation 250
500
250 500
100 140 180
100 140 180 Weighted-average interest rate
Distribution(a)
Bps
Bps Bps
2013 2009
2005 2001
1997
Note: (a) The shaded range covers 50 per cent of the value of lending
Sources: APRA; Perpetual; RBA; authors’ calculations
In line with the renewed focus on the pricing of risk, lenders appear to have begun to be more targeted with their offers of discounts on new loans. Consequently, while there has been little change to the size of the average discount offered to new household borrowers over recent years, the nature of discounts has continued to evolve (Figure 13). In particular, a number of lenders have started to place more emphasis in their advertising on products that offer larger discounts to borrowers with more equity (lower LVRs) in their property at origination. This is because these borrowers tend to have lower arrears rates and, if the arrears progress to default, smaller losses for the bank. In addition, there have been some attempts by lenders to link loan discounts to the age of the loan, usually through the use of loyalty discounts that become effective after a number of years. These discounts encourage price-sensitive borrowers to remain with their existing lender, and discourage mortgage churn, which can be costly for lenders.
Figure 13: Discounts on New Home Loans
2012
Borrowers receiving a discount
Bps
Discount to the major banks’ indicator rate
25 50 75
25 50 75
0 30 60 90
0 30 60 90 Bps
Share of borrowers paying less than the banks’ indicator rate %
%
All borrowers
By number
By value
2008 2004
2000
Notes: Based on securitised prime full-doc loans; spread to advertised standard variable rate
Sources: Perpetual; authors’ calculations
Despite these changes in the pricing of risk, the available evidence suggests that spreads to policy rates on Australian variable-rate mortgages remain consistent with those in many other advanced countries, notwithstanding the difficulties associated with international comparisons (Figure 14).18 Lea (2010) reports similar
results using benchmark rates as the reference rate.
18 Even comparisons of similar products are difficult due to the variation in the features on offer. The fact that many institutions offer customers discounts to their standard rates, and that these discounts are inherently difficult to track over time, further complicates any analysis.
Figure 14: Interest Spreads on Variable-rate Mortgages
New loans, spread to policy rate, six-month average
0 100 200 300 400
0 100 200 300 400
2013 US(c)
Bps
UK(SVR)
New Zealand(a)
UK(tracker)
Canada
Ireland(d)
Australia(discount)(b)
2009 2005
2001 1997
Bps
Australia(SVR)
Notes: SVR denotes standard variable rate
(a) First mortgage interest rate on housing loans to first time customers (b) Package loans only
(c) 1-year adjustable rate mortgages
(d) Floating rates and fixed rates of up to 1-year maturity
Sources: APRA; Bank of Canada; Bank of England; Board of Governors of the Federal Reserve System; Central Bank of Ireland; Federal Home Loan Mortgage Corporation; ING Canada; Perpetual; RBA; Reserve Bank of New Zealand
Changes in the pricing of risk can lead to a shift in preferences by both borrowers and lenders for different mortgage products over time. For example, Lea (2010) notes that the fall in short-term rates over recent years has led Danish borrowers to shift towards medium-term rollover fixed-rate mortgages. In contrast, Krainer (2010) observes that borrowers in the United States increased their preference for fixed-rate mortgages during 2009, largely in response to their more attractive pricing relative to variable-rate mortgages. Goggin et al (2012) note that there has been a marked shift away from banks offering tracker loans towards variable-rate loans set at the lender’s discretion in Ireland since the financial crisis. This shift may have been a response by lenders to margins on these loans that
appeared to be too narrow to accommodate the increase in funding costs, with a fall in demand from borrowers as a result.
For Australia, however, there has been little apparent change in borrower and lender preferences for mortgage products to date. Fixed-rate approvals have increased somewhat, but the rate of approvals is not unusually high by historical standards, and fixed-rate loans remain a relatively small share of outstanding lending. In addition, lenders do not appear to have adjusted their spreads on fixed-rate mortgages to make them more attractive to borrowers than variable-fixed-rate mortgages. Nevertheless, a number of lenders appear to have revised their minimum serviceability criteria, including interest rate buffers, for assessing new loan applications. The share of low-doc loans approved has also declined markedly, partly as a result of legislative changes, including the introduction of the
National Consumer Credit Protection Act 2009.
3.2.3 Liquidity and maturity transformation
Lending rates also need to compensate the bank for the liquidity risk associated with assets that have longer maturities than the liabilities that fund them. An under-appreciation of the need to price for liquidity risk was identified as a serious problem following the global financial crisis (Grant 2011). Consequently, banks have begun to place more weight on liquidity considerations in their interest rate setting decisions. This is being encouraged by regulators globally given that few banks had sophisticated models or liquidity transfer pricing mechanisms to automatically undertake this exercise before the financial crisis.
The pricing for liquidity risk should depend on effective, rather than contractual, maturities. For example, a typical 30-year variable-rate housing loan generally has an effective maturity of around 5½ years as this is when, on average, a loan is repaid by borrowers.19 In contrast, business loans typically have much shorter
effective maturities of around 3½ years, depending on the type of borrower. Consequently, the provision of a business loan involves less liquidity risk for the bank than a housing loan, and therefore the premium above funding costs to
19 This often occurs as the result of refinancing by the borrower, or when a borrower sells their existing property, repays their current loan and takes out a new loan to finance the purchase of a new property.
compensate for this risk should also be lower.20 Nevertheless, for both business
and housing loans, the relatively short effective maturities suggest that the degree of maturity transformation provided, and therefore liquidity risk borne, by banks is not as large as their contractual maturities may suggest.
While a liquidity transfer pricing mechanism may result in different business units
within a lending institution being charged different internal rates based on their provision or consumption of liquidity, this does not necessarily imply different lending rates for borrowers. In particular, how banks choose to respond to these pricing signals, the effectiveness of existing transfer pricing mechanisms and the potential reactions of their customers, will also influence the ultimate lending rates faced by borrowers.
4.
Profitability
Australian banks experienced strong profit growth in the 15 years leading up to the global financial crisis. Over this period, the profits of the major banks grew at an average rate of around 15 per cent per annum, while their post-tax return on equity also averaged about 15 per cent and their return on assets averaged around 1 per cent. Prior to the financial crisis, these rates of return were comparable to the returns of other large global banks (Figure 15).
20 A simple liquidity transfer pricing mechanism attempts to match the effective maturity of assets with the effective maturity of funding liabilities. For example, the cost of liquidity risk on a 30-year (contractual maturity) variable-rate loan with an expected maturity of 5 years funded through at-call deposits can be achieved through a two-step process. First, the bank would assume that it funds the loan with a liability with the same effective maturity, such as a 5-year fixed-rate bond. Second, this hypothetical liability is transformed into an obligation with the same liquidity risk as the actual funding liability using interest rate swap transactions. The net cost of performing these two (hypothetical) steps is the liquidity cost that should be incorporated into the lending rate.
Figure 15: Large Banks’ Return on Equity
After tax and minority interests
-10 -5 0 5 10 15 20
-10 -5 0 5 10 15 20
% %
US
Euro area
UK Canada
Australia
2013 2009
2005 2001
1997
Japan
1993
Notes: Includes six US banks, eight euro area banks, four UK banks, three Japanese banks, six Canadian banks
and four Australian banks; adjusted for significant mergers and acquisitions; reporting periods vary across jurisdictions
Sources: Bloomberg; RBA; SNL Financial; banks’ annual and interim reports
Profitability over this period was supported by strong growth in net interest income, driven by a rise in interest-earning assets associated with the strong domestic demand for credit by both households and businesses (Figure 16). This rapid increase in assets was only partially offset by a sustained contraction in net interest margins due to increased competition. The major banks’ return on assets also remained high throughout this period because they diversified their income through an expansion into wealth management services, assisted by the acquisition of wealth management companies, and steady improvements made to their operating efficiency.
Figure 16: Contribution to Change in Profit Growth
Underlying profit before tax, major banks
-40 -20 0 20 -40 -20 0 20 -20 0 20 -20 0 20 % Net interest income
%
% %
Bad and doubtful debts
Other Total 2013 2007 2001 2013 2007 2001 1995
Q Expenses
Q Non-interest income
Q NIM(a) Q Assets
Notes: From 2006 data are on an IFRS basis, prior years are on an AGAAP basis; 2009 data are adjusted for the
acquisition of St. George
(a) The NIM (net interest margin) includes a cross-product term arising from the interaction between margin compression and growth
Sources: authors’ calculations; banks’ financial reports
Improvements in efficiency prior to the financial crisis were achieved predominantly through reducing the prevalence of high-cost, low-value transaction banking services; a shift towards value-added services, such as wealth management; and a focus on a greater use of technology to streamline processing. Part of the efficiency improvements were achieved through a reduction in transactional banking branches during the 1990s (Figure 17). The reduction in branches over this period was not unique to Australia. The number of branches per capita declined in most, though not all, developed countries as banks strived to reduce operating costs and substitute electronic access for more costly branch access (RBA 1998).
Figure 17: Australian Bank Branches Major banks 0 1 2 3 4 5 6 50 100 150 200 250 300 350 2013 Branches (LHS) No Bank branches(a)
Per million inhabitants, RHS 000’s 2003 2013 2003 1993 Employees(b) (RHS, ’000s) Employees and branches
1993
Notes: Break in series due to the acquisition of St. George by Westpac and Bankwest by CBA in 2009
(a) 2013 is estimated from March 2013 data; all other periods are end of financial year (b) Total group full-time equivalent employees
Sources: ABS; APRA; authors’ calculations; banks’ financial reports
A number of banking sector analysts, as well as APRA, have noted that banks might find it increasingly difficult to maintain their existing rate of profit growth (Laker 2012). Most notably, the slowdown in credit growth – from 12½ per cent per annum in the years prior to the financial crisis, to around 4 per cent per annum since 2008 – could weigh on profit growth over the medium to long term. Lower credit growth has stemmed from a change in the borrowing behaviour of households and businesses – in part following the completion of the transition to a lower interest rate environment – and a moderate tightening of lending standards. In the short term, the effects of lower asset growth are likely to be mitigated, in part, by a stabilisation in net interest margins apparent since the onset of the financial crisis, as well as cost-cutting programs designed to increase efficiency. The major banks have renewed their focus on improving operating efficiencies with large-scale investments to upgrade their core banking systems and customer information systems. In contrast to the 1990s, however, the banks have
complemented this strategy by repositioning their branches to focus on the sale of products, rather than traditional transactional banking operations. This strategy is designed to maximise the profitability of existing customers through better access to services and increased cross-selling of products. As a consequence, there has been some increase in both staff and branch numbers over recent years.
The implementation of the Basel III framework may also affect banks’ profitability, although this is expected to be small (Littrell 2011). The requirement to hold more, and higher quality, liquid assets may lead to a decline in the average return on banks’ assets. This is the case even in Australia, where the shortfall of high quality liquid assets is complemented with the operation of a committed liquidity facility. The commitment fee on the facility has been designed to reflect the liquidity risk of eligible securities held under this facility (Debelle 2013b). At the same time though, these reforms will lead to a decline in the average risk of bank assets and the volatility of their returns. The aggregate compensation demanded by all investors – both debt and equity – should therefore be lower than otherwise in response to this reduction in risk.
5.
Conclusion
This paper examines some of the factors that shaped the Australian banking system over the 1990s and early 2000s, as well as a number of new forces that have come into play since the onset of the global financial crisis.
On the funding side, Australian banks experienced a trend decline in deposit funding from the late 1970s until the financial crisis. Deregulation and the move to low inflation allowed households to increase their leverage, while a number of institutional and bank-specific factors also contributed to a reduction in the deposit share of funding. The gap was funded by wholesale debt, with a larger share of debt sourced from offshore than was the case for other comparable banking systems. The financial crisis has led to a reassessment of the trade-off between the advantages and disadvantages of wholesale funding, particularly short-term funding, and this has contributed to a steady increase in the share of funding coming from deposits. This adjustment has contributed to the increase in funding costs, and consequently to higher lending rates relative to the cash rate over this period.