FINANCIAL STABILITY
MONITOR
JUNE 2015
A biannual update of the risks to financial stability
Financial Stability Risks Remain Moderate
Since we last assessed threats to financial stability six months ago, market volatility has risen from
historically low levels, oil prices have fallen, the U.S. dollar has strengthened, and risks in Greece
and some emerging markets have increased. Overall, financial stability risks remain moderate.
As depicted in our Financial Stability Monitor, macroeconomic, market, credit, funding and
liquidity, and contagion risks are generally in the same moderate range as six months ago. Risk
premiums are still compressed in
some markets, secondary market
liquidity in fixed income remains
fragmented, and certain activities
continue to migrate outside the
banking system.
T
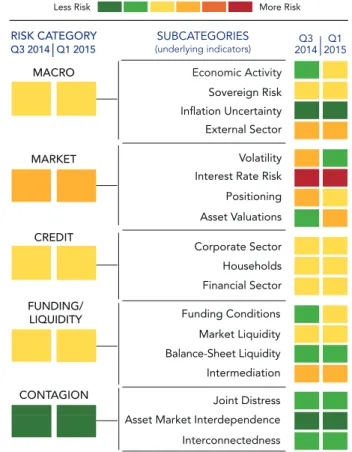
he OFR has a mandate to assess, monitor, and report on financial stability risks. A key tool for summarizing and analyzing those threats is the OFR Financial Stability Monitor (Figure 1). The monitor provides a high-level summary of five functional areas of risk — macroeconomic, market, credit, funding and liquidity, and contagion. These risk categories align with the core activities of a well-functioning financial system.1 Each risk category incorporates model-, market-, and survey-based indicators that cut across jurisdictions and industry and institutional lines. The monitor is based on approximately 60 indicators, where the measurement of risk is derived from an indicator’s position within its historical range. The monitor is organized as a heat map. The closer an indicator is to the red end of the spectrum, the more elevated the risks are relative toFigure 1: OFR Financial Stability Monitor
Financial stability risks are in the same moderate range as six months ago
Q3 2014 2015Q1 Q3 2014 Q1 2015 Funding Conditions Market Liquidity Balance-Sheet Liquidity Intermediation Corporate Sector Households Financial Sector Joint Distress Asset Market Interdependence Interconnectedness
Less Risk More Risk
Volatility Interest Rate Risk Positioning Asset Valuations Economic Activity Sovereign Risk Inflation Uncertainty External Sector SUBCATEGORIES (underlying indicators) RISK CATEGORY MACRO CONTAGION MARKET FUNDING/ LIQUIDITY CREDIT
Note: Green signifies lower financial stability risks; red signifies elevated risks. The figure represents a series of underlying indicators based on ranges prevailing from January 1, 1990 (if available) to the present. Each subcategory is constructed as a weighted average across the prevailing risk levels, with weights assigned based on the back-test performance of each of the indicators in the underlying categories. Each risk category is an equal-weighted average of the subcategories. Data are as of March 31, 2015 (or December 31, 2014, if March data are unavailable), and September 30, 2014. Some risk subcategories were revised to include indica-tors recently added to the Financial Stability Monitor.
indicator is to the green end of the spectrum, the lower the risks. Figure 1 summarizes current overall risks compared to those observed in our previous Financial Stability Monitor, approximately six months ago.
To assess the quality of the underlying indicators used in the monitor, each metric is tested for its ability to capture extreme events, identify turning points, and provide early warning signals of stress at a reasonable horizon. The indicators that performed well on these tests are weighted more heavily. Weaker performers are discarded or weighted less heavily.2
The monitor is not intended to predict the timing or severity of financial crises, but rather to identify under-lying vulnerabilities that may predispose a system to instability. In this note, we briefly analyze trends in the five risk categories in the monitor and underlying indica-tors, incorporating market intelligence. We will provide a comprehensive analysis of financial stability risks in our annual financial stability report at the end of 2015. Since our previous assessment of the risks to the financial system (see 2014 Annual Report), underlying conditions have changed in several respects. Financial and economic risks have further decoupled, with financial risk-taking occurring against the backdrop of a tepid growth recovery. Meanwhile, global monetary policies and economic growth continue to diverge. Central banks in some advanced economies, led by the European Central Bank and the Bank of Japan, are conducting highly expansionary monetary policies, while in the United States, the Federal Reserve is closer to embarking on a tightening cycle.
At the same time, volatility has increased from histori-cally low levels, oil prices are sharply lower, the U.S. dollar has strengthened, and certain foreign vulnerabilities have increased — in particular, intensified government financing risks in Greece and weakening economic funda-mentals in key emerging markets. After a lengthy period of unusually low yields, long-term government bond yields in advanced economies have risen abruptly since April. The speed and volatility of the correction have been significant, demonstrating the fragility of market liquidity and the vulnerability of markets to shocks during periods of low volatility and extended bond duration.
Other conditions, however, have changed little. Market sentiment remains buoyant, with increased appetite for risk and the search for yield continuing to stretch some asset valuations. Market liquidity is still fragmented in fixed-income markets. Meanwhile, some activities continue to migrate outside the banking system due to financial innovation and the avoidance of regulation.
Analysis of the Results
The main takeaway from our monitor is that overall risks to financial stability remain at a medium level. Many of the risks that were present at the time of our last assess-ment remain relevant, while some have diminished. Key highlights are as follows:
Although the global economy continues to recover gradually and deflation risks have abated, overall macroeconomic risks remain moderate. Much of the weakness in the macroeconomic risk category — which measures potential financial stability vulnerabilities from macroeconomic channels such as growth, inflation, fiscal vulnerabilities, and economic confidence — reflects external developments. Greece’s government financing has become severely strained and bond prices reflect an increasing probability of government default, with poten-tial spillover effects to other euro area markets (Figure 2). Meanwhile, slowing growth and current account imbal-ances remain a concern in some large emerging market economies. Diminished foreign exchange reserves, geopolitical tensions, and volatile oil prices may exacer-bate those vulnerabilities, especially among oil exporters.
Market risk — the risk of outsized losses as a result of adverse movements in asset prices — is also in a medium range. This assessment reflects still-elevated exposure to interest rate risk among bond portfolios and bank deposits, as well as highly compressed risk premiums
Figure 2: 10-year Bond Spreads over German Bonds (basis points)
Renewed Greek market pressures
0 300 600 900 1,200 1,500 0 100 200 300 400 500 Jun
2014 2014Sep 2014Dec 2015Mar 2015Jun
Italian Govt
Spanish Govt
Portuguese Govt
Greek Govt
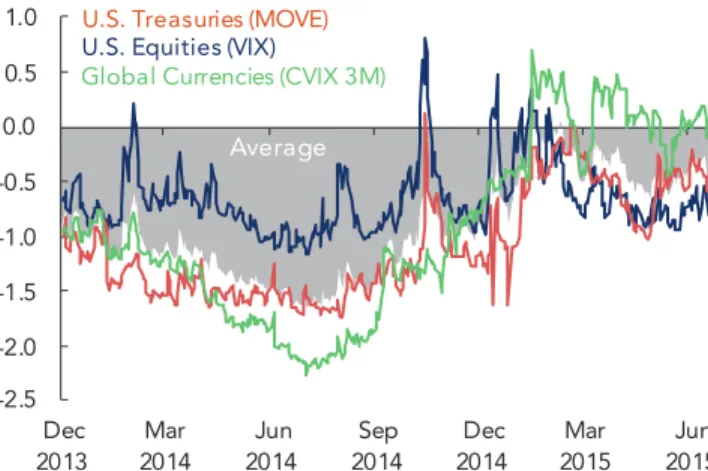
in some asset classes, notably U.S. equities and Treasuries. Amid divergent monetary policies and continued foreign central bank asset purchase programs, U.S. markets may be subject to large cross-border capital inflows, leading to further pressure on asset valuations. Overall investor posi-tioning is less extended compared with six months ago, with the exception of bond duration (Figure 3). After years of being largely depressed, volatility across key asset classes has approached or breached long-term average levels (Figure 4). Although low volatility previously contributed to excessive risk-taking, the recent increase in volatility has not been accompanied by a proportionate decline in risk-taking.
Credit risk indicators suggest some caution is warranted. U.S. nonfinancial corporate debt markets remain a particular concern because of relaxed lending standards, lower credit quality, higher debt levels, and thinner cushions to counteract shocks. These characteris-tics are consistent with the mature phase of credit cycles. More recently, the deterioration of some corporate credit fundamentals has paused, but the ratio of U.S. nonfinan-cial business debt to GDP is elevated and continues to rise (Figure 5). Corporate leveraging has been more rapid in emerging markets since the financial crisis, which together with increased macroeconomic vulnerabilities, could lead to increased losses for creditors in the United States and elsewhere. Meanwhile, U.S. banks have built significant buffers since the crisis, although overseas banks, particularly in the euro area, show unresolved structural weaknesses and have been slower to address
Figure 3: 10-Year U.S. Treasury Term Premium (percent) and U.S. Bond Duration (years)
Compressed risk premiums and extended bond duration increase potential for outsized losses
Sources: Federal Reserve Bank of New York; Adrian, Crump, and Moench (2013)3, Bloomberg L.P.; Haver Analytics, OFR analysis
Figure 4: Implied Volatility By Asset Class (Z-scores) Volatility has increased from very low levels
Sources: Bloomberg L.P., OFR analysis
Note: Z-score represents the distance from the average, expressed in standard deviations. Averages for equity, interest rate, and currency volatility are based on data from 1991.
-2.5 -2.0 -1.5 -1.0 -0.5 0.0 1.0 0.5 Dec 2013 Mar 2014 Jun 2014 Sep 2014 Dec 2014 Mar 2015 Jun 2015 U.S. Equities (VIX)
Global Currencies (CVIX 3M) U.S. Treasuries (MOVE)
Average
Figure 5: U.S. Private Sector Debt to GDP Ratios (Z-scores)
Nonfinancial corporate debt levels are elevated and rising, in contrast to other sectors
-2 -1 0 1 2 3 1990 1996 2002 2008 2014 Nonfinancial Business Financial Households
Note: Z-score represents the distance from the average, expressed in standard deviations.
Sources: Haver Analytics, Federal Reserve, OFR analysis
3 4 5 6 -1 0 1 2 3 4 5 1990 1995 2000 2005 2010 2015
balance-sheet weaknesses. The migration of risks from banks to less-regulated sectors is a continuing concern. For example, nonbank institutions continue to increase their share of highly leveraged syndicated loans (Figure 6).
Funding conditions remain broadly stable, but market liquidity appears fragile and a potential amplifier of stress. Some indicators of funding condi-tions — the ability of market participants to access affordable short-term financing — show modest pressure, but this primarily reflects technical market dynamics. Meanwhile, some market liquidity measures — the ability of market participants to sell assets with limited price impact and low transaction costs — signal a dete-rioration in liquidity. These changes have occurred along with a decline in the provision of liquidity by primary dealers, which could potentially reduce their willingness to buffer intense selling pressure. This is partly reflected in the monitor’s “intermediation” subcategory. Liquidity provision by dealers has been considerably reduced in the aftermath of the financial crisis, reportedly contributing to lower average trade sizes (Figure 7) and the contraction of market depth during episodes of stress. Trading volumes have not kept pace with the expansion of outstanding debt in key fixed-income markets, such as investment-grade U.S. corporate bonds, depressing the level of market turn-over (Figure 8). Overall, market liquidity appears more fragile in recent years. Although leverage in the financial system remains contained, which reduces the potential for a leverage-induced asset fire sale, amplifiers of stress related to liquidity remain a concern.
Figure 6: Primary Market for Highly Leveraged Loans: Banks versus Nonbanks (percent) Nonbanks dominate origination of highly-leveraged syndicated loans 0 20 40 60 80 100 1994 1998 2002 2006 2010 2014 Nonbanks
Banks and Securities Firms
Note: Nonbanks include institutional investors, insurance companies, and finance companies. Highly-leveraged loans are defined as loans with a spread of LIBOR + 225 basis points or more.
Source: Standard & Poor’s Leveraged Commentary & Data
Figure 8: Corporate Bond Turnover: 12-month Average Trading Volume (percent of market size) Liquidity strains are also reflected in declining turnover in corporate bonds
Sources: Bank of America Merrill Lynch, Bloomberg L.P., Haver Analytics, FINRA TRACE, OFR analysis
Figure 7: Relationship of Dealer Corporate Bond Inventories ($ billions) to Trade Size ($ thousands) from 2005 Q1 to 2015 Q1
Trade size has declined along with dealer inventories
0 50 100 150 200 250 300
Average trade size Bond Inventories
500 600 700 800 900 1,000 1,100 1,200 Note: Average trade size assumes total par traded divided by number of trades (for customers' buy-and-sell trades only).
0.0 0.5 1.0 1.5 2.0 2.5 2005 2008 2011 2014
High Yield Turnover Investment Grade Turnover
Contagion risks measured by the available indicators appear limited, unchanged from six months ago. This category is intended to capture risks associated with the interconnectedness of markets and institutions and the way that risk is transferred through direct and indirect exposures. In our interpretation, the current low reading of these contagion risk indicators reflects larger capital and liquidity buffers among large financial institutions, as well as reduced market-implied expectations for a chain of defaults across firms (Figures 9 and 10). We note that market-based contagion indicators have only provided strong signals during times of elevated financial stress. More work is needed to measure contagion risks more comprehensively and in a more forward-looking manner.
Conclusion
Overall financial stability risks remain moderate. A number of lingering vulnerabilities merit attention, including cyclical vulnerabilities, such as compressed asset risk premiums and corporate credit market condi-tions, and structural ones, such as the fragility of market liquidity, market microstructure weaknesses, and increased risk-taking in lightly regulated financial sectors. In addition, a key challenge is to limit the potential for spillovers to the United States stemming from divergent monetary policies in advanced economies and uneven prospects for global growth.
The Financial Stability Monitor is just one of the tools the OFR uses to evaluate potential threats to financial stability. The monitor will continue to evolve as we test its performance; evaluate new indicators, data, and statis-tical tools; and respond to the ways financial innovation may change intermediation, asset allocation, and risk management.
Figure 9: Measures of Joint Distress for Large U.S. Bank Holding Companies (standard deviations) Measures of joint bank distress remain mostly subdued
Note: Six large bank holding companies are Bank of America, Citigroup, Goldman Sachs, JPMorgan Chase, Morgan Stanley and Wells Fargo. Sources4: Adrian and Brunnermeier (2014), Acharya et al (2010), Huang, Zhou, and Zhu (2011), Bloomberg L.P., Federal Reserve, OFR analysis Figure 10: Fire-Sale Spillover Aggregate
Vulnerability (percent)
Measured fire-sale vulnerabilities have fallen considerably 0 1 2 3 4 5 6 7 2005 2007 2009 2011 2013 2015
Distressed Insurance Premium
Systemic Expected Shortfall
Conditional Value at Risk
0 10 20 30
1996 2002 2008 2014
Note: Aggregate Vulnerability is the percentage of financial system equity capital that would be lost due to fire-sale spillovers if all assets decreased in value by 1 percent.
Sources: Duarte and Eisenbach (2015)5, SNL Financial, Haver Analytics, OFR analysis
Endnotes
1 For an explanation of the basic tasks of the financial system, see section 2.1.1 in Office of Financial Research, 2012 Annual Report, Washington.
2 For a summary of the performance tests, see section 2.2 in Office of Financial Research, 2014 Annual
Report, Washington.
3 See Adrian, Tobias, Richard Crump, and Emanuel Moench, “Pricing the Term Structure with Linear Regressions,” Federal Reserve Bank of New York Staff Reports no. 340, August 2008, revised April 2013 (available at www.newyorkfed.org/research/staff_ reports/sr340.pdf, accessed February 18, 2015).
4 See Adrian, Tobias, and Markus Brunnermeier, “CoVaR,” Federal Reserve Bank of New York Staff Reports no. 348, September 2008, revised September 2014 (available at www.newyorkfed.org/research/ staff_reports/sr348.pdf, accessed February 18, 2015). See Acharya, Viral, Lasse H. Pederson, Thomas Philippon, and Matthew Richardson, “Measuring Systemic Risk,” New York University, May 2010 (available at pages.stern.nyu.edu/~sternfin/vacharya/ public_html/MeasuringSystemicRisk_final. pdf, accessed February 18, 2015). See Huang, Xin, Hao Zhou, and Haibin Zhu, “Systemic Risk Contributions,” Finance and Economics Discussion
Series no. 2011-08, Washington, D.C.: Board of Governors of the Federal Reserve System, January 2011 (available at www.federalreserve.gov/pubs/ feds/2011/201108/201108abs.html, accessed February 18, 2015).
5 See Duarte, Fernando, and Thomas M. Eisenbach, “Fire-Sale Spillovers and Systemic Risk,” Federal Reserve Bank of New York Staff Reports no. 645, October 2013, revised February 2015 (available at http://www.newyorkfed.org/research/staff_reports/ sr645.pdf, accessed March 8, 2015).