METHODOLOGY ADOPTED IN INDIA FOR THE ESTIMATION OF THE POVERTY
Dr Satyavrat Singh Rawat
Associate Professor, Department of Economics
NREC College Khurja
ABSTRACT
The poverty is a multidimensional concept and persisted in many form .It can be defined in an
absolute as well as in the relative form. Poverty is a socio-economic phenomenon and usually
perceived as deprivation with respect to basic human need. Generally poverty is defined in terms of
capacity to earn certain minimum degree of income for the subsistence. In India poverty defined by
the academicians as well as by the government institutions with the help of the several variables.
Identification of poor’s always remained cause of worry for our policies makers. The policies and
programme for poverty eradication have not gets the desired result due to the basic flaws in the
methodology as far as the measurement of the poverty is concerns.
KEY WORDS: Reference periods, Estimation, Mixed reference, and modified reference.
OBJECTIVE, METHODS AND SOURCES
The basic objective of this paper is to analysis of different methodology adopted in India for the
estimation of the poverty. This paper will further investigate the definition and dimension of the
poverty. Secondary data collected from internet, newspapers, published papers, books government
report and publication various economic survey and paper published by various intellectuals
INTRODUCTION
India has been a welfare state ever since her Independence and the primary objective of all
governmental endeavours has been the welfare of its millions. Elimination of poverty, ignorance,
diseases and inequality of opportunities and providing a better and higher quality of life were the
basic premises upon which all the plans and blue-prints of development were built. The
development of the sound methodology is necessary in understanding the relationship between
various variables affecting the nature and incidence of the poverty. The methodology for estimation
of poverty used by the Planning Commission has been based on the recommendations made by
Working Group, Task Force and Expert Groups consisting of eminent experts in the field. The
Planning Commission has constituted these Groups from time to time to revisit the methodological
issues related to the measurement of poverty so as to make the estimates more relevant to the
contemporary economic situation.
The methodology by the various Expert Group adopted more or less similar types of methodologies.
The maximum methodologies for estimation of the poverty is based on an exogenously determined
poverty line expressed in terms of per capita consumption expenditure in a month and the class
distribution of NSS (National Sample Survey) consumer expenditure data of the National Sample
Survey Office (NSSO). The poverty ratio (percentage of people living below the poverty line) is
obtained by counting the persons lying below the poverty line from the class distribution of persons.
DEFINITION AND DIMENSION OF THE POVERTY
Poverty is multidimensional concept and it includes both material and immaterial dimension (Misra
and Puri, 2015).There has been always a big debate among the academicians about the poverty and
methodology for its measurement. The incidence of poverty is measured by the poverty ratio, which
is the ratio of number of poor to the total population expressed as percentage. It is also known as
head-count ratio. The poverty ratio is measured from an exogenously determined poverty line
quantified in terms of per capita consumption expenditure over a month and the class distribution of
persons obtained from the large sample survey of consumer expenditure data of the National
Sample Survey Office (NSSO).
PER CAPITA EXPENDITURE METHOD: This is the most conventional and common method used for
determining the poverty in economics. The all India poverty line first time defined in the 1973-74
was rupees 49.73 per capita per month for rural areas and rupees 56.64 per capita per month for
the urban areas. Expert group on poverty submitted its report under the chairmanship of the former
RBI Governor Dr. C. Rangarajan has defined the poverty line as rupees 32 per day for rural areas and
MULTI-DIMENSIONAL POVERTY INDEX (MPI): The Human resource development report (HDR)
measure poverty in terms of a new parameter, namely multi-dimensional poverty index (MPI). The
MPI indicates the share of population that is multi dimensionally poor adjusted by the intensity of
deprivation in terms of living standards, health and education. According to this parameter India has
a poverty index of 0.296 and poverty ratio of 41.6 percent (Economic survey 2009-10).
THE CALORIE NORMS AND POVERTY LINE: The calorie norms based on which the Task Force (Alagh)
poverty lines were derived, and which had been the basis for the poverty lines worked out by the
Expert Group (Lakdawala), is 2400 kcal per capita per day in rural areas and 2100 kcal per capita per
day in urban areas. The calorie norm for each category of the population in terms of age, sex and
activity is lower as per the 2010 ICMR norms relative to those recommended by the Nutrition Expert
Group (1968).
THE WORLD BANK DEFINITION: The World Bank estimates the incidence of poverty in its member
countries at regular intervals. The approach of poverty estimation by the World Bank is similar to
those employed in India and in most of the developing countries. The World Bank estimates of
poverty are based on the poverty line of US $1.25 per person per day measured at 2005
international price and adjusted to local currency using PPP (Purchasing Power Parity) conversion
factor computed in the World Bank(Planning Commission,2014).
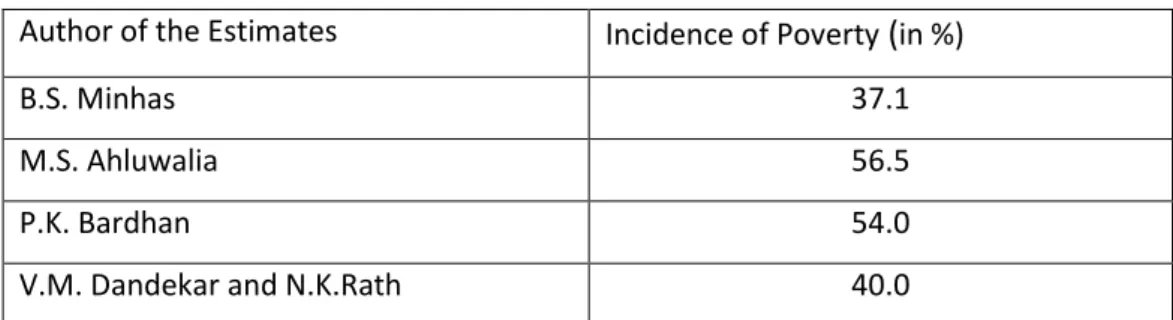
EARLIER ESTIMATES
The estimates of poverty in India provided by the Mihas, Ahluwalia, Bardhan, and Dandekar and
Rath provided earlier estimates of the poverty in India during the 1960s. All of these estimates
indicates large amount of the divergence in the incidence of the rural poverty in India (Misra and
Puri, 2015).
Table 1: Estimates of poverty in rural India, 1967-68
Author of the Estimates Incidence of Poverty (in %)
B.S. Minhas 37.1
M.S. Ahluwalia 56.5
P.K. Bardhan 54.0
V.M. Dandekar and N.K.Rath 40.0
The Planning Commission constituted a Working Group in 1962 to find out a desirable minimum
level of living for the population. The Working Group recommended that the national minimum
consumption expenditure for a household of five persons (four adult consumption units) should be
not less than Rs.100 per month or Rs.20 per capita per month in terms of 1960-61 prices. For urban
there. The poverty line excluded expenditure on health and education, both of which, it was
assumed, were to be provided by the State.
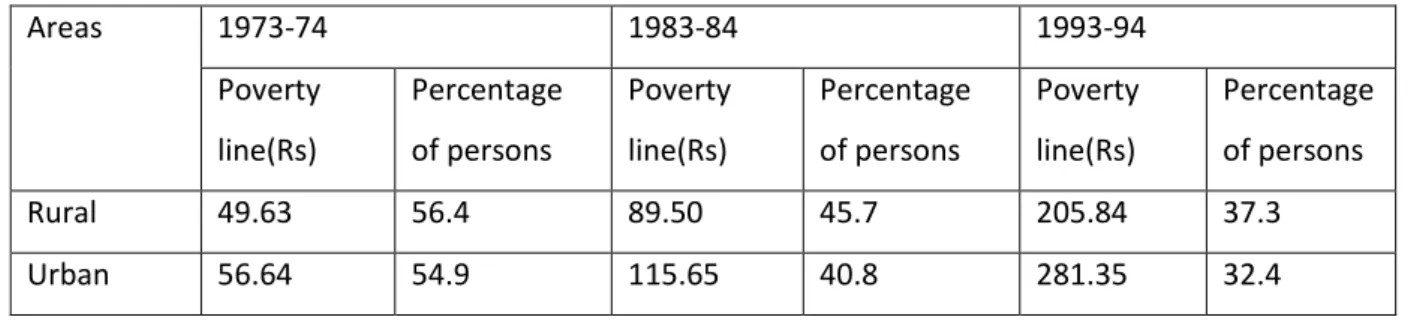
ESTIMATES BASED FOR 1973-74 TO 1998:
The all India poverty line first time defined in the 1973-74 was rupees 49.73 per capita per month for
rural areas and rupees 56.64 per capita per month for the urban areas. The NSSO in its 55th round
estimates defined rupees 327.56 per capita per month for rural areas and rupees 454.11per capita
per month for the urban areas (Misra and Puri, 2015).
Table 2: Percentage of people below the poverty line
Areas 1973-74 1983-84 1993-94
Poverty
line(Rs)
Percentage
of persons
Poverty
line(Rs)
Percentage
of persons
Poverty
line(Rs)
Percentage
of persons
Rural 49.63 56.4 89.50 45.7 205.84 37.3
Urban 56.64 54.9 115.65 40.8 281.35 32.4
REFERENCE PERIODS AND POVERTY ESTIMATES
The exact estimation of the poverty is depends upon the reference period regarding the
consumption expenditure. Three estimates of consumption along with its regional and class
distribution are presently available from the NSSO depending upon the recall (reference) period of
data collection. These are: (a) Uniform Recall Period (URP), (b) Mixed Recall Period (MRP) since
1993-94, and (c) Modified Mixed Recall Period (MMRP) for 2009-10 and 2011-12.
In the Uniform Recall Period (URP), the consumption expenditure data are collected using 30-day
recall period for all the items. In the Mixed Recall Period (MRP), the consumption expenditure data
are collected using 365-day recall period for five non-food items and 30-day recall period for
remaining items. In the Modified Mixed Recall Period (MMRP), the consumer expenditure data is
gathered from the households using the recall period of: (a) 365-days for clothing, footwear,
education, institutional medical care, and durable goods, (b) 7-days for edible oil, egg, fish and meat,
vegetables, fruits, spices, beverages, refreshments, processed food, pan, tobacco and intoxicants,
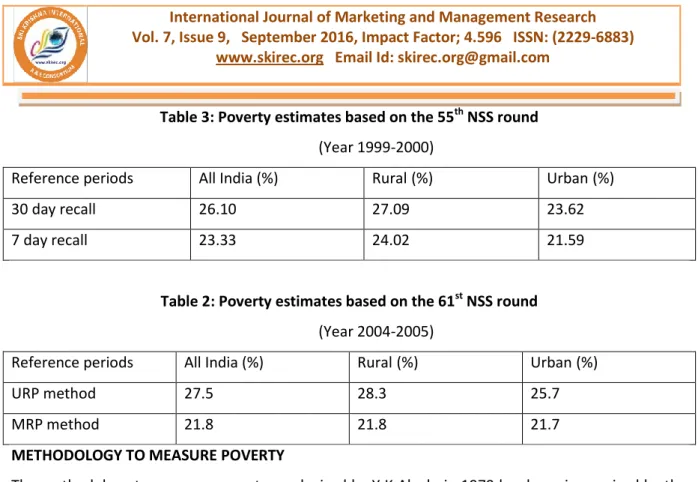
and (c) 30-days for the remaining food items, fuel and light, miscellaneous goods and services
Table 3: Poverty estimates based on the 55th NSS round
(Year 1999-2000)
Reference periods All India (%) Rural (%) Urban (%)
30 day recall 26.10 27.09 23.62
7 day recall 23.33 24.02 21.59
Table 2: Poverty estimates based on the 61st NSS round
(Year 2004-2005)
Reference periods All India (%) Rural (%) Urban (%)
URP method 27.5 28.3 25.7
MRP method 21.8 21.8 21.7
METHODOLOGY TO MEASURE POVERTY
The methodology to measure poverty, as devised by Y K Alagh, in 1979 has been improvised by the
Expert Group (Lakdawala) in 1993 and then by the Expert Group (Tendulkar) in 2009. The
methodology to measure poverty, as devised by Y K Alagh has been improvised by the Expert Group
(Lakdawala) in and then by the Expert Group (Tendulkar) in 2009 and now it has been further
modified by the Expert Group (Rangarajan) in 2014.
TASK FORCE 1979: ALAGH
The Planning Commission in July 1977 constituted the Task Force on “Projections of Minimum Needs
and Effective Consumption Demand” under the Chairmanship of Dr. Y. K. Alagh. The Task Force
provided a quantitative measure of poverty by estimating the average calorie requirements were
estimated and poverty line in terms of calorie intake. Based on the observed consumer behaviour in
1973-74 it was estimated that, on an average, consumer expenditure (food and non-food) of
Rs.49.09 per capita per month was associated with a calorie intake of 2400 per capita per day in
rural areas and Rs.56.64 per capita per month with a calorie intake of 2100 per day in urban areas.
This Monthly Per Capita Expenditure (MPCE) was termed as poverty line. The poverty lines for later
years were estimated by updating the poverty lines of the year 1973-74 for price changes.
EXPERT GROUP 1993: LAKDAWALA
The Planning Commission, in September 1989, constituted the Expert Group on Estimation of
Proportion and Number of Poor to “look into the methodology for estimation of poverty and to
re-define the poverty line, if necessary”. The Expert Group (Lakdawala) calculated the state-specific
poverty ratios in rural and urban areas from the state-specific poverty lines and the state-specific
consumer expenditure of the National Sample Survey Office (NSSO), which are available once in
approximately five years. These state-specific poverty lines of base year (1973-74) were updated for
subsequent years using state-specific price indices especially constructed by taking weighted
average of the commodity group-wise Consumer Price Index of Agricultural Labourers (CPIAL) of (a)
food (b) fuel and light, (c) clothing and footwear and (d) miscellaneous with their respective weights
in the national consumption basket of the poor in 1973-74. The aggregate poverty ratio of the state
was worked out by combining its rural and urban poverty ratios. The national poverty ratio was
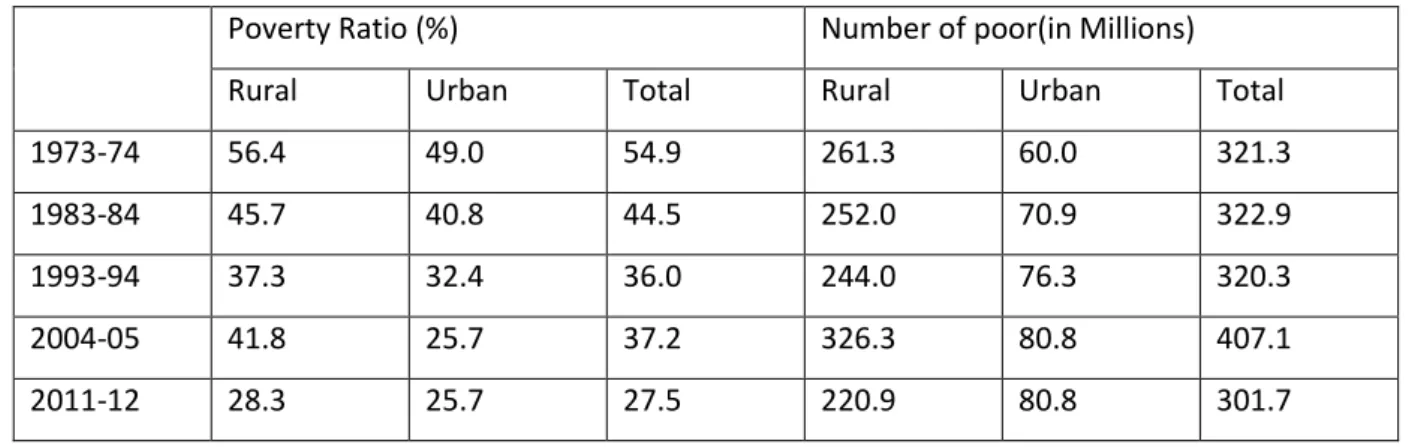
computed as weighted average of state-wise poverty ratios (Himansu, 2010).
Table 3: Percentage and Number of Poor Estimated by Lakdawala method, using Uniform
Reference Period (URP)
Poverty Ratio (%) Number of poor(in Millions)
Rural Urban Total Rural Urban Total
1973-74 56.4 49.0 54.9 261.3 60.0 321.3
1983-84 45.7 40.8 44.5 252.0 70.9 322.9
1993-94 37.3 32.4 36.0 244.0 76.3 320.3
2004-05 41.8 25.7 37.2 326.3 80.8 407.1
2011-12 28.3 25.7 27.5 220.9 80.8 301.7
EXPERT GROUP (TENDULKAR)
The Expert Group under the chairmanship of Suresh D. Tendulkar was constituted by the Planning
Commission in December 2005.This committee was set up to review alternative conceptualizations
of poverty, and associated technical aspects of procedures of measurement and data base for
empirical estimation including procedures for updating over time and across states, and to
recommend any changes in the existing procedures of official estimates of poverty. The Expert
Group (Tendulkar) did not construct a poverty line. It adopted the officially measured urban poverty
line of 2004-05 based on Expert Group (Lakdawala) methodology and converted this poverty line
(which is URP-consumption based) into MRP-consumption. State-specific urban and rural poverty
lines are derived from the (MRP-consumption based) national urban and poverty line using urban
and rural state-relative-to-all-India fisher indices. The planning commission has released the
estimates of poverty based on the NSSO 68th round estimates on household consumption estimates
has defined the poverty line as rupees 27.20 per day for rural areas and rupees 33.33 per day for
the urban areas for the 2011-12, based on the Tendulkar committee recommendations(Misra and
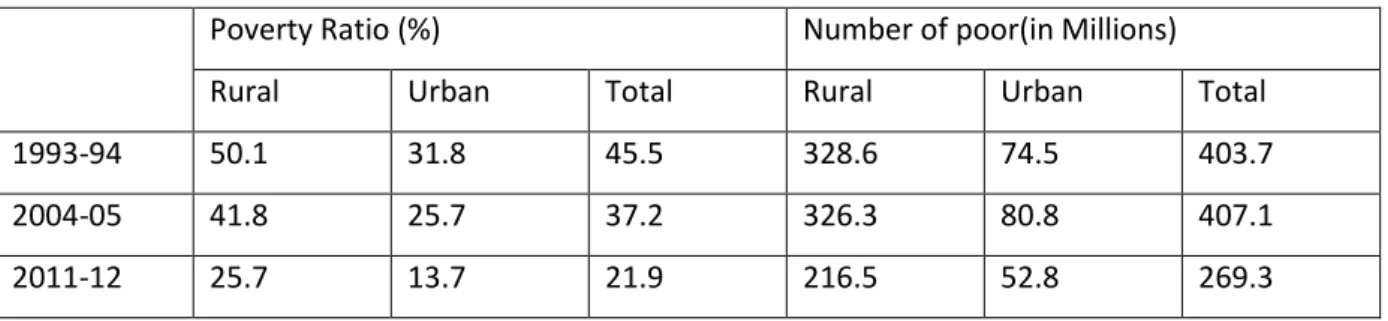
Table 4: Percentage and Number of Poor Estimated by Tendulkar method, using Mixed
Reference Period (MRP)
Poverty Ratio (%) Number of poor(in Millions)
Rural Urban Total Rural Urban Total
1993-94 50.1 31.8 45.5 328.6 74.5 403.7
2004-05 41.8 25.7 37.2 326.3 80.8 407.1
2011-12 25.7 13.7 21.9 216.5 52.8 269.3
EXPERT GROUP (RANGARAJAN):
This group has submitted its recommention to the government in 2014. The Methodology developed
and adopted by the Expert Group under the chairmanship of the Dr. C. Rangarajan and the results
based on these are outlined below:
The poverty line should be based on certain normative levels of adequate nourishment, clothing,
house rent, conveyance and education, and a behaviourally determined level of other non-food
expenses.
The Expert Group computed the average requirements of calories, proteins and fats based on ICMR
norms differentiated by age, gender and activity for all-India rural and urban regions to derive the
normative levels of nourishment. The protein and fat requirements have been estimated on the
same lines as for energy.
A food basket that simultaneously meets all the normative requirements of the three nutrients
defines the food component of the poverty line basket proposed by the Expert Group.
The Expert Group recommends the updating of the poverty line in the future using the Fisher Index.
The new poverty line thus work out to monthly per capita consumption expenditure of Rs.972 in
rural areas and Rs.1,407 in urban areas in 2011-12. For a family of five, this translates into a monthly
consumption expenditure of Rs.4,860 in rural areas and Rs.7,035 in urban areas. This group has
defined the poverty line as rupees 32 per day for rural areas and rupees 47 per day for the urban
areas.
Estimations of the poverty line made for the Expert Group (Rangarajan) based on an independent
large survey of households by CMIE and using a different methodology wherein a household is
considered poor if it is unable to save, yields results that are remarkably close to those derived using
the NSSO data.
Compared to the poverty lines based on the methodology of the Expert Group (Tendulkar), the
areas, respectively. The Expert Group (Rangarajan) uses the Modified Mixed Recall Period
consumption expenditure data of the NSSO as these are considered to be more precise compared to
the MRP, which was used by the Expert Group (Tendulkar) and the URP, which was used by earlier
estimations. 67% of the increase in the rural poverty line and 28% of the increase in the urban
poverty line is because of the shift from MRP to MMRP (Planning commission, 2014).
Table 5: Percentage and Number of Poor Estimated by Rangarajan method, using Mixed
Reference Period (MMRP)
Poverty Ratio (%) Number of poor(in Millions)
Rural Urban Total Rural Urban Total
2004-05 39.6 35.1 38.2 313.14 140.26 453.40
2011-12 30.9 26.4 29.5 260.40 102.60 363.00
CONCLUSION AND SUGGESTIONS
On the basis of the finding in this research paper following can be the major conclusions and
suggestions:
There is a significant difference between the estimation of poverty as suggested by various groups
and academicians.
A comparison of the poverty ratio for the two years 2004-05 and 2011-12 derived from the Expert
Group (Rangarajan) method and the Expert Group (Tendulkar) method shows that the average level
of poverty ratio derived from the Expert Group (Rangarajan) method is higher than that derived
from the Expert Group (Tendulkar) method.
The total methodologies are based upon the estimation of the poverty line but the concept of the
poverty line doesn’t include the severity of the poverty.
Although every expert groups tried hard to include as many as important items and services in the
consumption baskets of the consumers but none of the methodology can estimated poverty ratio
exactly. The non-income based parameters should be considered for the purpose of the estimating
poverty line.
With the variation of the reference periods the estimates of the poverty also varied significantly.
The consumer price indices have been used to updates the poverty lines for the purpose of
estimating the cost of living in the country. The proper and updated indices should be constructed
for the purpose of the updating poverty lines.
In post reform period the rate of decline in the poverty ratio is not very low and below the
The correlation between GDP growth rate and decline in the poverty line is not very significant.
There is a high need to establish link between these two variables.
There are many shortcomings in the methodology of the poverty estimation and it should be
removed urgently so that correct estimations should available to over planners.
REFERENCES
Himanshu, (2010): “Towards new poverty line in India”, Economic and Political Weekly, 2January.
Patnaik, Utsa (2007): “Neoliberalism and Rural Poverty in India” Economic and Political Weekly,
28July
Puri, V.K. and Misra, S.K. (2015),:“Poverty in India”, Indian Economy ,Himalaya Publishing House ,
New Dehli.
Government of India, Economic survey 2010-11 to 2015-16, New Delhi
Government of India, Planning commission,(2014), “ Report of the expert group to review the
methodology to measure the poverty”. New Delhi.
Reserve Bank of India, (2010) Handbook of statistics on the Indain Economy, 2009-10, Mumbai, 2010.