THE EFFECTIVENESS OF MONETARY POLICY IN MANAGING INFLATION AND REAL GDP IN GHANA
Emmanuel AttahKumah
Research Scholar-SHUATS, Joseph School of Business Studies
SHUATS-Allahabad
Dr. ShabanaMazhar
HOD & Assoc. Professor, Joseph School of Business Studies
SHUATS-Allahabad
ABSTRACT:
This study examine the effectiveness of monetary policy in managing inflation and real GDP in Ghana
using a multivariate modeling technique of the Vector Autoregression (VAR) and focusing on impact
of broad money supply (M2), lending rate, USD exchange rate and domestic credit for the quarterly
period 2000-2017. The stochastic shocks of monetary policy actions and decisions on the real GDP
and inflation were carried out by examining the dynamic nature of Granger Causality Test, Cholesky
Ordered Impulse Response Functions and Forecast Error Variance Decomposition for the VAR model.
The study found that the potency of monetary policy in influencing real GDP and inflation is limited,
as important channels of monetary transmission are not fully functional. In particular, the credit
channel and the exchange rate channel were found weak, even though there is evidence of money
supply as the only monetary policy instrument exerting significant effects on real GDP and inflation.
This study has, therefore, established the lack of unequivocal evidence in support of the conventional
channel of monetary policy transmission mechanism. It has revealed that money supply and lending
rate are the most important variables in predicting real GDP and inflation in the case of Ghana
during the study period.
It is recommended that a more expansionary monetary policy should accompany a set of policies
geared towards improving investment efficiency and bolstering consumption. In addition, the Bank of
Ghana should entice more reputable foreign banks, especially banks from Asia into the Ghanaian
market with a view to importing expertise, increasing competition and efficiency of bank operations
INTRODUCTION:
Monetary policies all over the world have been pursued together with fiscal policies to ensure that economic progress is achieved while fiscal and other macroeconomic challenges are addressed. These policies and strategies have been dynamic and in line with global trends in order to be relevant. Monetary policy involves the use of different measures with the aim of regulating the value, supply and cost of money in consonance with the expected level of economic activity. The common objectives of any monetary policy may include price stability, maintenance of balance of payments equilibrium, and creation of employment, output growth, and sustainable development. In order to be effective and globally acceptable, monetary policies have to be dynamic. Thus, monetary policies have undergone dynamic changes globally but in African countries this begun in the 1980s and 1990s where there was a conscious move away from the direct control measures to indirect monetary policy.
However, due to the absence and illiquidity of financial markets such as secondary bill markets, many countries were hardly employing indirect monetary control instruments such as open market operations (Ncube, 2007). In the specific case of Ghana, monetary policies have evolved from the use of direct instruments to the market-based approach where the main target of policy is the money supply (see Alexander et al., 1995 and Roe and Sowa, 1997). For instance, before the start of financial sector reforms in 1994, the Bank of Ghana (BoG) operated a system of managing the amount of money in the economy by using direct controls and a fixed exchange rate system. While this approach was relatively easy to implement and also appealed to the government (which was mainly interested in channeling resources to certain “priority sectors” of the economy), there were several inefficiencies associated with its ability to give the right signals for allocating resources efficiently. As the reforms began, this system was abolished in favour of a relatively more market-based form of distributing and managing resources. Under the market-market-based system, the aim was to use indirect instruments to regulate money supply in order to achieve price stability and other economic objectives. This approach was based on the strong conviction that inflation in Ghana was solely or predominantly a monetary phenomenon, following the monetarist school of thought. Within this monetary policy framework, reserve money served as an operating target, money supply (M2+) as the intermediate target, with the final target being inflation.
the Bank of Ghana Act 2002 specifically considers the BoG as an inflation-targeting central bank by indicating in the BOG Act 617, Section 33(2) that:
“The Bank, in counteracting unusual movements in the money and prices in the country, shall use any of the instruments of control conferred upon it under this Act or under any other enactment to maintain and promote a balanced growth of the national economy”
The Bank of Ghana has since 2002 mimicked the policy of price stability, particularly; low inflation and a fairly stable exchange rate (Sowa and Abradu-Otoo, 2007). Quartey (2010) notes that although the central bank has been pursuing low inflation policies as of 2002 albeit it does not follow an explicit inflation targeting framework. However, the low inflation policy framework mimics an inflation targeting regime in which a specific level of inflation is set and targeted jointly by the central bank and the Ministry of Finance, but the target does not involve the usual modelling and minimizing of the loss functions as is typically done under inflation targeting regimes (Sowa and Abradu-Otoo, 2007).
However, one thing that is very evident is that although this “inflation targeting” framework has been operational since 2002; its outcome has not received much interrogation.
RESULTS AND DISCUSSIONS:
4.1 DESCRIPTIVE STATISTICAL ANALYSIS FOR GHANA:
This section examines the distribution of the data using mean, median and standard deviation. The normality of distribution of the variables was also ascertained using skewness, kurtosis and Jacque-Bera tests. The results are presented in Table 4.1.
Table 4.1:Summary of Descriptive Statistics for Ghana
RGDP INF M2 LRATE CREDIT EXRATE
Mean 5700.905 22.80278 1552.751 36.44347 13.11624 0.792013
Median 5600.85 18.15 1517.25 35.585 12.8315 0.8488
Maximum 6588.73 41.9 3041.8 47.75 15.544 0.9131
Minimum 4956.9 12.9 492.9 26 11.883 0.3625
Std. Dev. 489.4101 9.134041 790.449 6.954228 1.180934 0.135318
Skewness 0.260707 0.688448 0.298015 0.389918 0.788904 -1.43047
Kurtosis 1.839937 2.005098 1.684635 1.927414 2.359987 4.649427
Jarque-Bera 4.85286 8.657024 6.256307 5.275755 8.697285 32.71659
Probability 0.088352 0.013187 0.043799 0.071513 0.012924 0.000000
Sum 410465.1 1641.8 111798.1 2623.93 944.369 57.0249
Sum Sq. Dev. 17006079 5923.579 44361482 3433.651 99.01701 1.300073
Observations 72 72 72 72 72 72
The descriptive statistics as evidenced in Table 4.1 reveals the broad money supply (M2) as having a larger standard deviation of 790.449 among all the indexed variables which indicates a high volatility in broad money supply. The mean-to-median ratio of each variable is approximately 1. The range of variation between maximum and minimum values is quite logical. The standard deviation in comparison with the mean is low for all the variables which indicate small coefficient of variation. The skewness for RGDP, INF and LRATE reveals approximate normality of these variables; however, CREDIT and M2 indicate distribution of long left tails. EXRATE shows a distribution of long right tail. The kurtosis of normal distribution is 3, but the distribution of RGDP, CREDIT, LRATE and M2 are platykurtic (flat) relative to normality. INF indicates a normal distribution whilst EXRATE indicates a leptokurtic (peaked) distribution relative to the normal.
The Jacque-Bera statistics also indicate that the distribution of all the variables during the sample period have long left and right tails and flat than normal distribution. On the whole the Jacque-Bera test of the variables do not conform to the normal distribution but display negative, positive and flat distributions. These results are however, based on the null hypothesis of normality and provide no information for the non-parametric distribution of the series.
4.2 TREND ANALYSIS FOR GHANA:
TIME SERIES GRAPHICAL ANALYSIS FOR THE VARIABLES IN GHANA MONEY MARKET:
The trend of the selected variables under study was taken to assess how they have related in the period for the study. The results are shown in Figure 4.1
Figure 4.1: Graphs of Variables from Ghana Money Market in Log Levels
-2 0 2 4 6 8 10
2000 2002 2004 2006 2008 2010 2012 2014 2016
Log RGDP Log INF Log M2 Log LRATE Log CREDIT Log EXRATE
Source: Bank of Ghana and Ghana Statistical Service, 2017.
credit to private sector which has affected real GDP to increase. From the graph, the rate of increasing domestic credit is very low as compared to the rate of increasing money supply; due to this, there is less investment, innovations, production (GDP), exports but more imports in Ghana. This has affected the lending rate to decrease slightly from 37.50% in January, 2000 to 31.33%. The high lending rate (31.33%) in Ghana and the low domestic credit to private sector have affected Ghanaians to have access to funds to produce in the country; due to this, there is less investment, innovation, production (GDP), exports but more imports. This has caused the exchange rate to appreciate (increase) and that is why inflation in Ghana is too high (13.3%).
Figure 4.2:Graphs of Differenced Series of Variables in Ghana Money Market
-.6 -.4 -.2 .0 .2 .4 .6 .8
2000 2002 2004 2006 2008 2010 2012 2014 2016
Log Differenced RGDP Log Differenced INF Log Differenced M2 Log Differenced LRATE Log Differenced CREDIT Log Differenced EXRATE
Source: Bank of Ghana and Ghana Statistical Service, 2017.
On differencing the series once, they tended to fluctuate around their mean suggesting that they became stationary. That is, they tended to exhibit similar behaviour on differencing. This is depicted
in figure 4.2. According to Stigler and Sherwin (1985), unrelated variables might have high
correlation coefficient using the levels but on differencing, they exhibited low correlation coefficient. However, two related nonstationary variables tended to have high correlation coefficient both in levels and first differences. The real GDP, inflation, the exchange rates, domestic credit, the lending rate and broad money supply exhibited similar movement in first differences as shown in Figure 4.2.
4.3 STATIONARITY TEST:
Table 4.2 Philip-Perron unit root test at level
Method Statistic Prob.**
PP - Fisher Chi-square 29.4798 0.0033
PP - Choi Z-stat 2.01075 0.9778
** Probabilities for Fisher tests are computed using an asymptotic Chi-square distribution. All other tests assume asymptotic normality.
From Table 4.2, when each variable is examined through level, the calculated PP statistics reject the null hypothesis since the P-Value is more than 5%; that is, the P-Value for PP - Fisher Chi-square is 0.0033 and that of PP - Choi Z-stat is 0.9778. This means that, the variables in the VAR model is not stationary. The variables were differenced to inquire if stationarity can be achieved. The results are presented Table 4.3
Table 4.3 Philip-Perron unit root test at 1st difference
Method Statistic Prob.**
PP - Fisher Chi-square 161.875 0.0000
PP - Choi Z-stat -11.4041 0.0000
** Probabilities for Fisher tests are computed using an asymptotic Chi-square distribution. All other test assumes asymptotic normality.
From Table 4.3, when each variable is examined through first difference, the calculated PP statistics accepted the null hypothesis that there is unit root at 5% significant levels when compared with the relative critical values; that is, P-Value for PP - Fisher Chi-square is 0.0000 and that of PP - Choi Z-stat is 0.0000. This means that, the variables in the VAR model are stationary. The null hypothesis of the presence of a unit root is rejected since the p-values for the various macroeconomic variables are less than 5 percent at first difference. This paves the way for the study to estimate the VAR model.
4.4 STABILITY AND RELIABILITY OF THE OPTIMAL LAG VAR MODEL:
Table 4.4: VAR model optimal lag lengths check
Lag LogL LR FPE AIC SC HQ
0 -1248.95 NA 4.32e+08 36.91016 37.10600 36.98776
1 -665.065 1047.550 43.51742 20.79603 22.16690* 21.33921*
2 -625.117 64.62277 39.69448 20.67990 23.22580 21.68866
3 -585.034 57.76620* 37.49252* 20.55982* 24.28076 22.03417
4 -553.193 40.26875 48.01570 20.68216 25.57813 22.62209
Note: * Indicates lag order selected by the criterion; LR: sequential modified LR test statistic (each test at 5% level); FPE: Final Prediction Error; AIC: Akaike Information Criterion; SC: Schwarz Information Criterion; HQ: Hannan-Quinn Information Criterion.
The inverse roots of the AR characteristics polynomials which lie within the unit circle indicated that there was no problem in terms of stability of three-lag VAR model for the base model and stability of lag-one for RGDP and INF models. Moreover, the reliability of the model whose lag length was determined to be three (3) was also confirmed on the basis of the 0.05 significance level found in three diagnostic tests: namely, the Breusch-Godfrey (Serial Correlation), L.M. White (Heteroskedasticity) and Multivariate normality of the VAR Residuals for all the models.
4.5 ANALYSIS OF THE BASE VAR MODELS:
The original VAR regression results are provided in Appendix 5. From the VAR regression results, the granger causality tests, impulse response functions, and forecast error variance decompositions estimates are derived and presented accordingly by beginning with the base VAR model. Vector autoregression is used extensively in econometric analysis because they are easy to specify and estimate; however, if the process is stationary or involves nonstationary cointegrated variables, it is usually difficult to interpret the VAR coefficients directly (Lütkepohl and Saikkonen, 1995). Therefore, granger causality test, impulse response analysis and forecast error variance decomposition are the alternative approaches proposed which help in understanding the relation among variables of the VAR system. According to Stock and Watson (2001), granger-causality tests, impulse responses and forecast error variance decompositions are more informative to
understanding the relationships among the variables than the VAR regression coefficients or R2
statistics.
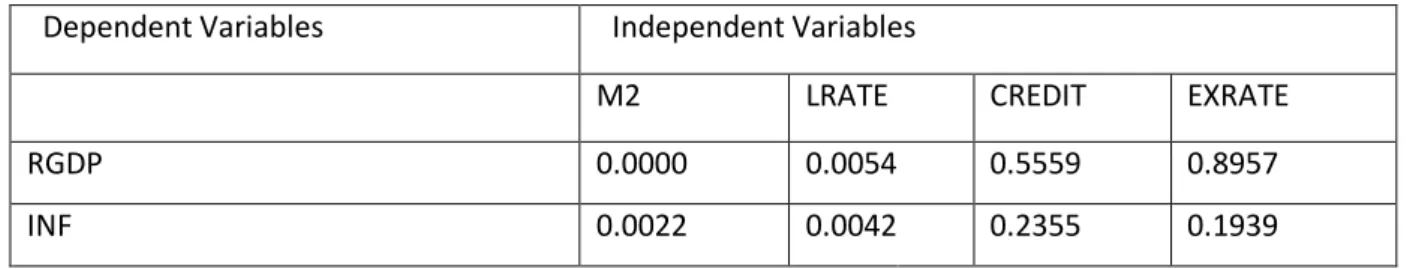
4.6 GRANGER CAUSALITY / BLOCK EXOGENEITY TEST: THE BASE MODEL:
Table 4.5: Granger Causality Wald Test Result for the Base model
Dependent Variables Independent Variables
M2 LRATE CREDIT EXRATE
RGDP 0.0000 0.0054 0.5559 0.8957
INF 0.0022 0.0042 0.2355 0.1939
Entries are P-Values for the X2 Test
The Granger causality tests results in Table 4.5 show that money supply and lending rate granger cause real GDP at the 5% significance level. Domestic credit to private sector and exchange rate do not granger cause real GDP. The implication is that Past values of domestic credit to private sector and exchange rate cannot be used to forecast the present value of real GDP.
Lending rate and money supply have a significant effect on inflation. However, domestic credit to private sector and exchange rate do not cause inflation. The implication is that Past values of domestic credit to private sector and exchange rate cannot be used to forecast the present value of inflation. Monetary theory suggests that an increase in the money supply leads to an increase in the price level and a potential increase in real GDP.
4.7 IMPULSE RESPONSES FOR THE BASE MODEL FOR GDP:
To buttress the information adduced in the granger causality test, a confirmation and direction was sought by looking at the impulse responses for the overall effect of money supply, lending rate, domestic credit to private sector and exchange rate on real GDP. The results are shown in Figure 4.2. The dotted lines representing ±2 standard error confidence intervals and on horizons given 10 year periods.
Figure 4.3a: Responses of Real GDP to Broad Money (M2)
-20 -10 0 10 20
1 2 3 4 5 6 7 8 9 10
Response of RGDP to M2
A positive shock to money supply leads to a positive response of real GDP which is persistent and thus last between the second year through to the tenth year as shown in Figure 4.3a. This confirms the result obtained in the granger causality test. Theoretically Keynes had explained that when money supply increases interest rate falls, investment increases and real GDP increases. Empirical studies such as Fang &Weiya (2011), Ahmed &Suliman (2011) and Hameed and Ume (2011) confirm a strong positive impact of money supply on GDP. The study accepts the alternative hypothesis that monetary policy has a significant impact on real GDP. The combined Wald Test of the significance of monetary policy having effect on output has been confirmed at 5% level of significance with a p-value of 0.0000. Moreover, taking individual endogenous variable into consideration for Wald test, the p-value for money supply is 0.0000, lending rate is 0.1324, domestic credit to private sector is 0.0108 and exchange rate is 0.0001. Thus, money supply, domestic credit to private sector and exchange rate are significant impact on real GDP but the past value of lending rate could not help predict the current level of inflation with p-value of 0.4429. In Ghana, monetary policy impact on output.
Figure 4.3b: Responses of Real GDP to Lending Rate
-20 -10 0 10 20
1 2 3 4 5 6 7 8 9 10
Response of RGDP to LRATE
Response to Cholesky One S.D. Innovations ± 2 S.E.
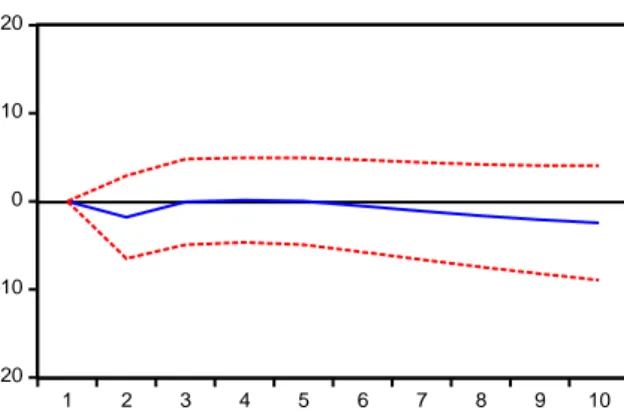
Figure 4.3c: Responses of Real GDP to Domestic Credit to Private Sector
-20 -10 0 10 20
1 2 3 4 5 6 7 8 9 10
Response of RGDP to CREDIT
Response to Cholesky One S.D. Innovations ± 2 S.E.
A one standard deviation monetary shock on domestic credit results in a positive impact which is transitory and last between three to five years; responds negatively between the six to the tenth year. This inconsistency vis-à-vis the response of real GDP to domestic credit, as explained above, could be attributed to such other factors as loose monetary policy in the domestic market, differences between domestic and global lending rate and real trade openness. Empirical studies such as Gozgor G &Gozgor K (2013), Kelly, McQuinn& Stuart (2013) and Iwedi, Igbanibo and Onyekachi (2015), confirm a positive relationship between GDP and domestic credit.
Figure 4.3d: Responses of Real GDP to Exchange Rate
-20 -10 0 10 20
1 2 3 4 5 6 7 8 9 10
Response of RGDP to EXRATE
Response to Cholesky One S.D. Innovations ± 2 S.E.
studies such as Ping HUA (2011), Rodrik (2008), Ito, Isard&Symansky (1999) and Christensen (2012) confirm a negative relationship between GDP and exchange rate.
4.8 IMPULSE RESPONSES FOR THE BASE MODEL FOR INFLATION:
To prop the information presented in the granger causality test, the impulse response was conducted to confirm the overall effect of money supply, lending rate, domestic credit to private sector and exchange rate on inflation. The results are shown in Figure 4.4. The dotted lines representing ±2 standard error confidence intervals and on horizons given 10 year periods.
Figure 4.4a: Responses of Inflation to Money Supply
-1.5 -1.0 -0.5 0.0 0.5 1.0 1.5 2.0
1 2 3 4 5 6 7 8 9 10
Response of INF to Cholesky One S.D. M2 Innovation
A one standard deviation monetary shock on money supply results in a negative impact which is transitory and last between one to five years; responds positively from the fifth to the tenth year. This inconsistency vis-à-vis the response of inflation to money supply, as explained, could be attributed to such other factors as instability in the nominal exchange rate and prices of imported goods and not much affected by the actual quantity of money. This also confirms the result from granger causality test. Empirical studies such as McCandless& Weber (1995), King (2002) and Walsh (2003) confirm a strong positive impact of money supply on inflation. The hypothesis that monetary policy has a significant impact on inflation is accepted. The combined Wald Test of the significance of monetary policy having effect on inflation has been confirmed at 5% level of significance with a p-value of 0.0041.
-2 -1 0 1 2 3
1 2 3 4 5 6 7 8 9 10
Response of INF to LRATE
Response to Cholesky One S.D. Innovations ± 2 S.E.
A one standard deviation monetary shock on lending rate results in a negative impact which is transitory and last between one to five years; responds positively between the sixth to the tenth year. This inconsistency vis-à-vis the response of inflation to money supply, as explained above, could be attributed to such other factors as instability in the nominal interest rate. This also confirms the result from granger causality test. Empirical studies such as Thaddeus &Nnneka (2014) and Alex &Inne (2006) confirma negative relationship between inflation and lending (interest) rate.
Figure 4.4c: Responses of Inflation to Domestic Credit to Private Sector
-2 -1 0 1 2 3
1 2 3 4 5 6 7 8 9 10
Response of INF to CREDIT
Response to Cholesky One S.D. Innovations ± 2 S.E.
A positive shock to domestic credit leads to a positive response of inflation which is persistent and thus last between the first year through to the tenth year as shown in Figure 4.4c. More credit to the private sector is an expansionary measure and could result in high rate of inflation if supply side constraints are not resolved to ease output. Empirical studies such as Tinoco-Zermeño, Venegas-Martínez& Torres-Preciado (2014), Fokwa& Guy-Paulin (2013) and Korkmaz (2015) confirm a positive relationship between inflation and domestic credit.
-2 -1 0 1 2 3
1 2 3 4 5 6 7 8 9 10
Response of INF to EXRATE
Response to Cholesky One S.D. Innovations ± 2 S.E.
A one standard deviation monetary shock on exchange rate results in a negative impact which is transitory and last from one to four years and from five to ten years; responds positively between the four to the five years. Empirical studies such as Ebiringa, Thaddeus &Nnneka (2014), Albuquerque & Portugal (2005) and Kashif (2015) confirm a negative relationship between inflation and exchange rate.
4.9 FORECAST ERROR VARIANCE DECOMPOSITION: THE BASE MODEL:
The Cholesky Forecast Error Variance Decomposition (FEVD) helps determine a shock of fluctuations in a variable caused by shocks on other variables. The variance decomposition is calculated for the third, sixth and the tenth years. The outcome is shown in Table 4.6
Table 4.6: Variance Decomposition of Base Model [Ordering reflects Cholesky ordering]
Decomposition
of
Independent Variables
Period S.E. M2 LRATE CREDIT EXRATE
RGDP 3 23.55989 10.40634 8.238259 0.929064 0.137629
6 30.68577 23.04679 16.02617 0.555581 1.019541
10 40.17872 36.4996 19.65343 0.39952 0.930183
INF 3 4.628268 1.44531 2.259556 2.155666 3.616469
6 6.307656 1.164066 2.20168 1.604768 8.100498
Source: Derived from the VAR Base Model Regression
The variance decomposition demonstrate that money supply shocks are a very important source of fluctuations in real GDP, accounting for 36.4996 % shocks in real GDP in the longer horizon of ten years, followed by lending rate accounting for 19.65343% shocks in real GDP in the longer horizon of ten years. Domestic credit to private sector is the next source of fluctuations in real GDP, accounting for 0.39952% shocks in real GDP in the longer horizon of ten years. Exchange rate is the last source of fluctuations in real GDP, accounting for 0.930183% shocks in real GDP in the longer horizon of ten years.
In the case of inflation, the variance decomposition demonstrate that exchange rate shocks are a very important source of fluctuations in inflation, accounting for 11.98118% shocks in inflation in the longer horizon of ten years, followed by money supply accounting for 3.903647% shocks in inflation in the longer horizon of ten years. Domestic credit to private sector accounts for only 2.975867% of the shocks in inflation in the longer horizon of ten years. Lending rate accounts for 1.7207% shocks in inflation in the tenth year.
5.1 SUMMARY OF MAJOR FINDINGS OF THE STUDY:
In the base VAR Model for Ghana, money supply and lending rate granger cause real GDP at the 5% significance level. Domestic credit to private sector and exchange rate do not granger cause real GDP at the 5% significant level. The implication is that Past values of domestic credit to private sector and exchange rate cannot be used to forecast the present value of real GDP in Ghana.
Lending rate and money supply have a significant impact on inflation. However, domestic credit to private sector and exchange rate do not cause inflation in Ghana. The implication is that Past values of domestic credit to private sector and exchange rate cannot be used to forecast the present value of inflation but present value of lending rate and money supply can be used to forecast future values of inflation in Ghana.
The variance decomposition demonstrate that money supply shocks are a very important source of fluctuations in real GDP, accounting for 36.4996 % shocks in real GDP in the longer horizon of ten years, followed by lending rate accounting for 19.65343% shocks in real GDP in the longer horizon of ten years. Exchange rate is the next source of fluctuations in real GDP, accounting for 0.930183% shocks in real GDP in the longer horizon of ten years. Domestic credit to private sector is the last source of fluctuations in real GDP, accounting for 0.39952% shocks in real GDP in the longer horizon of ten years.
the longer horizon of ten years, followed by money supply accounting for 3.903647% shocks in inflation in the longer horizon of ten years. Domestic credit to private sector accounts for only 2.975867% of the shocks in inflation in the longer horizon of ten years. Lending rate accounts for 1.7207% shocks in inflation in the tenth year.
The impulse responses reveal that money supply and domestic credit to private sector have positive relationship with real GDP and inflation in Ghana. On the other hand, the impulse responses reveal that lending rate and USD exchange rate have negative relationship with real GDP and inflation in Ghana.
5.2 CONCLUSIONS:
The principal objective of this study is to examine the effectiveness of monetary policy in managing inflation and output in Ghana using the technique of vector autoregression. Theoretical and empirical foundations were established to ensure that results obtained could be interpreted within conventional research requirements. A number of revelations emerged from the study.
The analysis and findings reveal that broad money supply and lending rate are important sources of real GDP and inflation fluctuations in Ghana but money supply has more impact than lending rate at least over the sample period under study.
Since the broad money (M2) is one of the announced operating targets of the Central Bank of Ghana, shocks to the broad money supply and lending rate were identified as monetary policy innovations. The granger causality, the impulse response functions (IRFs) and the forecast error variance decomposition (FEVD) reveal that real GDP reacts immediately and significantly to expansionary money supply shock in Ghana.
Also, the lending rate channel appears to be strong for transmitting price level disturbances in Ghana. Finally, the analysis reveal that the exchange rate and domestic credit channels are not important sources of real GDP and inflation fluctuations in Ghana at least over the sample period under study.
The study reveals a high inflation rate in Ghana as a result from expansionary monetary policy.
RECOMMENDATIONS AND POLICY IMPLICATIONS:
Ameliorating the performance of these channels will be so imperative for a successful transition to a full-fledged inflation targeting monetary policy framework in Ghana. Though the Bank of Ghana has come a long way in developing the whole arsenal instruments of monetary policy, there are still some limitations. The following recommendations are, therefore, adduced.
modestly positive effects on real GDP. The implication is that a more expansionary monetary policy is both feasible and can have positive impacts on real GDP without having significantly negative effects on inflation and economic growth. To this effect, Ghanaian authorities need to implement a set of policies geared towards improving investment efficiency and bolstering consumption. In addition to this, other complementary policies such as vibrant financial market policies might be helpful as well. In this direction, an establishment of strong primary and secondary bonds markets that can also increase the efficiency of monetary policy and reduce the government‘s need to rely on the central bank for direct financing is highly recommended.
2. Using the credit tool, The Bank of Ghana should loosen its credit ceilings to support credit expansion for economic growth as done in India. This will result in a more rapid expansion in credit which can lead to somewhat more rapid real GDP growth. The Bank of Ghana should develop a more active approach to credit policies to support lending by micro finance institutions and rural banks to ensure effectiveness of the credit channel. This will ensure higher integration of economic agents in the banking system.
3. The interest rate (lending rate) should be more liberalized so that it can reflect the supply and demand of the money market better. Interest rate should be controlled in a more responsive way to catch up with inflation rate as well as to mitigate bad effects on the economy. Increasing rate of inflation should accompany increase in lending rates and vice versa. The Bank of Ghana should also see to it that there is a strong correlation between the prime rate and commercial banks interest rates. The sizable structural excess reserves of the banking system should be removed using sales of longer maturity securities and foreign exchange operations. It is recommended that, Bank of Ghana should reduce the lending (interest) rate in order to reduce the demand for credit.
4. The Bank of Ghana should continue enticing reputable foreign banks, especially Asia Banks, into
the Ghanaian market with a view to importing banking expertise, increasing competition and efficiency of bank operations and lowering interest rate spreads among commercial banks. In the medium term, this is capable of enforcing the deepening of financial intermediation which will be crucial to strengthening the interest rate and bank lending channel.
5. Sound banking system in Ghana: The high interest rate as well as the inflation rate has affected
the activities in the banking sector of Ghana.
7. The increasing monetary policy rate has affected the economic variables negatively in Ghana
REFERENCES:
Ahmed, E. M. A., &Sulima, Z. S. (2011). Long-run relationship between money supply, real GDP and
price level: Empirical Evidence From Sudan. Journal of Business Studies Quartely.ISSN 2152-1034.
Adu, A. L., &Adu, G., (2016). An empirical analysis of the determinants of interest rates in Ghana.Journal of Africa Business, 17, 3.
Akosah, N. K., &Dasah, J.B., (2016).Unconventional monetary policy in emerging
markets.Macroeconomics and Finance in Emerging Market Economies 9, 2.
Akosah, N.K. (2015). Is the monetary policy rate effective? Recent Evidence from Ghana.Graduate
Institute of International and Development Studies International Economics Department
Working Paper Series Working Paper N IHEIDWP14-2015.
Akosah, N.K., &Dasah, J.B., (2016). Is monetary policy effective in dampening fiscal induced exchange
market pressures? Evidence From Ghana. Taylor and Francis Journals Macroeconomics and
Finance in Emerging Market Economie, 9, 2, 148-166.
Alex, H., & Innes, M. (2006).The relationship between interest rates and inflation in South Africa,
Revisiting Fishers’ Hypothesis.Euro Journals Publishers Inc.
Appleyard, D.R., & Field Jr.A.J., L.S (2006). Cobb International Economics(5th ed.), McGraw Hill/Irwin,
NY USA, New York (2006).
Albuquerque, C.R., & Portugal, M.S. (2005). Exchange rate & inflation: A Case of Sulkiness of Volatility, UFRGS, Department of Economy, Text for Discussion No: 2005/1.
Ajayi, S.I. (1974). An economic case study of the relative importance of monetary and fiscal policy in
Nigeria, Bangladesh Economic Review, 2(2), pp.559-576
Ajisafe, R.A &Folorunsho, B.A. (2002).The relative effectiveness of fiscal and monetary policy in
macroeconomic management in Nigeria, The African Economic and Business Review, 3(1). Spring
Abdul, Q. (2006). Money, inflation and growth in Pakistan, The Pakistan Development Review, 203-212.Pakistan Institute of Development Economics.
Ambreen, F. &Azhar, I. (2003). The relative effectiveness of monetary and fiscal policies: An
Econometric Study. Pakistan Economic and Social Review, 1&2, 93-116.
Al- Mashat, R. &Billmeier, A. (2007).The Monetary Transmission Mechanism in Egypt, IMF Working
Paper No.WP/07/287.International Monetary Fund.
Adebiyi, M.A., (2006). Financial sector reforms and the transmission mechanism of monetary policy
in Nigeria: A vector auto-regression mechanism, China Finance Research Network (CFRN). Andoh, S. K., & Chappell, D. (2002). Stability of the money demand function: evidence fromGhana,
Applied Economics Letters, 9(13), 875-78.
Abhishek D., Arpita G., and Gautam G. (2015).Role of monetary policy in a New Keynesian economy:
a note from a laboratory experiment, Journal of Macroeconomics and Finance in Emerging Market
Economies, 9, 2, 204-216.
Ashima, G. (2012). Uncoventional monetary policy in emerging markets.Taylor & Francis Journals: Macroeconomics and Finance in Emerging Market Economies, 9, 2, 101-108.
Alexander et al, (1995).The Adoption of Indirect Instruments of Monetary Policy.IMF Occassional
Paper, Washington.International Monetary Fund, 126 (1995).
Barro, R. J. (1996). Determinants of Economic Growth: A Cross-Country Empirical Study, Cambridge,
MA: MIT Press.
Berument, M. H., Denaux Z. &Yalcin Y., (2012). Turkish monetary policy and components of
aggregate demand: a VAR analysis with sign restrictions model, Applied Economics, 44:36,
4787-4798
Bruno, M., & William, E. (1998).Inflation crises & long-run growth.Journal of Monetary Economica,
41, 3-26.
Berument, H. (2007). Measuring monetary policy for a small open economy: Turkey.Journal of
Macroeconomics, 29(2), 411-430.
Ben, S. B., & Mark G. (1995).Inside the black box: The credit channel of monetary policy transmission.
The National Bureau of Economics Research (NBER), working paper No. 5146.
Bernanke, B., Laubach, T., Mishkin, F., & Posen, A. (1999).Inflation targeting: lessons from the international experience, Princeton University Press.
Bacchetta, P., &Ballabriga F. (2000). The impact of monetary policy and banks’ balance sheets:Some
Bogunjoko, J.O. (1997). Monetary dimension of the Nigeria economic crisis; Empirical evidence from
a co-integrated paradigm, Nigeria Journal of Economics and Social Studies, 39(2): 145 – 167.
Bawumia, M., Abradu-Otoo P. &Amoah B. (2003).An investigation of the transmission mechanism of


![Table 4.6: Variance Decomposition of Base Model [Ordering reflects Cholesky ordering]](https://thumb-us.123doks.com/thumbv2/123dok_us/8132351.2156804/13.892.107.798.707.1167/table-variance-decomposition-model-ordering-reflects-cholesky-ordering.webp)
