1.INTRODUCTION
At present, there are many methods for slope stability analysis, mainly including qualitative analysis method (graphic method and analogy method), quantitative analysis method (limit equilibrium method and numerical analysis method), non-deterministic analysis method (fuzzy analysis and evaluation method and reliability analysis method) [4]. And for the slope safety factor, many scholars use the quantitative analysis method [12]. The traditional limit equilibrium method does not take into account the stress-strain relationship in the soil mass, so it cannot simulate and analyze the deformation or even damage process of the soil mass. With the development of computer technology, the numerical calculation method has been widely used in slope stability analysis. Its greatest advantage is that it can analyze a geometry of any shape and that it can do both linear and non-linear analysis. In other words, the finite element method not only takes into account the equilibrium conditions of the soil mass, but also considers the stress-strain relationship of the material, and the result is more accurate [9] [14]. Griffiths and lane (1999) compared various values in the calculation of safety factor by the finite element method and the limit equilibrium method and concluded that, to estimate the slope safety factor, the finite element method was more reliable [11]. In this paper, based on ANSYS software, we adopt the finite element strength reduction method to carry out slope analysis and then evaluate its stability.
2.THEORIES ABOUT THE FINITE ELEMENT
STRENGTH REDUCTION METHOD
2.1 Principle of the finite element strength reduction method
Duncan (1996) pointed out that the slope safety factor could be defined as the degree to which the shear strength of the soil is reduced when the slope is in critical state of failure [10]. When this kind of strength reduction technology is applied to the finite difference method, it can be expressed as follows: keep the gravitational acceleration of the rock mass constant, and gradually reduce the shear strength index by dividing the C and φ value through the reduction factor K to obtain a new set of strength indices Ci and φi, and repeat the calculation until
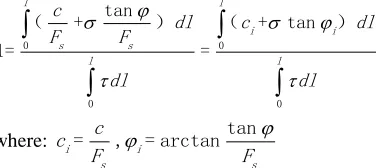
the slope reaches the critical state of failure[1] [2] [13]; at this point the ratio of the strength index used to the original strength index of the rock-soil mass is regarded as the safety factor of the slope. The formula is as follows:
0 0
0 0
( + tan )
= =
l l
f
s l l
dl c dl
F
dl dl
(1)
With both sides divided by Fs, the above equation is changed into:
ENVIRONMENTAL
AND
EARTH
SCIENCES
RESEARCH JOURNAL
ISSN: 2369-5668 (Print), 2369-5676 (Online) Vol. 4, No. 3, September 2017, pp. 60-65 DOI: 10.18280/eesrj.040302
Licensed under CC BY-NC 4.0
A publication of IIETA
http://www.iieta.org/Journals/EESRJ
Finite element strength reduction analysis on slope stability based on ANSYS
Bingbing Chen
College of Construction and Engineering, Jilin University 130026, China
Email: [email protected]
ABSTRACT
In this paper, we introduce a slope stability analysis method based on the finite element strength reduction method and discuss the basic principle of this method, physical significance of the safety factor, selection of yield criteria and criteria for slope failure. In the instance, we continuously reduce the slope strength parameter and then substitute it into the finite element program for slope stability calculation until the calculation does not converge. By this point, the reduction factor is the safety factor of the slope. The results show that, when the reduction factor keeps increasing and reaches a certain value, the plastic strain in the slope starts from the bottom to the top, putting the slope under the ultimate state. At this point, the reduction factor is the safety factor. The finite element strength reduction method is very applicable to slope stability analysis.
0 0 0 0 tan( + ) ( + tan )
1= =
l l
i i
s s
l l
c
dl c dl
F F
dl dl
(2)
where: i= ,i= arctantan
s s
c c
F F
c: cohesive force of the rock-soil mass; φ: internal friction angle of the rock-soil mass; Fs: reduction factor; ci: cohesive force of the rock-soil mass after the reduction; 𝜑𝑖: internal friction angle of the rock-soil mass after the reduction; The left side of the equation is 1, indicating that when the strength is divided by Fs, the slope enters the critical state. When slope stability is analyzed by this method, usually the non-convergence of the solution is regarded as the failure criterion. First, we select the initial reduction factor and reduce the strength parameter of the soil mass by this factor, and then input the reduced parameter for finite element calculation. If the program converges under the convergence criterion designated by the user, it means the soil mass is still stable; and then we increase (or decrease) the reduction factor until the soil mass reaches the critical state. At this point, the reduction factor Fs is the stability factor of the slope, and the sliding plane is the actual sliding plane. In the elastic-plastic finite element analysis, we first set the reduction factor Fs at a small value to make sure it is almost an elastic problem at the beginning. Then we gradually increase the reduction factor Fs and repeat the slope analysis until Fs is increased to a certain value, putting the slope in the critical state.
The advantage of this method is that it can calculate the slope safety factor without having to make assumptions about the form and position of the sliding plane, and that it can also obtain the stress and deformation of each unit in the slope and locate the failure region of the soil mass so that the location of the failure plane can be roughly determined; Except that the following assumptions are retained: (1) the reduction in material strength parameters does not affect other properties of the material; (2) although the finite element analysis adopts the small deformation theory, it is still assumed that the calculated large displacement δ is effective, at least just after the inflection point.
2.2 Yield criteria
In this paper, the ideal elastic-plastic model is used for the soil relationship in the finite element analysis. At present, the widely used finite element software ANSYS as well as the MSC MARC, PATRAN and NASTARAN all use the D-P (Drucker-Prager) yield criterion. In 1952, Drucker and Prager proposed a new yielding criterion, where the yield surface is a regular conical surface, and the section line on the surface is a circle [3] [5] [6] [7]. The yield function is expressed as:
2
= 1+ - =0
F I J (3)
where:
2 2 2
2 1 2 1 3 2 3
1
= ( - )+( - )+( - ) 6
J
1 2 3 = + + 1I
2 sin = 3(3+sin ) 2 3 cos = 3 3+ sin
c
where: I1 is the first stress invariant, J2 is the deviatoric tensor of the second stress, and c and φ are the shear strength indices. In the elastic-plastic finite element analysis on the soil mass, the strength indices are obtained from the triaxial test. The stress history of the soil mass is not considered.
2.3 Criteria for slope instability
A key problem in the analysis of slope stability using the finite element strength reduction method is how to determine whether the slope is in the general failure state based on the finite element calculation results. At present, there are several criteria for soil failure: (1) the non-convergence of the finite element static force equilibrium is regarded as the sign for the overall slope instability; (2) the plastic zone (or equivalent plastic strain) appearing from the foot to the top of the slope is regarded as the sign for the overall slope instability; (3) the sign for soil failure is the infinite movement of the sliding mass; at this time, the strain and displacement on the soil sliding surface mutate and develop infinitely. According to the studies conducted by YiRenZheng et al., the above (1) (3) are consistent [15]. Therefore, we can determine whether the soil fails by checking if the finite-element numerical calculation is convergent or the plastic strain and displacement mutate on the sliding surface.
3.INSTANCE ANALYSIS
In the finite element analysis of slope stability, the main physical parameters of the slope to be considered include volume weight γ, elastic modulus E, Poisson’s ratio μ, shear strength and tensile strength [16] [17]. In this paper, we select a
mine as an example for slope analysis, which involves both elastic and elastic-plastic materials. The slope size is shown in Fig.1, and the properties of the surrounding rock of the slope are listed in Table 1. We calculate and analyze the stability of the slope by the strength reduction method, calculate the safety factor and evaluate its stability.
3.1 Modelling
Figure 2. Finite element meshing
The boundary range of the model will have an effect on the slope stability analysis. The empirical results show that the sphere of influence of the slope is within 2 times the slope height, so the calculation zone is extended horizontally by 2 times the slope height and vertically by 3 times the slope height on the basis of the slope body. The specific dimensions
are shown in Figure 1. The software used is ANSYS12.0. Considering that the slope is an entity with a large aspect ratio, it can be simplified as a plane strain problem. It is assumed that the external force on the slope does not change with the Z axis, and that both the displacement and strain occur in the plane; the soil material is simulated by the two-dimensional solid structure unit 8-node PLANE82; due to the non-linear deformation characteristic of the soil material, this paper uses the ideal elastic-plastic DP model. Quadrangles are used in the element meshing of the finite element model, which is shown in Fig.2.
3.2 Model assumptions
The slope model considers the ideal elastic-plastic material. The normal constraint X is set at both ends of the model, and the vertical constraint Y is set at the bottom. The rotation direction is not considered. The surface is a free surface. The rock gravity is used to simulate the initial ground stress. The model is simplified into a 2-D solid plane model, to be solved according to the large displacement static mode; the convergence conditions are default force and torque convergence conditions.
3.3 Analysis of the calculation results
Table.1 Parameter table for the surrounding rock in the slope model
Category Elastic modulus (Gpa)
Poisson’s ratio
(µ) Unit weight (KN/m
3) Coesive force (Mpa)
Infriction angle φ(°) Surrounding rock 2
(elastic-plastic) 30 0.25 25 0.9 42 Surrounding rock 2
(elastic) 32 0.24 27 / /
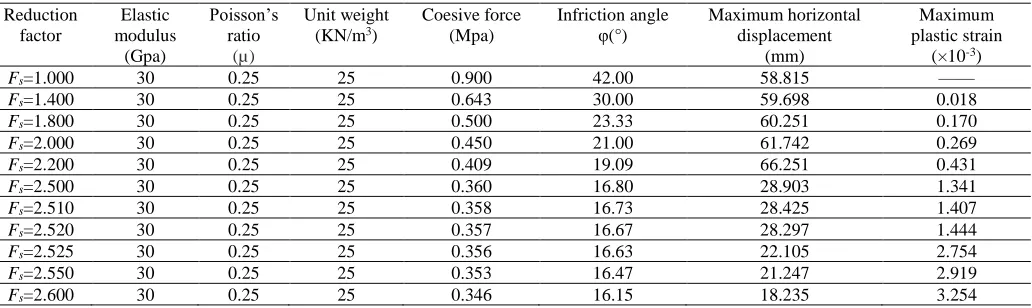
Table.2 Analysis of the finite element calculation results of the slope
Reduction factor
Elastic modulus
(Gpa)
Poisson’s ratio
(µ)
Unit weight (KN/m3)
Coesive force (Mpa)
Infriction angle
φ(°) Maximum horizontal displacement (mm)
Maximum plastic strain
(×10-3) Fs=1.000 30 0.25 25 0.900 42.00 58.815 —— Fs=1.400 30 0.25 25 0.643 30.00 59.698 0.018 Fs=1.800 30 0.25 25 0.500 23.33 60.251 0.170 Fs=2.000 30 0.25 25 0.450 21.00 61.742 0.269 Fs=2.200 30 0.25 25 0.409 19.09 66.251 0.431 Fs=2.500 30 0.25 25 0.360 16.80 28.903 1.341 Fs=2.510 30 0.25 25 0.358 16.73 28.425 1.407 Fs=2.520 30 0.25 25 0.357 16.67 28.297 1.444 Fs=2.525 30 0.25 25 0.356 16.63 22.105 2.754 Fs=2.550 30 0.25 25 0.353 16.47 21.247 2.919 Fs=2.600 30 0.25 25 0.346 16.15 18.235 3.254
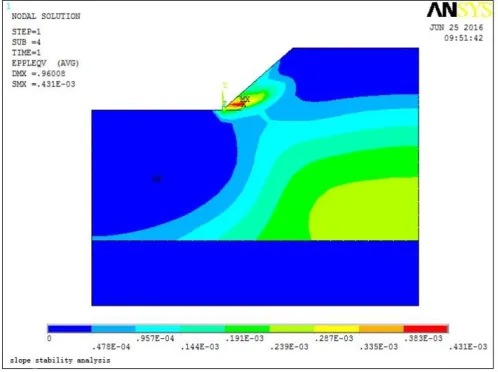
In the process of stability analysis with ANSYS, we gradually increase the reduction factor Fs, to make the calculation results converge. The reduction factor is set as Fs=1.000, 1.400, 1.800, 2.000, 2.200, 2.500 and 2.600, respectively. We substitute it in the finite element program for simulation and calculation. When Fs=1.000, the maximum deformation of the slope in the X direction is 58.815mm, and the slope has not yet experienced any plastic strain, which means the slope is in a stable state. We continue to increase the reduction factor and observe the displacement nephogram in the X direction and the plastic strain nephogram. With Fs increasing, the horizontal displacement and the plastic strain
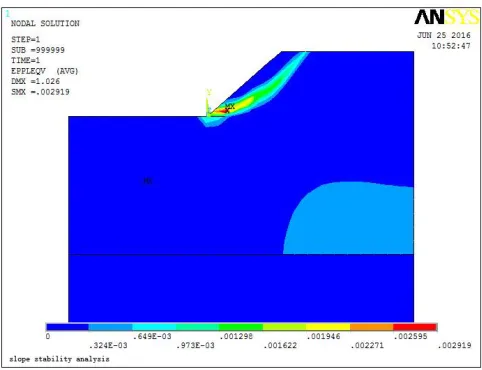
gradually increase. When Fs=2.200, the horizontal displacement increases to the maximum, and the plastic strain continues to increase; when Fs=2.500, the horizontal displacement drastically decreases to 28.903mm, and the plastic strain sharply increases to 1.341˟10-3; when Fs=2.600,
shown in Fig.3-6 and the variation trend of the plastic deformation of the slope is shown in Fig.7-10.
Figure 3. Displacement nephogram in the horizontal X direction when Fs=1.000
Figure 4. Displacement nephogram in the horizontal X direction when Fs=2.200
Figure 5. Displacement nephogram in the horizontal X direction
when Fs=2.520
Figure 6. Displacement nephogram in the horizontal X direction when Fs=2.525
Figure 7. Slope plastic strain nephogram when Fs=1.000
Figure 9. Slope plastic strain nephogram when Fs=2.520
Figure 10. Slope plastic strain nephogram when Fs=2.525
4. CONCLUSIONS AND RECOMMENDATIONS
Based on the above analysis, we summarize our conclusions and recommendations as follows:
(1) From the variation trend of the horizontal displacement of the slope, it can be seen that the displacement changes greatly with the strength reduction factor Fs. At the beginning, when Fs increases, the horizontal displacement increases slowly. When Fs=2.200, the horizontal displacement increases to the maximum; when Fs=2.500, the horizontal displacement drastically decreases; when Fs=2.600, the horizontal displacement of the slope model decreases to 18.235mm, indicating that the slope has failed.
(2) From the variation trend of the plastic strain of the slope, the plastic strain increases with the strength reduction factor Fs. The plastic strain and plastic zone increase gradually from 0. When Fs=2.525, the plastic zone has run through most of the slope body. Therefore, the safety factor of the slope is 2.525.
(3) Compared with general methods, when solving the slope stability problem, the finite element method considers the stress-strain relationship of the rock mass, which can truly reflect the working state of the rock-soil mass and make the calculation results more reliable; what is more, the overall and
global failure of the slope can be simulated without using the slicing method and making assumptions about the sliding plane.
(4) When the non-convergence of the finite element static force equilibrium is regarded as the sign for the overall slope instability, the reduction factor itself is just the stability factor in the traditional sense. We analyze the structural stability through strength reduction until it reaches the critical state, and the reduction factor at this ponit is the required safety factor. For geotechnical workers, determining slope failures based on horizontal displacement changes and plastic deformation zone is easy to understand and convenient to use. Compared with other methods, this method has higher accuracy and smaller discreteness, and thus it is worth promoting.
REFERENCE
[1] Sun Z.C. (2017). Slope stability analysis based on ANSYS and the strength reduction method, Journal of WuYi University(Nature Science Edition), Vol. 31, No. 1, pp. 65–69.
[2] Zhao S.Y., Zheng Y.R., Shi W.M. (2002). Analysis on safety factor of slope by strength reduction FEM, Chinese Journal of Geotechnical Engineering, Vol. 24, No. 3, pp. 343–346.
[3] Deng C.J., He G.J., Zheng Y.R. (2006). Studies on Drucker-Prager yield criterions based on M-C yield criterion and application in geotechnical engineering, Chinese Journal of Geotechnical Engineering, Vol. 28, No. 6, pp. 735–739.
[4] Yu M.H., Zan Y.W., Fan W. (2000). Advances in strength theory of rock in 20 century, Chinese Journal of Rock Mechanics and Engineering, Vol. 19, No. 5, pp. 487–490.
[5] Su J.H., Wang Z.X., Ren W.M. (2003). Study and application of yield criteria to rock and soil, Engineering Mechanics, Vol. 20, No. 3, pp. 72–77. [6] Revilla J., Castillo E. (1977). The calculus of variation
applied to stability of slope, Geotech, Vol. 27, No. 1, pp. 1–11.
[7] Chen Z.Y., Morgenstern N.R. (1983). Extensions to the generalized method of slices for stability Analysis, Canadian Geo Technical Journal, Vol. 20, No. 1, pp. 104–119.
[8] Chen Z.Y. (1992). Random trials used in determining global minimum factors of safety of slopes, Geotech, Vol. 29, pp. 225–233.
[9] Matsui T., San K.C. (1992). Finite element slope stability analysis by shear strength reduction technique, Soil and foundations, Vol. 32, No. 1, pp. 59–70. [10] Duncan J.M. (1996). Limit equilibrium and finite
element analysis of slopes, Journal of Geo Technical Engineering, Vol. 122, No. 7, pp. 577–595.
[11] Griffiths D.V., Lane P.A. (1999). Slope stability analysis by finite elements, Geo technique, Vol. 49, No. 3, pp. 387–403.
[12] Jie H., Dov Leshchinsky. (2004). Limit equilibrium and continuum mechanics-based numerical methods for analyzing stability of MSE Walls, 17th ASCE Engineering Mechanics Conference, pp. 1–8.
[14] Kavanagh K.T., Clough R.W. (1972) Finite element application in the characterization of elastic solids, Int J solids structures, No. 7, pp. 11–23.
[15] Zheng R.Z., Zhao S.Y., Song Y.K. (2005) Advance of Study the Strength Reduction Finite Element Method, Journal of Logistics Engineering College, Vol. 3, pp. 01–06.
[16] Jiang J.C., Yamagaini T. (2006) Charts for estimating strength parameters from slips in homogeneous slopes, Computers and Geotechnics, Vol. 33, pp. 294–304. [17] Jiang J.C., Yamagaini T. (2008) A new back analysis of