129
© 2017 by the Serbian Biological Society How to cite this article: Vlatković V, Trbojević-Stanković J, Nešić D, Stojimirović B. A novel complex model of hemodialysis adequacy: predictive value and relationship with malnutrition-inflammation score. Arch Biol Sci. 2017;69(1):129-37.
A novel complex model of hemodialysis adequacy: predictive value and relationship with
malnutrition-inflammation score
Vlastimir Vlatković1,*, Jasna Trbojević-Stanković2,3, Dejan Nešić3,4 and Biljana Stojimirović3,5
1 Department of Nephrology with Plasmapheresis, Internal Medicine Clinic, University Clinical Center Republika Srpska and
Faculty of Medicine, University of Banja Luka, Republika Srpska
2 Department of Hemodialysis, Clinic of Urology, University Clinical Center “Dr Dragiša Mišović – Dedinje”, Belgrade, Serbia 3 School of Medicine, University of Belgrade, Belgrade, Serbia
4 Institute of Medical Physiology, Belgrade, Serbia
5 Clinic of Nephrology, Clinical Center of Serbia, Belgrade, Serbia
*Corresponding author: [email protected]
Received: February 29, 2016; Revised: March 12, 2016; Accepted: March, 13, 2016; Published online: October 10, 2016
Abstract: Target dialysis dose to ensure the best patient outcome is still a matter of debate. Traditional models have a num-ber of limitations and do not comprehensively reflect all factors involved. In this study we present a new complex model of dialysis adequacy, the hemodialysis adequacy score (HAS), and evaluate its prognostic value, as well as its relationship with the malnutrition-inflammation score (MIS). The components of HAS included paradigms of the 6 major factors known to influence the outcome of hemodialysis (HD) patients: the modified Karnofsky index (KI), the Charlson comorbidity index (CCI), Kt/V and URR measures of dialysis dose, body mass index (BMI) and serum albumin level, serum levels of hemoglobin and ferritin, intact parathyroid hormone (iPTH) and calcium-phosphorus solubility product. The score was evaluated in a 24-month prospective study on 147 HD patients. Odds ratio analysis showed that hospitalized patients had twice the chance to have HAS >13 compared to those who were not hospitalized during the study period (OR=2.152, CI 95% (1.0024-4.619). Mortality rate was significantly higher in patients with a HAS >13 at the 12-month follow-up (χ2=16.416, p <0.0001). Patients with a HAS≤13 had significantly higher survival rate (Kaplan-Meier), while those with a HAS>13 had significantly higher probability of death (log-rank Cox-Mantel=17.920, df=1, p <0.00023). The HAS directly and significantly correlated with the MIS at all measurements (p <0.0001). Results confirmed that the HAS is a useful tool to assess dialysis adequacy with a good prognostic value. The cutoff level for the HAS at 13 points was associated with an unfavorable outcome.
Key words: adequacy; hemodialysis; malnutrition-inflammation; model; score
INTRODUCTION
Introducing hemodialysis (HD) in the treatment of end-stage renal failure has helped preserving the lives of millions of end-stage renal disease patients. From the beginning of the dialysis era, the issue of target dialysis dose to ensure the best patient outcome has been a matter of debate. In the last decades, with ad-vances in technology, adequate dialysis should pro-vide a good general condition and quality of life, low morbidity and mortality rate, and social independence for patients [1]. It is, therefore, of great importance to accurately define and quantify the delivered dialysis dose in a reproducible manner.
function, which has a significant impact on patient outcome. Secondly, they ignore the role of ultrafiltra-tion and mass transfer between body compartments, and finally, they only rely on the measurement of urea and ignore larger molecules that have diffusion-limited transport [2]. The HEMO and ADEMEX studies have actually proved that further increases in dialysis dose, as expressed by the Kt/V index, in patients with good clearance of small molecules, has virtually no signifi-cant influence on lowering mortality [3,4].
Recent studies have shown that besides the effi-ciency of the dialysis procedure itself (clearance of small molecules, ultrafiltration rate), dialysis adequacy is influenced by a number of factors dependent on the patient and underlying renal disease − nutritive status, protein catabolism rate, anemia and blood pressure control, inflammation and overall health status [5]. Namely, malnutrition, inflammation and atheroscle-rosis, the components of malnutrition inflammation complex syndrome (MICS), have been recognized to independently influence HD patients’ morbidity and survival [6]. Thus, after achieving the optimal dialy-sis dose, as defined by the urea kinetic model, other factors, and especially MICS, can have significant influence on the final outcome. This complexity has precluded the design of a universal and simple model of dialysis adequacy.
In this study we hypothesized that combining pa-rameters that have been individually used to assess dial-ysis adequacy, the level of MICS and patient functional status, would produce a more comprehensive and more reliable model, with better predictive value. With this purpose, a new complex model of dialysis adequacy, the hemodialysis adequacy score (HAS), has been cre-ated. The aim of this study was to evaluate reliability of HAS in assessing dialysis adequacy and its prognostic value, as well as its relationship with the malnutrition-inflammation score (MIS), as a measure of MICS.
MATERIALS AND METHODS
Patients
The data necessary to evaluate HAS were collected in a prospective study conducted over a period of 24 months, which included patients treated for chronic
HD in the Hemodialysis Center in Banja Luka, Re-publika Srpska. All patients gave their informed con-sent to participate and the study was performed in accordance with the Helsinki Declaration. Out of 150 patients initially enrolled, 147 completed the study (63 females and 84 males, average age 55.09±12.93 years). The exclusion criteria were time on dialysis less than three months, less than 3 HD sessions per week and previous limb amputation. During the follow-up period, the patients were thoroughly examined and detailed laboratory analyses were performed at base-line and each sixth months. The HAS was determined at baseline and after a 12-month follow-up.
Hemodialysis adequacy score (HAS)
The components of HAS included paradigms of the 6 major factors known to influence the outcome of HD patients: the modified Karnofsky index (KI) to assess patients’ functional status, the Charlson comorbidity index (CCI) to assess comorbidities (without adding points for age), dialysis dose expressed by the Kt/V and URR measured by single-pool technique, nutri-tional status assessed by the body mass index (BMI) and serum albumin level, anemia control expressed by the serum levels of hemoglobin and ferritin, and calcium and phosphate metabolism assessed by the level of intact parathyroid hormone (iPTH) and calci-um-phosphorus solubility product (Ca×P) [7-9]. The
number of points assigned to each component varied from 0, representing achievement of the optimal val-ues, to 6, indicating unsatisfactory results and poor outcome. The only exception was the comorbidity as-sessment, where the number of points could have been higher than 6. The sum of points produced the final value of the HAS as a predictive model. The higher the HAS value, the poorer the prognosis, and vice versa.
Blood samples analyses
de-termined by the microparticle enzyme immunoassay (MEIA) technique on an IMx apparatus (Abbott). The reference values for HD patients were 400-600 ng/mL according to the European Best Practice Guidelines for Hemodialysis [10]. An Alcyon apparatus (Abbott) was used to determine serum urea by the urease-glu-tamate-dehydrogenase method (reference values in the general population 2.6-6.7 mmol/L for women and 3.2-7.3 mmol/L for men); serum albumin levels by spectrophotometric bromocresol green method (reference range for the general population 32-52 g/L, minimum recommended level for HD patients 40 g/L); total serum calcium (reference range for the general population 2.25-2.7 mmol/L) and phospho-rus levels (reference range for the general population 0.84-1.45 mmol/L) by photometry. Serum iPTH was determined on an autogenous counter (CIS, France) by the ELISA-PTH method as described [11].
Body mass index (BMI) and urea reduction ratio (URR)
The BMI was calculated according to the Quetelet formula [12,13]. The URR was calculated according to the following equation:
% 100
× −
=
Upre Upost Upre
URR ,
where Upre is the predialysis urea level and Upost is the postdialysis urea level.
Kt/V was calculated according to the Daugirdas formula:
, ) (
5 . 3 4 008 . 0 log
/V UpostUpre t UpostUpre Wpre WpostWpost Kt =− − + − × −
where Upre is the predialysis urea level and Upost is the postdialysis urea level, Wpre is is predialysis body weight and Wpost is postdialysis body weight.
Malnutrition-inflammation score (MIS)
The MIS questionnaire comprises 10 components in four sections, including nutritional history, physical examination, BMI and laboratory values (serum al-bumins and total iron-binding capacity). Each com-ponent is given a score between 0 (normal) and 3 (se-verely malnourished) [14]. The first outcome measure
was the rate of hospitalization, evaluated by the num-ber of hospitalizations and length of hospital stay. The second outcome measure was mortality.
Statistical analysis
The results were statistically analyzed with χ-square test, one-tailed ANOVA (F test), Pearson’s correlation, Kaplan-Meier survival analysis and log-rank test using the SPSS 12.0.
RESULTS
During the two-year follow-up period, 19 (12.96%) patients died (13 men and 6 women), 2 (1.36%) patients continued HD in another center, 1 (0.68% was transferred to peritoneal dialysis and 1 success-fully underwent kidney transplant surgery. Thus, 124 (84.35%) patients (68 men and 56 women) success-fully completed the whole study. Half of the patients (74; 50.4%) were hospitalized once or more during the study period.
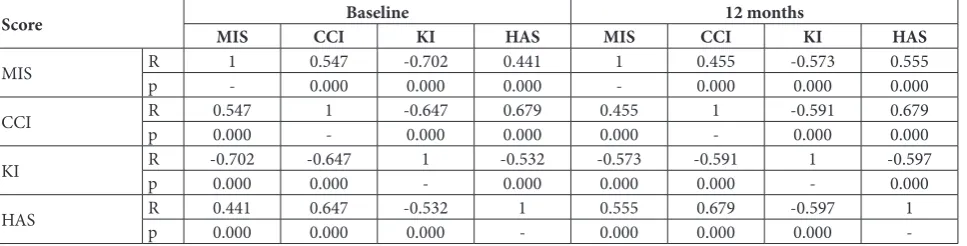
The original HAS questionnaire is presented in Table 1. The elements of the HAS and values of the MIS during the study period are shown in Table 2. The HAS was determined for 117 (79.59%) of the patients at baseline, out of which 44 (37.6%) had a HAS >13. Significantly more men had HAS >13 than women (χ2=3.974, p<0.046). The HAS directly and significantly correlated with the MIS and CCI at all measurements (p<0.0001). The HAS, MIS and CCI were significantly inversely correlated with KI during the whole follow-up period (p<0.0001). Furthermore, a significant positive correlation was found between the HAS, KI, CCI and MIS (p <0.0001) in non-hos-pitalized patients. The CCI and KI increased over the follow-up period, while the MIS showed a decrease in hospitalized patients. The strength of correlation between the HAS and the other scores increased over the follow-up period (Table 3).
Table 1. Hemodialysis Adequacy Score (HAS). 1. Functional status – modified Karnofsky Index
1.1. Able to carry on normal activity and work; minor signs of symptoms or disease; no help needed (80-100%) 0
1.2.
Unable to work; able to live at home and care for most personal needs; varying amount of assistance needed
1.2.1. Cares for self, unable to carry on normal activity ar to do active work (70%) 1
1.2.2. Requires occasional assistance but is able to care for most of his personal needs (60%) 2
1.2.3. Requires considerable assistance and frequent medical care (50%) 3 1.3. Unable to care for self,
requires equivalent of institutional hospital care, diseases may be progressing rapidly
1.3.1. Disabled; requires special care and assistance (40%) 4
1.3.2. Severely disabled; hospital admission is indicated although death not imminent (30%) 5
1.3.3. Very sick; hospital admission necessary; active supportive treatment necessary (20%) 6 2. Charlson Comorbidity Index
2.1. Myocardial infarction 1
2.2. Congestive heart failure 1
2.3. Peripheral vascular disease 1
2.4. Cerebrovascular disease (except hemiplegia) 1
2.5. Dementia 1
2.6. Chronic lung disease 1
2.7. Connective tissue disease 1
2.8. Ulcer 1
2.9. Chronic liver disease 1
2.10. Diabetes (no complications) 1
2.11. Diabetes with end organ damage 2
2.12. Hemiplegia 2
2.13. Moderate to severe kidney disease 2
2.14. Malignant tumor 2
2.15. Leukemia 2
2.16. Lymphoma 2
2.17. Moderate or severe liver disease 3
2.18. Metastasis 6
2.19. AIDS 6
3. Hemodialysis dose
3.1. spKt/V ≥1.4 spKt/V 1.2-1.3Single poolKt/V(Daugirdas)spKt/V 0.9-1.1 spKt/V≤0.8
0 1 2 3
3.2.
Urea Reduction Ratio (URR)
URR ≥75% URR 65-74% URR 60-64% URR≤60%
0 1 2 3
4. Nutritional status
4.1. BMI≥20 kg/m2 BMI 18-19.99kg/mBody Mass Index (BMI)2 BMI 16-17.99kg/m2 BMI<16 kg/m2
0 1 2 3
4.2. Serum AlbuminsAlbumins ≥40 g/l Albumins 35-39 g/l Albumins 30-34 g/l Albumins <30 g/l
5. Anemia
5.1. Hgb ≥ 110g/dl Hgb ≥100-109g/dlHemoglobin (Hgb)Hgb 76-99g/dl Hgb≤75g/dl
0 1 2 3
5.2. Fer 201-500 µg/ml Fer ≤ 200 µg/mlSerum Ferritin (Fer)Fer 500-999 µg/ml Fer ≥1000 µg/ml
0 1 2 3
6. Bone metabolism
6.1. PTH 151-299 pg/ml PTH ≤ 150 pg/mlParathormone (PTH)PTH 300-799 pg/ml PTH ≥ 800 pg/ml
0 1 2
6.2. CaxP CaxP product≤ 3 mmol2/L2 CaxP 3.1-3.9 mmol2/L2 CaxP 4-4.3 mmol2/L2 CaxP ≥ 4.4 mmol2/L2
0 1 2 3
Date: / / SUM
Table 2. Values of elements of Hemodialysis Adequacy Score and MIS.
Variable Mean ± SDBaseline Mean ± SD6 months Mean ± SD12 months Mean ± SD18 months Mean ± SD24 months
KI (%) 67.2±13.2 66.69±11.09 68.15±9.71 68.19±10.45 68.71±9.37
CCI 4.13±1.45 4.89±1.4 4.97±1.28 5.23±1.38 5.59±1.52
URR 67.04±8.11 66.8±9.12 66.55±6.66 67.04±6.81 66.94±6.91
spKt/V 1.4±0.3 1.39±0.32 1.36±0.24 1.38±0.25 1.37±0.25
BMI 22.14±3.49 22.31±3.48 22.37±3.35 22.513.17± 22.55±3.21
Albumins (g/L) 39.88±3.51 42.77±3.76 41.05±3.38 40.82±5.36 40.59±2.79
Hemoglobin (g/L) 101.81±16.07 97.47±21.91 106.15±29.21 100.67±14.37 112.09±15.79
Ferritin (ng/mL) 591.93±367.97 614.14±315.27 582.14±280.27 550.99±266.97 580.17±279.24
Ca×PO4 (mmol2/L2) 3.36±1.09 3.58±1.15 3.24±0.93 3.39±1.01 3.37±0.86
iPTH (pg/mL) 172.9±368.93 - 84.01±186.02 -
-HAS 13±4.2 - 13.02±3.53
-MIS 6.06±4.47 6.49±3.76 6.32±3.23 6±3.38 6.03±2.93
Legend: KI – Karnofsky Index, CCI – Charlson Comorbidity Index, URR – Urea Reduction Ratio, spKt/V – single-pool Kt/V, iPTH – intact parathy-roid hormone, HAS – Hemodialysis Adequacy Score, MIS – Malnutrition Inflammation Score
Table 3. Correlations between Malnutrition Inflammation Score, Charlson Comorbidity Index, Karnofsky Index and Hemodialysis Adequacy Index at baseline and after 12 months follow-up.
Score MIS CCIBaseline KI HAS MIS CCI12 monthsKI HAS
MIS Rp 1- 0.5470.000 -0.7020.000 0.4410.000 1- 0.0000.455 -0.5730.000 0.5550.000
CCI Rp 0.5470.000 1- -0.6470.000 0.0000.679 0.4550.000 1- -0.5910.000 0.6790.000
KI Rp -0.7020.000 -0.6470.000 1- -0.5320.000 -0.5730.000 -0.5910.000 1- -0.5970.000
HAS Rp 0.4410.000 0.6470.000 -0.5320.000 1- 0.5550.000 0.0000.679 -0.5970.000 1
-MIS – Malnutrition Inflammation Score, CCI – Charlson Comorbidity Index, KI – Karnofsky Index, HAS – Hemodialysis Adequacy Score; R – correlation coefficient, p – significance
baseline measurement (p<0.015). Odds ratio analysis showed that hospitalized patients had twice the chance of having a HAS >13 compared to those who were not hospitalized during the study period (OR=2.152, CI 95% (1.0024-4.619).
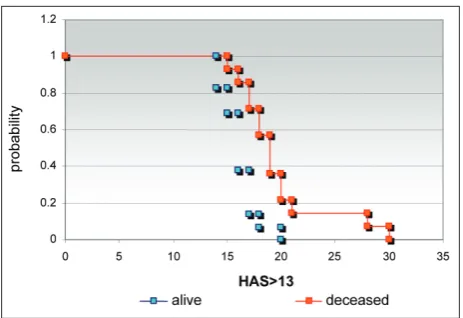
At the end of the study period, 15 patients were deceased. The mortality rate was insignificantly higher in men than in women. The HAS values at baseline were measured in 12 out of 15 of the deceased patients and 11 of those had a HAS >13. The mortality rate was significantly higher in patients with a HAS >13 at the first 12-month follow-up (χ2=16.416, p<0.0001). Kaplan-Meier survival analysis showed that patients with a HAS≤13 had a significantly higher survival rate. The survival rate decreased in patients with a higher HAS, and was just 2.1% in subjects with a HAS >18. Patients with a HAS >13 had significantly higher probability of death (log-rank Cox-Mantel=17.920, df=1, p <0.00023) (Fig. 1).
DISCUSSION
Traditionally used models to assess dialysis adequacy relied on different, single or combined, parameters known to influence the quality of the treatment. In-troducing measurements of dialysis dose (the URR and Kt/V indexes) enabled quantification and indi-vidualization of treatment, significantly contributing to quality improvement. However, besides good labo-ratory results, current dialysis treatment should pro-vide the patient with full rehabilitation, a satisfactory
nutritional status, stabilized blood pressure, anemia and bone metabolism should be under control, and prevent the development of neuropathy, resulting in low comorbidity rates and longer survival. A contem-porary, comprehensive model of dialysis adequacy would include elements previously used to assess the quality of HD treatment, as well as the presence of MICS, and would be predictive of patients’ outcome.
Previous research has shown that different param-eters, such as anemia, hyperphosphatemia and comor-bidities have significant impact on the final outcome in HD patients [15-21]. By optimizing the dialysis treatment, these parameters and the outcome can be improved. Furthermore, optimizing these variables is one of the major prerequisites to prevent MICS, which independently influences outcome in HD pa-tients [22-24].
In this study, we evaluated the predictive value of the HAS as a novel complex model to assess quality and outcome of treatment in HD patients, but also the presence and severity of MICS. The HAS was designed to include several elements previously known to ex-ert significant impact on dialysis adequacy, quality of treatment and development of MICS. The first two scores included in the HAS, the CCI and KI, assessed functional status and comorbidities in HD patients. Other elements of the HAS were chosen as determi-nants of major clinical features of end-stage renal fail-ure itself and HD treatment, which are independently related to outcome – dialysis dose, nutrition, anemia and calcium-phosphate metabolism [18,19,25,26].
The CCI and KI are known and well-validated models that have been successfully used to evaluate functional status and comorbidities in HD patients [27,28]. Previous studies have shown that comorbidi-ties are among the key predictors of morbidity and mortality rate in dialyzed patients [20,29]. The merit of the CCI and KI in predicting morbidity and mortal-ity in HD patients has been validated in a number of studies [30,31]. In order to avoid the influence of age, no points were added for seniority. Individual CCI values confirmed a high prevalence of comorbidities in our population group. The functional capacity in our study population, as determined by KI, showed significant improvement over the study period, indi-cating efficient HD treatment in surviving patients.
Dialysis dose as an element of the HAS was de-termined by referring to the URR and Kt/V indexes, which have traditionally been used as measures of HD adequacy [31]. However, several studies have shown that in patients with good clearance of small molecules, a further increase in dialysis dose has vir-tually no influence on lowering mortality, thus imply-ing that from thereon other factors may be involved [3,4]. Nonetheless, providing an adequate dialysis dose is mandatory to achieve optimum values of other im-portant parameters of HD quality. All patients in our study group received an optimum dialysis dose, based on the URR and KT/V values.
Protein-energy malnutrition (PEM) is well-known and highly prevalent among HD patients [33]. It is known to decrease functional capacity and quality of life, and increase morbidity and mortality rates in these patients [24,34]. Nutrition status as an element of the HAS has been evaluated with BMI and serum albumin levels in this study. PEM is also associated with chronic inflammation, which independently con-tributes to malnutrition in HD patients [35]. Because these two conditions often occur concomitantly in HD patients, they have been referred to together as the MICS. MICS is reported to correlate with poor outcome, including a decreased quality of life, refrac-tory anemia and significantly greater rates of hospi-talization and mortality [36]. The presence of MICS in our study population was evaluated by the MIS, as a well-established and validated score [14]. The significant correlation between the CCI, KI and MIS suggested a strong relationship between the presence of comorbidities, functional capacity and MICS. The MIS also correlated significantly with the HAS, thus implying an important connection between dialysis quality and the presence and severity of MICS.
Anemia is a major risk factor that contributes to mortality in patients with chronic kidney disease [36]. It is associated with left ventricular hypertrophy and heart failure [17,29,38]. Laboratory surrogates of iron stores, nutritional status and the delivered dose of di-alysis are predictive of hemoglobin concentration [40]. Furthermore, anemia is known to be more frequent in HD patients with MICS [37,41]. Our model of di-alysis adequacy included hemoglobin and ferritin as indices of anemia and iron stores. Serum ferritin is
also a marker of inflammation. Their levels at baseline suggested suboptimal anemia correction in our study population, but a tendency of improvement was noted during the study period.
It is a well-established fact that hyperphosphate-mia, hypercalcehyperphosphate-mia, high calcium-phosphate product and hyperparathyroidism are independent risk fac-tors for mortality in HD patients [18,19]. The dis-turbed calcium-phosphate metabolism contributes to chronic inflammatory response, progressive car-diovascular calcifications, atherosclerosis and poor anemia correction in end-stage renal disease patients [24,41]. Calcium-phosphate product and iPTH were included in the HAS. During the follow-up period, these parameters showed high variability, resulting in fluctuating bone metabolism activity, which was mirrored by the iPTH levels.
Hemodialysis patients have up to 20 times higher mortality rate than the general population, and thus, their expected survival rate is significantly lower [3,25,42]. We confirmed a significant correlation between survival rate and the level of the HAS. The probability of survival was significantly higher in HD patients with a HAS <13, but was decreased with a further increase in 13 HAS points, implying that the cutoff level for the HAS at 13 points could be associ-ated with an unfavorable outcome.
The complexity of physiological kidney functions and the HD process as a partial substitution of in-sufficient organs explains the difficulties in defining a universal and comprehensive model to assess the adequacy of dialysis therapy. The HAS, the novel com-plex model of dialysis adequacy presented and evalu-ated in this study, appears to be a reliable predictor of dialysis adequacy and outcome in HD patients, and is well associated with the MIS as a measure of MICS.
Authors’ contribution: Vlastimir Vlatković, Biljana Stojimirović and Jasna Trbojević-Stanković were responsible for the study conception and design and the drafting of the manuscript. Jasna Trbojević-Stanković and Dejan Nešić collected the literature. Vlas-timir Vlatković and Biljana Stojimirović made critical revisions to the paper. Jasna Trbojević-Stanković and Dejan Nešić provided statistical expertise.
REFERENCES
1. Nissenson AR. Improving outcomes for ESRD patients: shifting the quality paradigm. Clin J Am Soc Nephrol. 2014;9(2):430-4.
2. Mehta A. N, Fenves A. Z. Hemodialysis adequacy: A review. Dialysis Transplant. 2010;39(1):1-3.
3. Rayner HC, Pisoni RL, Bommer J, Canaud B, Hecking E, Locatelli F, Piera L, Bragg-Gresham JL, Feldman HI, Good-kin DA, Gillespie B, Wolfe RA, Held PJ, Port FK. Mortal-ity and hospitalization in haemodialysis patients in five European countries: results from the dialysis outcomes and practice patterns study (DOPPS). Nephrol Dial Transplant. 2004;19:108-20.
4. Pecoits-Filho R, Lindholm B, Stenvinkel P. The malnutrition, inflammation, and atherosclerosis (MIA) syndrome – the heart of the matter. Nephrol Dial Transplant. 2002;17(Suppl 11):28-31.
5. Grangé S, Hanoy M, Le Roy F, Guerrot D, Godin M. Moni-toring of hemodialysis quality-of-care indicators: why is it important? BMC Nephrol. 2013;14:109.
6. Choi MJ, Seo JW, Yoon JW, Lee SK, Kim SJ, Lee YK, Noh JW, Koo JR. The malnutrition-inflammation-depression-arte-riosclerosis complex is associated with an increased risk of cardiovascular disease and all-cause death in chronic hemo-dialysis patients. Nephron Clin Pract. 2012;122(1-2):44-52. 7. Crooks, V, Waller S, Smith T, Hahn TJ. The use of the Kar-nofsky Performance Scale in determining outcomes and risk in geriatric outpatients. J Gerontol. 1991;46:M139-M144. 8. Di Iorio B, Cillo N, Cirillo M, De Santo NG. Charlson
comorbidity index is a predictor of outcomes in incident hemodialysis patients and correlates with phase angle and hospitalization. Int J Artif Organs. 2004;27(4):330-6. 9. Uhlin F, Fridolin I, Magnusson M, Lindberg L-G. Dialysis
dose (Kt/V) and clearance variation sensitivity using mea-surement of ultraviolet-absorbance (on-line), blood urea, dialysate and ionic dialysance. Nephrol Dial Transplant. 2006;2:2225-31.
10. Locatelli F, Covic A, Eckardt K-U, Wiecek A, Vanholder R. Anaemia management in patients with chronic kidney dis-ease: a position statement by the Anaemia Working Group of European Renal Best Practice (ERBP). Nephrol Dial.Trans-plant. 2009;24(2):348-54.
11. Goldsmith DJ, Covic A, Fouque D, Locatelli F, Olgaard K, Rodriguez M, Spasovski G, Urena P, Zoccali C, London GM, Vanholder R. Endorsement of the Kidney Disease Improving Global Outcomes (KDIGO) Chronic Kidney Disease-Min-eral and Bone Disorder (CKD-MBD) Guidelines: a Euro-pean Renal Best Practice (ERBP) commentary statement. Nephrol Dial Transplant. 2010;25(12):3823-31.
12. De Palma JR, Pittard JD. Body mass index and uremia (Part I). Dial Transplant 2002;31(5):342-50.
13. De Palma JR, Pittard JD. Body mass index and uremia (Part II). Dial Transplant 2002;31(6):420-32.
14. Kalantar-Zadeh K, Kopple JD, Block G, Humphreys MH. A malnutrition-inflammation score is correlated with morbid-ity and mortalmorbid-ity in maintenance hemodialysis patients. Am J Kidney Dis. 2001;38(6):1251-63.
15. de Francisco ALM, Stenvinkel P, Vaulont S. Inflammation and its impact on anaemia in chronic kidney disease: from haemoglobin variability to hyporesponsiveness. Nephrol Dial Transplant. 2009;2(Suppl 1):i18-i26.
16. Locatelli F, Pisoni RL, Combe C, Bommer J, Andreucci VE, Piera L, Greenwood R, Feldman HI, Port FK, Held PJ. Anae-mia in haemodialysis patients of five European countries: association with morbidity and mortality in the dialysis out-comes and practice patterns study (DOPPS). Nephrol Dial Transplant. 2004;19:121-32.
17. Stojimirović B, Petrović D, Obrenović R. Left ventricular hypertrophy in patients on hemodialysis: importance of anemia. Med Pregl. 2007;60(Suppl 2):155-9.
18. Jean G, Chazot C, Charra B. Hyperphosphataemia and related mortality. Nephrol Dial Transplant. 2006;21:273-80. 19. Shang D, Xie Q, Ge X, Yan H, Tian J, Kuang D, Hao CM,
Zhu T. Hyperphosphatemia as an independent risk factor for coronary artery calcification progression in peritoneal dialysis patients. BMC Nephrol. 2015;16:107.
20. van Manen JG, van Dijk PCW, Stel VS, Dekker FW, Cler-ies M, Conte F, Feest T, Kramar R, Leivestad T, Briggs JD, Stengel B, Jager KJ. Confounding effect of comorbidity in survival studies in patients on renal replacement therapy. Nephrol Dial Transplant. 2007;22:187-95.
21. Trbojević J, Odović J, Stanković J, Nešić D, Jelić R. Rela-tionship between angiotensin II receptor antagonists bio availability and molecular properties. Arch Biol Sci. 2016;68(2):273-8.
22. Caravaca F, Martin MV, Barroso S, Ruiz Belen, Hernández-Gallego R. Do inflammatory markers add predictive infor-mation of death beyond that provided by age and comorbid-ity in chronic renal failure patients? Nephrol Dial Transplant. 2006;21:1575-81.
23. Calo LA, Naso A, Carraro G, Wratten ML, Pagnin E, Bar-tipaglia L, Rebeschini M, Davis PA, Piccoli A, Cascone C. Effect of haemodiafiltration with online regeneration of ultrafiltrate on oxidative stress in dialysis patients. Nephrol Dial Transplant. 2007;22:1413-9.
24. Panichi V, Rizza GM, Paoletti S, Bigazzi R, Aloisi M, Barsotti G, Rindi P, Donati G, Antonelli A, Panicucci E, Tripepi G, Tetta C, Palla R. Chronic inflammation and mortality in hae-modialysis: effect of different renal replacement therapies. Result from the RISCAVID study. Nephrol Dial Transplant. 2008;23:2337-43.
25. Kalantar-Zadeh K, Ikizler TA. Let them eat during dialysis: an overlooked opportunity to improve outcomes in mainte-nance hemodialysis patients. J Ren Nutr 2013;23(3):157-63. 26. Trbojević-Stanković J, Odović J, Jelić R, Nešić D, Stojimirović
B. The effect of calcium channel blockers’ molecular proper-ties on elimination route. Arch Biol Sci. 2015; 67(3):801-6. 27. Lin YT, Wu PH, Kuo MC, Lin MY, Lee TC, Chiu YW, Hwang
SJ, Chen HC. High cost and low survival rate in high comor-bidity incident elderly hemodialysis patients. PLoS One. 2013;8(9):e75318.
29. Petrović D, Stojimirović B. Cardiovascular morbidity and mortality in patients treated with hemodialysis-epidemio-logical analysis. Vojnosanit Pregl. 2008;65(12):893-900. 30. Di Iorio B, Cillo N, Cirillo M, De Santo NG. Charlson
comorbidity index is a predictor of outcomes in incident hemodialysis patients and correlates with phase angle and hospitalization. Int J Artif Organs 2004; 27(4):330-6. 31. van Diepen M, Schroijen MA, Dekkers OM, Rotmans JI,
Krediet RT, Boeschoten EW, Dekker FW. Predicting mor-tality in patients with diabetes starting dialysis. PLoS One. 2014;9(3):e89744.
32. Vlatković V, Stojimirović B. Determination of the delivered hemodialysis dose using standard methods and on-line clearance monitoring].Vojnosanit Pregl. 2006;63(8):743-7. 33. Vlatkovic V, Trbojevic-Stankovic J, Stojimirovic B.
Malnu-trition-inflammation complex syndrome and hepatitis C in maintenance hemodialysis patients. Ther Apher Dial. 2009;13(2):113-20.
34. Spiegel DM, Raggi P, Smits G, Block GA. Factors associated with mortality in patients new to haemodialysis. Nephrol Dial Transplant 2007;22:3568-72.
35. Beddhu S, Pappas LM, Ramkumar N, Samore MH. Mal-nutrition and atherosclerosis in dialysis patients. J Am Soc Nephrol 2004;15:733-42.
36. Anand N, Chandrasekaran SC, Alam MN. The Malnutrition Inflammation Complex Syndrome-The Micsing Factor in
the Perio-Chronic Kidney Disease Interlink. J Clin Diagn Res. 2013;7(4):763-7.
37. Jung MY, Hwang SY, Hong YA, Oh SY, Seo JH, Lee YM, Park SW, Kim JS, Wang JK, Kim JY, Lee JE, Ko GJ, Pyo HJ, Kwon YJ. Optimal hemoglobin level for anemia treatment in a cohort of hemodialysis patients. Kidney Res Clin Pract 2015;34(1):20-7.
38. Di Lullo L, Gorini A, Russo D, Santoboni A, Ronco C. Left Ventricular Hypertrophy in Chronic Kidney Disease Patients: From Pathophysiology to Treatment. Cardiorenal Med. 2015;5(4):254-66.
39. Madore F, Lowrie EG, Brugnara C, Lew NL, Lazarus JM, Bridges K, Owen WF. Anemia in hemodialysis patients: vari-ables affecting this outcome predictor. J Am Soc Nephrol. 1997;8(12):1921-9.
40. Kalantar-Zadeh K, Rodriguez RA, Humphreys MH. Associa-tion between serum ferritin and measures of inflammaAssocia-tion, nutrition and iron in haemodialysis patients. Nephrol Dial Transplant. 2004;19(1):141-9.
41. Ketteler M, Floege J. Calcification and the usual suspect phosphate: still guilty but there are other guys behind the scenes. Nephrol Dial Transplant 2006;21:33-5.