ISSN: 2501 - 1235 ISSN-L: 2501 - 1235 Available on-line at: www.oapub.org/edu
doi: 10.5281/zenodo.1285939 Volume 4 │ Issue 7 │ 2018
THE DIFFERENCE BY AGE GROUP FOR ANTHROPOMETRICS
AND FORCE IN BODYBUILDERS
Kukeli, R., Skenderi, Dh.
Sports University of Tirana, Albania
Abstract:
Introduction: The purpose of this scientific paper is to compare the physical parameters
between the age groups as well as the force with the drop jump test. Methods: In this study, three groups of randomly selected subjects were included. 28 participants took part in the study (9 participants 18.5 years SD 2.1; 8 participants 22.7 years SD 2.4; 11 participants 29 years SD 2.9). The participants were regularly bodybuilder that took part in national championship in Albania. Drop jump test were used measuring force using a force plate. Results: The final results on this study for age category comparison show that; for body weight comparison does not represent significant changes (sig = 0.8), body height does not represent significant changes (sig = 0.5), maximum drop-down strength does not represent significant changes (sig = 0.7) the maximum force per kg of drop jump does not represent significant changes (sig = 0.9), the maximum power on drop jump does not represent significant changes (sig = 0.9), the contact time does not represent significant changes (sig = 0.1), time in the air does not represent significant changes (sig = 0.4), the difference in air time and momentum does not represent significant changes (sig = 0.8). Discussion: To conclude data of this study show that there is no significant changes between three age groups for anthropometric parameters and force.
Keywords: force, anthropometric, bodybuilder
1. Introduction
training experience you are less prone to the negative effects of concurrent training. However the flaw in this study is that they did not examine these endurance athletes while under resistance training alone conditions. Regardless studies have found that adding endurance training to strength training regimens can result in negative effects in both trained (Hennessy & Watson 1994; Kraemer et al., 1995) and untrained (Dudley & Djamil 1985; Craig et al 1991) individuals. There are a number of hypotheses however, that can be applied toward the experience of an individual. With training experience, you are likely to become less prone to decrements from cardiovascular training. During competition preparation, fat-free mass did not decrease greatly (–3.9%). The loss in body weight was thus primarily due to loss of body fat as desired. The subject’s total body water was relatively stable over the preparation and recovery period and is similar to values previously reported in bodybuilders (Piccoli et al., 2007). Total body water has been shown to be elevated in bodybuilders compared with untrained individuals, and this is thought to be due to an increase in cytoplasmic volume (MacDougall et al., 1982). In addition, the substantial drop in resting energy expenditure during competition preparation appeared driven more by a decrease in energy intake than by loss of fat-free mass. During recovery, percent body fat increased gradually, not returning to baseline values until 4 months after competition. The subject’s diet was more irregular during recovery than during preparation; however, a stated (and achieved) goal of the subject was to not regain body fat too quickly. The purpose of this scientific paper is to compare the physical parameters between the age groups as well as the force with the Drop jump test.
2. Methods
In this study, three groups of randomly selected subjects were included. 28 participants took part in the study (9 participants 18.5 years SD 2.1; 8 participants 22.7 years SD 2.4; 11 participants 29 years SD 2.9). The participants were regularly bodybuilder that took part in national championship in Albania. Drop jump test were used measuring force using a force plate with Leonardo mechanography test (Force Drop Jump).
2.1 Statistical analysis
All variables evaluated in this study were tested for normality. The ANOVA (one way) test followed by the LSD (post hoc) test was used to compare the difference between parameters of the three age groups. Level p <0.05 (Significant Change) was accepted in this study. All statistical analyzes were performed using SPSS 20.0 software.
3. Results
(average = 0.4) (SD = 0.1) , air time (mean = 0.5) (SD = 0.1), time difference in air and peak time (mean = 1.4) (SD = 0.6).
For the age group of 20-25 years: body weight (average = 84 kg) (SD = 9), body length (average = 178) (DS = 2.5), maximum jump force on drop (average = 3.1) (SD = 0.4), the maximum force per kg (mean = 38) (SD = 8.7), maximum power per kg (mean = 30.3) (SD = 6.2), (mean = 0.3) (SD = 0.1), air time (mean = 0.5) (SD = 0.3), time difference in air and peak time (mean = 1.6) (SD = 0.4).
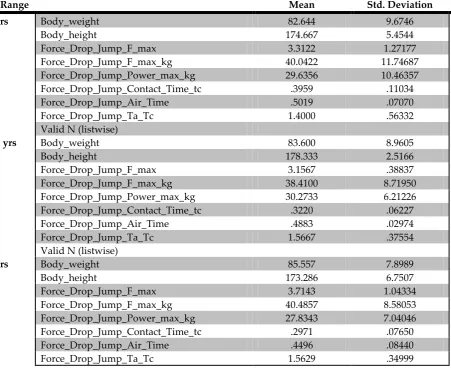
Table 1: Descriptive statistics for comparison by age category
Age_Range Mean Std. Deviation
<20 yrs Body_weight 82.644 9.6746
Body_height 174.667 5.4544
Force_Drop_Jump_F_max 3.3122 1.27177
Force_Drop_Jump_F_max_kg 40.0422 11.74687
Force_Drop_Jump_Power_max_kg 29.6356 10.46357 Force_Drop_Jump_Contact_Time_tc .3959 .11034
Force_Drop_Jump_Air_Time .5019 .07070
Force_Drop_Jump_Ta_Tc 1.4000 .56332
Valid N (listwise)
20-25 yrs Body_weight 83.600 8.9605
Body_height 178.333 2.5166
Force_Drop_Jump_F_max 3.1567 .38837
Force_Drop_Jump_F_max_kg 38.4100 8.71950
Force_Drop_Jump_Power_max_kg 30.2733 6.21226
Force_Drop_Jump_Contact_Time_tc .3220 .06227
Force_Drop_Jump_Air_Time .4883 .02974
Force_Drop_Jump_Ta_Tc 1.5667 .37554
Valid N (listwise)
>25 yrs Body_weight 85.557 7.8989
Body_height 173.286 6.7507
Force_Drop_Jump_F_max 3.7143 1.04334
Force_Drop_Jump_F_max_kg 40.4857 8.58053
Force_Drop_Jump_Power_max_kg 27.8343 7.04046
Force_Drop_Jump_Contact_Time_tc .2971 .07650
Force_Drop_Jump_Air_Time .4496 .08440
Force_Drop_Jump_Ta_Tc 1.5629 .34999
For the age category +20 years: body weight (mean = 85.5) (SD = 7.9), body length (mean = 173) (SD = 6.7), the maximum drop jump force (mean = 3.7) (SD = 1), maximum strength per kg (mean = 40.5) (SD = 8.6), maximum power per kg (average = 27) (SD = 7), contact time (average = 0.3) (SD = 0.1), time in the air (mean = 0.4) (SD = 0.1), time difference in the air and peak time (mean = 1.6) (SD = 0.3).
26.8 and F = 0.1), the time difference in the air (sum of square = 0, mean square = 0 and F = 1), time air (sum of square =0, mean square =0 dhe F= 1), the time difference in the air and the time of the accelerate ( sum of square = 0.1, mean square = 0.1 and F = 0.2).
Table 2: Statistics for comparison of variables by age category
Sum of Squares Mean Square F
Body_weight Between Groups 33.662 16.831 .210
Within Groups 1283.719 80.232
Total 1317.381
Body_height Between Groups 53.589 26.794 .818
Within Groups 524.095 32.756
Total 577.684
Force_Drop_Jump_F_max Between Groups .914 .457 .370
Within Groups 19.772 1.236
Total 20.686
Force_Drop_Jump_F_max_kg Between Groups 9.200 4.600 .043
Within Groups 1697.724 106.108
Total 1706.924
Force_Drop_Jump_Power_max_kg Between Groups 17.912 8.956 .115 Within Groups 1250.483 78.155
Total 1268.394
Force_Drop_Jump_Contact_Time_tc Between Groups .041 .020 2.326
Within Groups .140 .009
Total .181
Force_Drop_Jump_Air_Time Between Groups .011 .005 1.041
Within Groups .085 .005
Total .096
Force_Drop_Jump_Ta_Tc Between Groups .127 .064 .287
Within Groups 3.556 .222
Total 3.683
Data for the Table 3 shows sigma values for comparing variables for all three age groups.
Table 3: Comparison for variables by age category (P or Sig values) ANOVA
Sig.
Body_weight Between Groups 0.813
Within Groups Total
Body_height Between Groups 0.459
Within Groups Total
Force_Drop_Jump_F_max Between Groups .697
Within Groups Total
Force_Drop_Jump_F_max_kg Between Groups .958
Force_Drop_Jump_Power_max_kg Between Groups .892 Within Groups
Total
Force_Drop_Jump_Contact_Time_tc Between Groups .130 Within Groups
Total
Force_Drop_Jump_Air_Time Between Groups .376
Within Groups Total
Force_Drop_Jump_Ta_Tc Between Groups .754
Within Groups Total
4. Discussion
The final results on this study for age category comparison show that; for body weight comparison does not represent significant changes (sig = 0.8), body height does not represent significant changes (sig = 0.5), maximum drop-down strength does not represent significant changes (sig = 0.7) the maximum force per kg of drop jump does not represent significant changes (sig = 0.9), the maximum power on drop jump does not represent significant changes (sig = 0.9), the contact time does not represent significant changes (sig = 0.1), time in the air does not represent significant changes (sig = 0.4), the difference in air time and momentum does not represent significant changes (sig = 0.8). To conclude data of this study show that there is no significant changes between three age groups for anthropometric parameters and force.
The author considers that the decline in maximum aerobic strength and muscular strength with age advancement are examples of functional fall in the body that lead to aging, which can severely limit physical performance and are in a negative correlation with all mortality cases (Salvador Romero-Arenas, 2013). As is well known, endurance exercises and resistance exercises can significantly improve physical performance and health factors in older individuals. Based on the resistance training circuit with raising light weights and minimum breaks during the series and repetitions can be a very effective strategy for increasing oxygen consumption, pulmonary ventilation, strength and functional capacity by improving body composition ).
References
1. Astrand P.-O., Rodahl K. Textbook of work physiology. New York: McGraw-Hill Book Company, 1986
3. Craig B., Lucas J., Pohlman R. Effects of running, weightlifting and a combination of both on growth hormone release. J Appl Sport Sci Res. 1991;5:198-203.
4. Hunter G., Demment R., Miller D. Development of strength and maximum oxygen uptake during simultaneous training for strength and endurance. J Sports Med Phys Fitness. Sep 1987;27(3):269-275.
5. Hennessy L., Watson A. The interference effects of training for strength and endurance simultaneously. J Strength Cond Res. 1994;12(8):9-12.
6. Dudley G. A., Djamil R. Incompatibility of endurance- and strength-training modes of exercise. J Appl Physiol. Nov 1985;59(5):1446-1451.
7. Kimberly Burdette “Will resistance training help to improve my cardiorespiratory fitness?” NASM Elite Trainer
https://www.sharecare.com/user/kimberly-burdette-6, Expert health information 8. Maughan R. J. Marathon running. In: Reilly T, Snell P, Williams C, et al., editors.
Physiology of sports. London: Spon, 1969: 121-52
9. Piccoli A., Pastori G., Codognotto M., et al. Equivalence of information from single frequency v. bioimpedance spectroscopy in bodybuilders. Br J Nutr. 2007;97(1):182–192. PubMed doi:10.1017/S0007114507243077
10.MacDougall J. D., Sale D. G., Elder G. C., et al. Muscle ultrastructural characteristics of elite powerlifters and bodybuilders. Eur J Appl Physiol Occup Physiol. 1982;48(1):117–126. PubMed doi:10.1007/BF00421171 592 Rossow et al 11.Keys A. The Biology of Human Starvation. St. Paul, MN: North Central Publishing
Co; 1950.
12.Salvador Romero-Arenas, Miryam Martínez-Pascual, and Pedro E. Alcaraz
(2013). Impact of Resistance Circuit Training on Neuromuscular, Cardiorespiratory and Body Composition Adaptations in the Elderly Aging Dis. 2013 Oct; 4(5): 256–263. Published online 2013 Oct 1. doi:
Creative Commons licensing terms