International Journal of Advances in Management and Economics
Available online at:
www.managementjournal.info
RESEARCH ARTICLE
Somnath Mukhuti et. al. | Jan.-Feb. 2019 | Vol.8| Issue 1 | 113-131 113
Development and Growth of Women Empowerment of Selected
Indicators in West Bengal- An Empirical Study
Amrita Mukhuti
1, Somnath Mukhuti
2*
Swagata Chakraborty
31Falakata Subhas Girls High School, Falakata, Alipurduar, West Bengal, India.
2Department of Commerce, Azad Hind Fouz Smriti Mahavidyalaya, Domjur, Howrah, West. Bengal, India.
3Department of History, University of Kalyani, Kalyani, Nadia, West Bengal, Bengal, India.
*Corresponding Author Email:[email protected]
Abstract: Women empowerment is radically the route of increasing and progression of woman's position of mainly in financial, political, educational and social stage. Literacy and Education is considered as the main driving force of development for a nation. For improvement of women’s are capable to take breaths without any fear of authoritarianism, indecision, exploitation, inequality-injustice and the common thinking of abuse and violence with women in a conventionally male dominated formation. The present research work mainly focuses on the development and growth of women on the basis of education and literacy, relationship between female literacy and sex ratio district wise, growth of women on the basis of economic conditions and the different areas of working and non-working women district wise in West Bengal. This study is based on both primary and secondary data obtained from many Block Development offices and Gram Panchayets and different websites. A complete scenario is made and recommendations for improving the overall condition and for further research are made. In the course of analysis, on the basis of total literacy rate (both male and female), maximum increased in Murshidabad district and women literacy rate was increased in Maldah district. Both undergraduate and post graduate level women enrolment is undergraduate education levels. Ranking wise top three districts are Kolkata 84.6%, Purba Medinipur 81.37% and North 24 Parganas 80.34% respectively. Spearman Correlation Coefficient results shows the two variables would not be well thought-out statistically significant or some negative correlation between the variables. Similarly, by using Pearson’s Correlation Coefficient observed that there is a negative Correlation between the literacy and sex. Female working parameters and literacy rate as per 2011 census, positive relationship is observed i.e. r of LR and MW and r of LR and OW but the negative relationship is found with r of LR and C, r of LR and AL, r of LR and HI and r of LR and MGW.
Keywords: Empowerment, Female Literacy and Sex/Gender Ratio, Economic Empowerment, Correlation Statistics.
Article Received: 30 Nov. 2018 Revised: 10 Dec. 2018 Accepted: 22 Dec. 2018
Introduction
The word ‘empowerment’ means the authority or given power to someone to do something efficiently. The famous American
Diplomat and politician Hillary Diane
Rodham Clinton said regarding economic
empowerment of women-“when women participate in the economy, everyone benefits” and also indicated ‘Women are the largest untapped reservoir of talent in the world’.
Similarly, Margaret Hilda Thatcher who
was a leader of the British conservative party and former Prime Minister believed and said that ‘If you want something said, ask a man; if you want something done, ask a woman’.
So, women’s and empowerment of women are most important in present day’s not only national stage but also international stages for all types of efforts and job such as education, science and technology, social culture, politics, media, service sectors etc. Empowerment is clarified as the processes by which women take control and possession of their lives from end to end growth of their preferences [1].
Somnath Mukhuti et. al. | Jan.-Feb. 2019 | Vol.8| Issue 1 | 113-131 114
in new generalised terms, is dominating the world socio-economic circumstances for the past two decades. Economic empowerment of women is a sensible requirement for
sustainable development and overall
progression, growth and the achievement of rural areas of the country [2]. In West Bengal, many women have engaged primarily in rural areas with self-help groups
(SHGs), underdeveloped NGOs, PACs
(Primary Agricultural Credit Societies), small female cooperative societies etc. and urban areas, most active women have apparent sensible to elevated stages on joint helpfulness, positive feelings, self-confident and self-efficacy by the way of insignificant intellectual and emotional distress.
Income generation activity of NGO, SHGs and PACs raises economic empowerment and mainly highly empowerment of women in government organisation or sector [3].
It increases women’s right to use to profitable resources and chances as well as careers, services, property and other creative assets, skills development and market information. A Pakistani activist for female education and the youngest Nobel Prize laureate, Malala
Yousafzai said ‘I rise up my voice – not so I
can shout, but so those without a voice can be heard, we cannot succeed when half of us are held back’.
Women Empowerment-West Bengal In early 1950s in West Bengal, moderately well in urban areas however the socio-economic position of rural women was very poor.
There was no literacy and higher education also, no personal income level and early marriage was very popular in anywhere. But these scenarios turned out to be change slowly. Various programmes and schemes were taken in favour of women safety, welfare and empowerment by Government of West Bengal [4].
After 2011, Chief Minister of West Bengal
Mamata Banerjee highlighted the great
success of the 'Kanyasree Prakalpa' scheme for empowering the rural women of the state. It seeks to improve the status and well being of girls, specifically those from socio-economically backward families.
The main point of views is that,
Pay some incentives to continue in
education for long time and complete secondary or higher secondary education or corresponding in technical or vocational programs.
Discouraging early and illegal marriage till at least the 18 years of age.
The legal age of marriage for reducing the risks of early pregnancies, associated risks of maternal and child mortality and other weakening health conditions including those of undernourishment.
It was also decided that the plan should confer more than just monetary support. It means of financial inclusion and an instrument for teenage girls empowerment.
Kanyasree Prakalpa, Government of West Bengal
Somnath Mukhuti et. al. | Jan.-Feb. 2019 | Vol.8| Issue 1 | 113-131 115
Another scheme of 'Anandadhara'
commenced in 2012, it was an anti-poverty
programme for rural poor women,
implemented all the way through organising of women into self-help groups (SHG). The
main aim of this scheme was to organize the rural poor and weak people into self-managed institutions and maintain them in support of livelihood collectives (Economics Times News, October, 2018).
Source: http://www.wbprd.gov.in
In the year 2013, ‘Muktidhara’-a
sustainable livelihood project was started. The major plan was to reduce the dependency of the livelihood of rural people on selling fuel wood by addressing concerns pertaining to
mono-cropping practices, traditional methods of cultivation, food sufficiency of rural families, effective market linkages and seasonal migration of farmers.
Source: https://wb.gov.in
Women Empowerment: Major Schemes of West Bengal
Except ‘Kanyashree Prakalpa’ Government of West Bengal has taken concerning several major initiatives for women. As a result,
women have much benefitted all over the State.
State Government’s ‘Sabuj Sathi’ Scheme.
‘Swabalamban’ Scheme is a wide range
of livelihood activities, e.g., zari craft,
handloom weaving, beautician co
Urses, community health, readymade
garment-making, wood carving, etc.
Somnath Mukhuti et. al. | Jan.-Feb. 2019 | Vol.8| Issue 1 | 113-131 116
Muktir Alo’ is a comprehensive scheme for
the rehabilitation of sex workers.
‘Maternity and Child Care Leave,’ for a
total period of two years.
Many self-help groups (SHGs) have been formed. The State has also created employment opportunities, including many for women, through skill development in various sectors. A lot of the handicraft workers in the rural areas are women who are earning a decent livelihood. Women’s
participation in MGNREGS, in which the
State has achieved unique milestones, has increased to 41%, which is all-time high in the State.
Population Density: India and West Bengal
Total area of West Bengal is 88752 square kilometres. Density is 1,028 per square kilometres. As per report, population of West Bengal in 2018 is 9.88 Crore. In North 24 Parganas, The maximum population is more than 1 crore and lowest population is Dakshin Dinajpur that is 16, 70,931.
Table 1: Population Density: India and West Bengal
Year India West Bengal
1991 273 767
2001 324 904
2011 382 1028
Source: Economic Review, Government of West Bengal http://censusindia.gov.in
In 2017 it was 98,945,546 but now, at present West Bengal is the fourth most crowded state in India with a population of 100,193,142
(100million). Kolkata metropolitan area remains the most densely populated region in the state.
Table 2:Population Density of West Bengal (District wise as per 2011 census)
Districts Total Males Females Density of
Population
Ranking
West Bengal
Darjeeling 18,42,034 9,34,796 9,07,238 585 17 Jalpaiguri 38,69,675 19,80,068 18,89,607 621 16 Coochbehar 28,22,780 14,53,590 13,69,190 833 11 Uttar Dinajpur 30,00,849 15,50,219 14,50,630 956 10 Dakshin Dinajpur 16,70,931 8,55,104 8,15,827 753 14 Maldah 39,97,970 20,61,593 19,36,377 1071 9 Murshidabad 71,02,430 36,29,595 34,72,835 1334 5 Birbhum 35,02,387 17,91,017 17,11,370 771 13 Barddhaman 77,23,663 39,75,356 37,48,307 1100 7
Nadia 51,68,488 26,55,056 25,13,432 1316 6 North 24 Parganas 1,00,82,852 51,72,138 49,10,714 2463 3 South 24 Parganas 81,53,176 41,82,758 39,70,418 819 12
Hooghly 55,20,389 28,19,100 27,01,289 1753 4 Bunkura 35,96,292 18,40,504 17,55,788 523 18
Purulia 29,27,965 14,97,656 14,30,309 468 19 Howrah 48,41,638 25,02,453 23,39,185 3300 2 Kolkata 44,86,679 23,62,662 21,24,017 24252 1 Purba Medinipur 50,94,238 26,31,094 24,63,144 1076 8 Paschim Medinipur 59,43,300 30,32,630 29,10,670 636 15
Source: www.census2011.co.in
In Table 2, as per 2011 census, maximum density of population is Kolkata (24252), second Howrah district (3300) and third North 24 paraganas (2463). However, the maximum population is North 24 paraganas
and lowest population Dakshin Dinajpur, as per density of population, Dakshin Dinajpur rank is 14. In Table-3, the maximum literate
women are North 24 Parganas and lowest is
Dakshin Dinajpur.
Table 3:Population in West Bengal (Literacy as per 2011 census)
Districts Total Persons Males Females
West Bengal
Darjeeling 13,28,218 7,23,711 6,04,507 Jalpaiguri 25,27,018 14,12,065 11,14,953 Coochbehar 18,79,984 10,45,903 8,34,081 Uttar Dinajpur 15,21,933 8,72,285 6,49,648 Dakshin Dinajpur 11,02,355 6,07,992 4,94,363 Maldah 21,36,898 11,82,672 9,54,226 Murshidabad 41,34,584 22,23,237 19,11,347
Somnath Mukhuti et. al. | Jan.-Feb. 2019 | Vol.8| Issue 1 | 113-131 117
Barddhaman 53,50,197 29,79,074 23,71,123 Nadia 35,24,073 19,06,966 16,17,107 North 24 Parganas 77,98,722 41,74,559 36,24,163 South 24 Parganas 56,39,112 31,20,200 25,18,912 Hooghly 41,40,487 22,50,780 18,89,707 Bunkura 22,64,013 13,21,794 9,42,219
Purulia 16,56,940 10,21,455 6,35,485 Howrah 36,42,617 19,72,282 16,70,335 Kolkata 36,48,210 19,66,122 16,82,088 Purba Medinipur 41,73,522 23,33,679 18,39,843 Paschim Medinipur 39,69,750 21,78,611 17,91,139 Average 32,95,503 18,16,219 14,79,284
Source: www.census2011.co.in
0 1,000,000 3,000,000 5,000,000 7,000,000
Darjiling Jalpaiguri Koch Bihar Uttar Dinajpur Dakshin Dinajpur Maldah Murshidabad Birbhum Barddhaman Nadia North Twenty Four Parganas Hugli Bankura Puruliya Haora Kolkata South Twenty Four Parganas Paschim Medinipur
Purba Medinipur
Females
Literates Persons Males
Source: Authors own calculation using E-Views
Male-Female Literate Population in West Bengal District wise
Literature Review
A brief review of the different research areas regarding this field is attempted in the following paragraphs; firstly, on the basis of the financial, economic and social impact of microfinance really creates powerful women,
Pitt and Khandker [5] , Bardhan and Klasen [6], Dijkstra [7], Malhotra and Schuler [8] Pitt et al [5] . The important issues of empowerment generation related Devika and Thampi [9], Deininger and Liu [10], Lal. Shiva Kumar [11] initiated the issues and challenges in empowerment of women through their participation in the Panchayet Raj Institution and covering in Allahabad district of Uttar Pradesh.
Mukherjee [12] conducted the term empowerment of women has different meanings in different socio-cultural and political contexts and should not forget that
history in a witness to the women who have in the past demonstrated unique leadership capabilities. Razia Sultana, Rani of Jhansi Laxmibai, Sarojini Naidu, Mother Teresa, and Indira Gandhi is the examples of women empowerment.
The Cairo conference in 1994 organized by
United Nation on Population and Development called attention to women’s empowerment as a central focus and UNDP developed the Gender Empowerment Measure (GEM) which spotlights on three variables so as to replicate women’s involvement in the society in all facets. 1995 UNDP complete report was dedicated to women’s empowerment.
Somnath Mukhuti et. al. | Jan.-Feb. 2019 | Vol.8| Issue 1 | 113-131 118 National Rural Health Mission Programme in
the year 2005 and for mothers, Janani Suraksha Scheme, 2005, Indira Sahara in the year 2000, Chief Minister Antodaya Pusthaar Scheme, 2009, by law Hindu Succession Act, 1995, Rashtriya Mahila Kosh for the act of 1993, Apna Beti Apna Dhan Scheme, 1994, Kamdhenu Scheme in Maharashtra state, All Girls Child Protection Scheme, in Andhra Pradesh state etc.
Chaudhary et al [13] mainly stated that three types of major approaches of women empowerment that is integrated growth and development approach, careful raising approach and monetary empowerment approach. Mainuddin [14] examined the education and women’s contribution in Indian economy. This paper conducted the work participation rate (WPR) of women in Indian states based on the census conducted in 2001. Rajib Sen [15] explained the women’s political participation through panchayati raj institution in West Bengal.
Das et al [16] investigated the impact of women self-help groups (SHGs) on rural entrepreneurship development. The area of this study is based on selected areas of West Bengal.
Sabharwal [17] introduced from the margin to the mainstream: micro- finance programmes and women empowerment: the Bangladesh experience. Other introduced the measure of gender inequality which criticized. Bhattacharya [18] explained the survey of empowerment of women.
Similarly, Sen (**) study on “Women’s Political Participation through Panchayati Raj Institution in West Bengal” observed different points like India as well as international condition of women, evidence of disparities faced by women in Indian politics, women participation in local governments, panchayets and Gram Sansads meetings in West Bengal.
Sarkar [19] initiated the recent status of education, employment and empowerment of women in West Bengal. Ghosh, Chakravarti and Manshi [20] explained the Women's empowerment and education: Panchayats and women's Self-help Groups in India.
They discussed the most important steps for the empowerment of women; the Indian government gave constitutional status to Panchayati Raj institutions and reserved 33 percent of the seats in Panchayats for women. They additionally indicated that women were organized into Self-help Groups to mark the
beginning of a major process of empowering women. Prof. M. K. Ghadoliya entitled the topic of study, “Empowering women through self -help groups: Role of distance education” describes self-help groups as an instrument of economic empowerment and the study also indicates the success of any strategy of women empowerment depends upon some factors.
These factors are Level of education, hard work, Social custom, Family planning, small family, Health, medical services, cleanliness, Environment, tree growing, and kitchen gardening. This study examined the empowerment of women with respect of standard of living, economic class, status, development and growth of women on the basis of education in West Bengal. Furthermore, in this study, It has also been discussed the empowerment of women through participation in SHGs mainly who are disadvantaged groups and socially and economically backward.
Research Problem and Gap
Several facets of women empowerment have been investigated by different researchers of instance the psychological aspects of
entrepreneurial behaviour. Several
researches have been carried on
characteristics, motivation and constrains of women entrepreneurship process, analysis based on a particular area and general entrepreneurship. But there is no review of literature revealed the economic status, women based on density of population, educational status and implemented schemes regarding girls and development related to women empowerment directly.
Objectives of the Study
The main objective of the present work is to make a study on the overall economic, financial, political, educational and social empowerment of women in West Bengal. Based on the study, suggestions and
recommendations are made for the
improvement of the scenario. More
specifically, it seeks to dwell upon mainly the three following major issues:
To study the development and growth of women on the basis of education and literacy.
To examine the relationship between
female literacy and sex ratio district wise.
Somnath Mukhuti et. al. | Jan.-Feb. 2019 | Vol.8| Issue 1 | 113-131 119 To study the different areas of working and
non-working women district wise in West Bengal.
Research Methodology
The present research work is based on both qualitative and quantitative data and information in nature by understanding the female literacy and sex ratio. Similarly, some secondary data has used for comparing economic status, poverty, social and economic factors of women empowerment.
Data Source
All data and information are both primary and secondary based on 2011 census obtained from various important websites and
databases i.e. censusindia.gov.in,
planningcommission.nic.in,
labourbureau.nic.in and bengalchamber.com. Empowerment Indicators
This study is based on some important factor i.e. education and literacy, female workers and self-help group including financial inclusion. Development of women education has been discussed through the literacy rate of women in West Bengal, Gross Enrolment Ratio (GER) in school level, and Gross Enrolment Ratio (GER) in level of higher education.
Statistical Tools
Arithmetic Mean or Average, Spearman's
correlation coefficient and rank correlation methodology, District wise growth of literacy rate as per census 2001 to 2011, average or mean has been considered.
= D1+D2+D3+D4………D19/N
= Average/Mean, D1= District
Number-1, N= Total Number of Districts
Correlation between female Literacy and Sex
Ratio as per 2011 census, the data has been calculated using Spearman's correlation coefficient and rank correlation methodology. The following formula has been used:
Comparing female Literacy and Sex Ratio as per 2011 census, Pearson’s correlation coefficient methodology also has been used in this study. The following formula has been used:
Or,
Calculation of simple correlation values using the following equation;
r = NΣxy - (Σx) (Σy) / Sqrt ([NΣx2 - (Σx) 2]
[NΣy2 - (Σy) 2])
Women Empowerment through
Education and Literacy
District wise Literacy Rate (Census 2001 to 2011)
Women’s education in West Bengal has also been a most important concern of equally the state government and common society as well-informed women can occupy a very significant character in the development of the country. Since independence the position of males and females literacy rate was not satisfactory level but day-by-day it was very fast increased. It is not just helps to development of part of human resources, however in getting better the value of life at residence and the outside.
Table 4: Literacy Rate in West Bengal (District wise)
Districts Literacy Rates (%) as per
2001 census Literacy Rates (%) as per 2011 census Difference or Changes
Total Male Female Total Male Female Total Male Female
Darjeeling 72.86 81.25 63.92 79.92 85.61 73.33 7.06 4.36 9.41
Jalpaiguri 63.62 73.64 52.90 73.79 79.95 66.23 10.17 6.31 13.33
Coochbehar 67.21 76.82 57.04 75.48 80.71 68.49 8.27 3.89 11.45
Uttar Dinajpur 48.63 59.27 37.16 60.12 65.52 52.17 11.49 6.25 15.01
Dakshin
Dinajpur 64.64 73.30 55.12 73.86 78.37 67.03 9.22 5.07 11.91
Maldah 50.71 59.24 41.67 62.71 66.24 56.96 12 7 15.29
Somnath Mukhuti et. al. | Jan.-Feb. 2019 | Vol.8| Issue 1 | 113-131 120
Birbhum 62.13 71.57 52.21 70.90 76.92 64.14 8.77 5.35 11.93
Barddhaman 71.02 79.30 61.91 77.15 82.42 69.63 6.13 3.12 7.72
Nadia 66.55 72.67 60.06 75.50 78.75 70.98 8.95 6.08 10.92
North 24
Parganas 78.49 84.35 72.13 84.95 87.95 80.34 6.46 3.6 8.21
South 24
Parganas 70.16 79.89 59.73 78.57 83.35 71.40 8.41 3.46 11.67
Hooghly 75.59 83.05 67.72 82.55 87.03 76.35 6.96 3.98 8.63
Bunkura 63.84 77.21 49.80 70.95 80.05 60.05 7.11 2.84 10.25
Purulia 56.14 74.18 37.15 65.38 77.86 50.52 9.24 3.68 13.37
Howrah 77.64 83.68 70.93 83.85 86.95 79.43 6.21 3.27 8.5
Kolkata 83.31 84.07 77.95 87.14 88.34 84.06 3.83 4.27 6.11
Purba
Medinipur 80.16 83.17 67.55 87.02 92.32 81.37 6.86 9.15 13.82
Paschim Medinipur
70.41 77.66 61.21 78.00 85.26 70.50 7.59 7.6 9.29
Mean ( ) 67.30 75.56 57.60 75.55 80.71 68.74 8.27 5.15 11.13
Maximum 83.31 84.35 77.95 87.14 92.32 84.06 12.48 9.15 15.29
Minimum 48.63 59.24 37.15 60.12 65.52 50.52 3.83 2.84 6.11
Source: Census of India (2011) and own calculation https://en.wikipedia.org/wiki/List_of_West_Bengal_districts_ranked_by_literacy_rate
Educated women not only tend to promote the education of their girl children, but also can provide better guidance to all their children. In 2011 census, literacy rate has been developed a very significant level as per average males 80.71 percent and females 68.74 percent than the previous year literacy rates i.e. males 75.56 percent and females 57.60 percent. In Table-2.1, on the basis of total literacy rate (both male and female), maximum increased in Murshidabad district (12.48%) and lowest percentage increased in Kolkata (3.83%) as per comparison of census report 2001 to 2011.
Similarly, the main focus of the study that is women literacy rate was increased in Maldah district (15.29%) and lowest in Kolkata (6.11%) as per report. Overall in this study, more than 10% female literacy rate increased in various districts in West Bengal for an example of Murshidabad district i.e. (15.01%). The percentage of male and female literacy rates compare to total values as per 2001 and 2011 census has shown graphically in chart-1 and chart-2. This is the clear view point based on objectives of the study.
Chart 1:Literacy Rates (%) as per 2001 census
Somnath Mukhuti et. al. | Jan.-Feb. 2019 | Vol.8| Issue 1 | 113-131 121 Chart 2:Literacy Rates (%) as per 2011 census
Source: Author’s own contribution
District wise Female Literacy Rate (Census 1991 to 2011)
As per Table 5, comparable result according to the Census 1991, 2001 and 2011, the literacy rate of 19 districts in West
Bengal has increased on the basis of mean 42.95 per cent in 1991, 57.60 per cent in 2001 and 68.74 per cent in 2011. While as per district wise ranking, overall highest only female literacy rate was Kolkata (72.10% in1991, 77.95% in 2001 and 84.06% in 2011).
Table 5: Female Literacy Rate Comparison in West Bengal (District wise, 1991-2011)
Districts
Female Literacy As
per 1991 Census Female Literacy As per 2001 Census Female Literacy As per 2011 Census
Darjeeling 47.8 63.92 73.33
Jalpaiguri 33.2 52.9 66.23
Coochbehar 33.3 57.04 68.49
Uttar Dinajpur 27.9 37.16 52.17
Dakshin Dinajpur 27.9 55.12 67.03
Maldah 24.9 41.67 56.96
Murshidabad 29.6 48.33 63.07
Birbhum 37.2 52.21 64.14
Barddhaman 51.5 61.91 69.63
Nadia 44.4 60.06 70.98
North 24 Parganas 58 72.13 80.34
South 24 Parganas 40.6 59.73 71.4
Hooghly 56.9 67.72 76.35
Bunkura 36.5 49.8 60.05
Purulia 23.2 37.15 50.52
Howrah 57.8 70.93 79.43
Kolkata 72.1 77.95 84.06
Purba Medinipur 56.6 67.55 81.37
Paschim Medinipur 56.6 61.21 70.5
Mean 42.95 57.60 68.74
Maximum 72.1 77.95 84.06
Minimum 23.2 37.15 50.52
Source: Census of India (1991, 2001, 2011)
Assume that Medinipur and Dinajpur same
Somnath Mukhuti et. al. | Jan.-Feb. 2019 | Vol.8| Issue 1 | 113-131 122 Chart 3: Female Literacy Rates (%) Comparison
Source: Author’s own contribution
Sex/Gender Ratio in West Bengal
Gender or sex ratio is a most important indicator regarding women empowerment for that particular type of research. According to Census 1991, 2001 and 2011, the sex ratio per 1000 males of 19 districts in West Bengal has increased on the basis of mean or average i.e. 921.95 or 922 in 1991, 936.79 or
937 in 2001 and 947.05 or 947 in 2011 approximately. Whereas as per district wise ranking, overall highest sex or gender ratio was Bunkura 951 in 1991, Purba Medinipur and Paschim Medinipur both 955 in 2001 and Darjeeling 971 in 2011). Maximum increase in that ratio was Kolkata (799 in 1991, 828 in 2001 and 899 in 2011) as per Table 6.
Table 6: Sex ratio-female per thousand males
Districts Sex Ratio-Female Per
Thousand Males-As per 1991 Census
Sex Ratio-Female Per Thousand Males-As per
2001 Census
Sex Ratio-Female Per Thousand Males-As per
2011 Census
Darjeeling 914 943 971
Jalpaiguri 927 941 954
Coochbehar 935 949 942
Uttar Dinajpur 930 937 936
Dakshin Dinajpur 930 950 954
Maldah 938 948 939
Murshidabad 943 952 957
Birbhum 946 949 956
Barddhaman 899 921 943
Nadia 936 947 947
North 24 Parganas 907 927 949
South 24 Parganas 929 938 949
Hooghly 917 947 958
Bunkura 951 953 954
Purulia 947 953 955
Howrah 881 906 935
Kolkata 799 828 899
Purba Medinipur 944 955 936
Paschim Medinipur 944 955 960
Mean/Average 921.9473684 936.7894737 947.0526316
Maximum 951 955 971
Minimum 799 828 899
Source: Author’s own contribution
Data collection from 1991, 2001 and 2011census
Status of Women Education in West Bengal
The constitutional directive to provide free and compulsory education for all children up to the age of 14 years has remained
unfulfilled till now. Educational experts admit that this failure is mainly due to the slow progress of education among girls [2]. After Independence, there still exists a great
disparity between male and female
Somnath Mukhuti et. al. | Jan.-Feb. 2019 | Vol.8| Issue 1 | 113-131 123 Table 7: Male-Female Literacy Rate of West Bengal Comparing to the Country
Source: Census of India (2011)
Increased denotes A, Decreased denotes B and no need to study C
Table 8: Female Literacy of West Bengal and the Country
Female Literacy (%)
India 65.46
West Bengal 71.20
Source: Census of India (2011)
According to the Table 8, the comparison of
female literacy rate had reached 65.46% in all India bases in the 2011 census and West Bengal is more than the average of India i.e. 71.20%
Table 9: Class level-wise Enrolment in School 2014-15
Level All Categories
Male Female Total
Primary 67609 62892 130501
Upper Primary 34501 32664 67165 Elementary 102110 95556 197666
Secondary 20121 18180 38301
IX 122231 113736 235967
Senior Secondary(XI-XII) 12440 11061 23501
Source: Statistics of School Education, Ministry of Human Resource Development
Table 9 shows that, maximum number of women enrolled in XI standard in the year 2014-15 it was total 113736. Every year it
has been increased and Table- shows the maximum female enrolment in the section of Under Graduate in 2014-15 (12705).
Table 10: Class level-wise Enrolment in Higher Education up to 2014-15
Level All Categories
Male Female Total
Ph.D. 70 48 118
M.Phil. 14 19 33
Post Graduate 1867 1986 3853
Under Graduate 14467 12705 27172
PG Diploma 121 94 215
Diploma 1788 720 2508
Certificate 74 96 170
Integrated 87 55 142
Source: Statistics of School Education, Ministry of Human Resource Development
Table 11 shows 5 Year Trend of Female Enrolment in Higher Education Level. The maximum number of women has enrolled in under graduate level and it was increased than others level of education. In 2014-15, it
was increased (729494) than the previous year 2013-14, it was 672908. There was a huge difference between the years i.e. 56586.
Table 11: 5 Year Trend of Female Enrolment in Higher Education Level (2011-15)
Level of Education 2010-11 2011-12 2012-13 2013-14 2014-15
Certificates 637 2286 2164 1534 4009 Diploma 4430 11818 12798 14025 23661 PG Diploma 1023 1176 1008 1376 1275 Under Graduate 465857 542656 619370 672908 729494
Post Graduate 88345 80468 81307 93471 101961
M.Phil. 749 695 433 404 345
Ph.D 847 905 948 1368 1590
Source: Statistics of Higher Education, Ministry of Human Resource Development Assume that Certificates to Ph.D is Higher Education Level
Relationship between Literacy and Sex Ratio As per Table 12, according to the Census
2011, the female literacy rate of 19 districts in West Bengal has increased to 68.74 per cent in 2011. But ranking wise top three
1971 1981 1991 2001 2011
Male Female Male Female Male Female Male Female Male Female India 47.60 25.65 55.95 33.20 73.13 48.64 79.67 57.80 87.23 70.73 West
Bengal
- - 59.9 36.10 64.10 39.30 77.02 59.61 81.69 70.54
Somnath Mukhuti et. al. | Jan.-Feb. 2019 | Vol.8| Issue 1 | 113-131 124
districts are Kolkata (84.6 per cent), Purba
Medinipur (81.37 per cent) and North 24 Parganas (80.34 per cent) respectively.
Table 12: Female Literacy and Sex Ratio as per Ranking
Districts F-Literacy R1 Sex Ratio R2
Darjeeling 73.33 6 971 1
Jalpaiguri 66.23 13 954 7
Coochbehar 68.49 11 942 11
Uttar Dinajpur 52.17 18 936 13
Dakshin Dinajpur 67.03 12 954 7
Maldah 56.96 17 939 12
Murshidabad 63.07 15 957 4
Birbhum 64.14 14 956 5
Barddhaman 69.63 10 943 10
Nadia 70.98 8 947 9
North 24 Parganas 80.34 3 949 8
South 24 Parganas 71.4 7 949 8
Hooghly 76.35 5 958 3
Bunkura 60.05 16 954 7
Purulia 50.52 19 955 6
Howrah 79.43 4 935 14
Kolkata 84.06 1 899 15
Purba Medinipur 81.37 2 936 13
Paschim Medinipur 70.5 9 960 2
Average 68.74
Now statistically measured in Table 13, the relationship between the two variables i.e. Rank of Female Literacy (XRa) and Rank of
Sex Ratio (YRa) based on Spearman
Correlation Coefficient technique.
Table 13: Calculation of Spearman Correlation Coefficient
X Y XRa XRa - Mx YRa YRa - My Sum Diffs.
73.33 971 14.00 4.00 19.00 9.00 36.00 66.23 954 7.00 -3.00 12.00 2.00 -6.00 68.49 942 9.00 -1.00 6.00 -4.00 4.00 52.17 936 2.00 -8.00 3.50 -6.50 52.00 67.03 954 8.00 -2.00 12.00 2.00 -4.00 56.96 939 3.00 -7.00 5.00 -5.00 35.00 63.07 957 5.00 -5.00 16.00 6.00 -30.00 64.14 956 6.00 -4.00 15.00 5.00 -20.00 69.63 943 10.00 0.00 7.00 -3.00 0.00 70.98 947 12.00 2.00 8.00 -2.00 -4.00 80.34 949 17.00 7.00 9.50 -0.50 -3.50 71.4 949 13.00 3.00 9.50 -0.50 -1.50 76.35 958 15.00 5.00 17.00 7.00 35.00 60.05 954 4.00 -6.00 12.00 2.00 -12.00 50.52 955 1.00 -9.00 14.00 4.00 -36.00 79.43 935 16.00 6.00 2.00 -8.00 -48.00 84.06 899 19.00 9.00 1.00 -9.00 -81.00 81.37 936 18.00 8.00 3.50 -6.50 -52.00 70.5 960 11.00 1.00 18.00 8.00 8.00 Source: Authors own calculation
X: X Values-Female Literacy and Y: Y Values-Sex Ratio
R = Covariance / (XRa St. Dev.) (YRa St. Dev.)
XRa = Ranks of X Values
YRa = Ranks of Y Values
X rank minus mean of X ranks & Y rank minus mean of Y ranks:
XRa - Mx &YRa - My Sum Diffs:
(XRa - Mx) (YRa - My)
Details Results
X Ranks, Mean: 10, Standard Dev: 5.63,
Y Ranks, Mean: 10, Standard Dev: 5.61, Combined Covariance = -128 / 18 = -7.11; R = -7.11 / (5.63 * 5.61) = -0.225
rs = -0.22516, p (2-tailed) = 0.35404. By
normal standards, the association between the two variables would not be considered statistically significant. The value of rsis:
-0.22516.
P Value from Pearson (R)
Somnath Mukhuti et. al. | Jan.-Feb. 2019 | Vol.8| Issue 1 | 113-131 125
statistically significant because p < 0.10 and the value of RS is (-0.2252) which indicates the negative correlation between the variables as per Table 13. Similarly, by using Pearson’s Correlation Coefficient method statistically in Table 14, the relationship
between the two variables i.e. Rank of Female Literacy (Mx) and Rank of Sex Ratio
(My). It is observed that there is a fairly low
and negative Correlation, that is, r = -0.3185 between the literacy and sex in West Bengal.
Table 14: Calculation of Pearson’s Correlation Coefficient
X Y X - Mx Y - My (X - Mx)2 (Y - My)2 (X - Mx)(Y - My)
73.33 971 4.591 23.947 21.073 573.476 109.931 66.23 954 -2.509 6.947 6.297 48.266 -17.434 68.49 942 -0.249 -5.053 0.062 25.529 1.26 52.17 936 -16.569 -11.053 274.547 122.161 183.136 67.03 954 -1.709 6.947 2.922 48.266 -11.876 56.96 939 -11.779 -8.053 138.756 64.845 94.856 63.07 957 -5.669 9.947 32.143 98.95 -56.396 64.14 956 -4.599 8.947 21.155 80.055 -41.153 69.63 943 0.891 -4.053 0.793 16.424 -3.609 70.98 947 2.241 -0.053 5.02 0.003 -0.118 80.34 949 11.601 1.947 134.572 3.792 22.59 71.4 949 2.661 1.947 7.078 3.792 5.181 76.35 958 7.611 10.947 57.92 119.845 83.315 60.05 954 -8.689 6.947 75.507 48.266 -60.369 50.52 955 -18.219 7.947 331.949 63.161 -144.797 79.43 935 10.691 -12.053 114.287 145.266 -128.849 84.06 899 15.321 -48.053 234.719 2309.055 -736.192 81.37 936 12.631 -11.053 159.53 122.161 -139.601 70.5 960 1.761 12.947 3.099 167.634 22.794
Mx: 68.739 My: 947.053 Sum: 1621.432 Sum: 4060.947 Sum: -817.329 Source: Authors own calculation
Taking,
X: X Values-Female Literacy and Y: Y
Values-Sex Ratio
Mx: Mean of X Values and My: Mean of Y
Values
Deviation scores and Deviation Squared,
X - Mx & Y - My &(X - Mx) 2 & (Y - My) 2 Product of Deviation Scores:
(X - Mx)(Y - My)
∑X: Values = 1306.05, Mean = 68.739, ∑(X –
Mx) 2 = SSx= 1621.432
∑Y: Values = 17994, Mean = 947.053, ∑(Y -
My) 2 = SSy = 4060.947
X and Y Combined, N = 19,
∑(X - Mx) (Y - My) = -817.329
R Calculation
r = ∑ ((X - My) (Y - Mx)) / √ ((SSx) (SSy))
r = 817.329 / √ ((1621.432) (4060.947)) = -0.3185
Meta Numerics (cross-check) r = -0.3185 The value of R is -0.3185.
Again a negative correlation, the relationship between your variables is only weak correlation. The value of R2, the coefficient of determination, is 0.1014. The value of R is: -0.3185.
P Value from Pearson (R)
The P-Value is 0.184581. The result is not significant at p < .01; the P-Value is 0.184581. The result is not significant at p < .05 and the P-Value is 0.184581. The result is not significant at p < .10
Development and Growth of Women on the basis of Economic Conditions
Now recent days, the economy turned down of West Bengal is one of the most important discussion topics in Indian media. Before independence, Bengal was almost certainly for the most part of advanced region of the sub-continent. But after independence it has been changed (Scroll.in-Jan 8, 2019 news).
That time women participation rate in economic activities was very low but now it has increased. Participation of women in economic actions and activities mainly is a most important issue facilitating the economic and social empowerment of women [19]. Just not only can service or employment, it is also a vital base of economic freedom of women. In this section we examine the work participation structure of women in West Bengal.
Somnath Mukhuti et. al. | Jan.-Feb. 2019 | Vol.8| Issue 1 | 113-131 126 Table 15: Work Participation Structure (District Wise) as per 2011 Census
District
MW C AL HI OW MGW Total
Working Female
Non Working
Darjeeling 1,36,514 10,352 8,715 2,654 1,14,793 67,626 3,40,654 7,05,424 Jalpaiguri 2,31,583 13,870 45,756 4,781 1,67,176 1,89,966 6,53,132 14,68,233 Coochbehar 1,36,509 28,415 59,613 10,084 38,397 1,46,160 4,19,178 10,84,875 Uttar
Dinajpur 1,35,573 15,231 55,528 11,856 52,958 1,40,426 4,11,572 11,80,069 Dakshin
Dinajpur
98,892 13,885 45,288 10,110 29,609 1,04,535 3,02,319 6,15,650
Maldah 1,99,063 13,009 41,409 73,501 71,144 2,52,323 6,50,449 14,85,918 Murshidabad 3,59,459 9,528 29,778 2,18,076 1,02,077 2,44,781 9,63,699 28,72,003 Birbhum 1,27,196 9,699 48,573 15,770 53,154 1,74,637 4,29,029 14,09,651 Barddhaman 3,28,061 12,333 1,27,330 29,676 1,58,722 2,90,107 9,46,229 31,32,506 Nadia 1,90,689 6,608 25,267 52,300 1,06,514 97,828 4,79,206 22,25,315 North 24
Parganas 4,24,723 12,337 38,993 36,418 3,36,975 2,01,712 10,51,158 42,63,957 South 24
Parganas
2,54,971 20,289 31,639 33,173 1,69,870 3,52,952 8,62,894 33,80,260
Hooghly 2,51,212 10,017 82,765 19,890 1,38,540 1,88,050 6,90,474 22,65,230 Bunkura 1,54,305 11,765 83,272 9,409 49,859 2,61,093 5,69,703 13,43,181 Purulia 1,20,166 21,634 39,592 19,657 39,283 3,28,222 5,68,554 9,84,731 Howrah 1,91,832 4,524 7,611 49,756 1,29,941 1,29,843 5,13,507 20,27,535 Kolkata 2,82,153 2,711 2,136 11,976 2,65,330 1,01,121 6,65,427 17,56,654 Purba
Medinipur 1,27,109 14,681 27,063 21,503 63,862 2,67,115 5,21,333 20,71,817 Paschim
Medinipur 2,58,341 32,480 1,26,084 18,499 81,278 4,93,460 10,10,142 21,53,771 West Bengal 40,08,351 2,63,368 9,26,412 6,49,089 21,69,482 40,31,957
Source: Data Census of India 2011
MW Main Workers, C: Cultivators, HI:
Household Industries OWWorkers Other Workers and MGW: Marginal
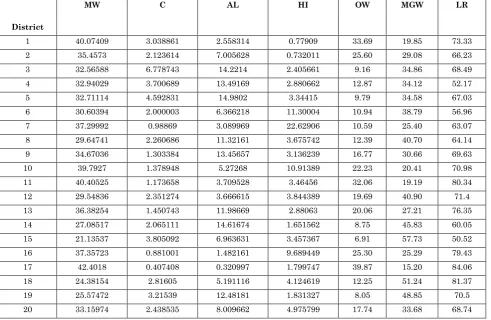
Table 16: Correlation between Literacy and Some Selected Parameters
District
MW C AL HI OW MGW LR
1 40.07409 3.038861 2.558314 0.77909 33.69 19.85 73.33 2 35.4573 2.123614 7.005628 0.732011 25.60 29.08 66.23 3 32.56588 6.778743 14.2214 2.405661 9.16 34.86 68.49 4 32.94029 3.700689 13.49169 2.880662 12.87 34.12 52.17 5 32.71114 4.592831 14.9802 3.34415 9.79 34.58 67.03 6 30.60394 2.000003 6.366218 11.30004 10.94 38.79 56.96 7 37.29992 0.98869 3.089969 22.62906 10.59 25.40 63.07 8 29.64741 2.260686 11.32161 3.675742 12.39 40.70 64.14 9 34.67036 1.303384 13.45657 3.136239 16.77 30.66 69.63 10 39.7927 1.378948 5.27268 10.91389 22.23 20.41 70.98 11 40.40525 1.173658 3.709528 3.46456 32.06 19.19 80.34 12 29.54836 2.351274 3.666615 3.844389 19.69 40.90 71.4 13 36.38254 1.450743 11.98669 2.88063 20.06 27.21 76.35 14 27.08517 2.065111 14.61674 1.651562 8.75 45.83 60.05 15 21.13537 3.805092 6.963631 3.457367 6.91 57.73 50.52 16 37.35723 0.881001 1.482161 9.689449 25.30 25.29 79.43 17 42.4018 0.407408 0.320997 1.799747 39.87 15.20 84.06 18 24.38154 2.81605 5.191116 4.124619 12.25 51.24 81.37 19 25.57472 3.21539 12.48181 1.831327 8.05 48.85 70.5 20 33.15974 2.438535 8.009662 4.975799 17.74 33.68 68.74
Source: Authors own calculation
PMW Proportion of Main Workers to Total Female
Somnath Mukhuti et. al. | Jan.-Feb. 2019 | Vol.8| Issue 1 | 113-131 127
PHI
Proportion of Household Industries to Total Female Worker, POW: Proportion of Other
Workers to Total Female Worker, PMGW:
Proportion of Marginal Workers to Total Female Worker and LR: Literacy Rate as per 2011 census.
Districts shown as per previous table or Table 15
Calculation of correlation values using the following equation;
r = NΣxy - (Σx) (Σy) / Sqrt([NΣx2 -
(Σx)2][NΣy2 - (Σy)2]) Calculation Example
Relationship between Literacy Rate and to Marginal Workers
X Values, ∑ = 663.195, Mean = 33.16, ∑(X -
Mx) 2 = SSx = 631.013
Y Values, ∑ = 1374.79, Mean = 68.739, ∑(Y -
My) 2 = SSy = 1621.432
X and Y Combined
N = 20, ∑(X - Mx) (Y - My) = 502.594 R Calculation:
r = ∑ ((X - My) (Y - Mx)) / √ ((SSx) (SSy))
r = 502.594 / √ ((631.013) (1621.432)) = 0.4969 r = 0.4969. Therefore, value of R is 0.4969
i.e. a positive correlation.
The value of R2, the coefficient of
determination, is 0.2469.
Table 17: Correlation Statistics
AL CO1 HI LR MGW MW OW
Al 1.00 * * * * * *
CO1 0.55 1.00 * * * * *
HI -0.37 -0.35 1.00 * * * *
LR -0.45 -0.37 -0.13 1.00 * * * MGW 0.42 0.45 -0.19 -0.49 1.00 * * MW -0.42 -0.45 0.19 0.49 -1.00 1.00 * OW -0.66 -0.53 -0.18 0.66 -0.79 0.79 1.00
Source: Own Calculation using E-views software
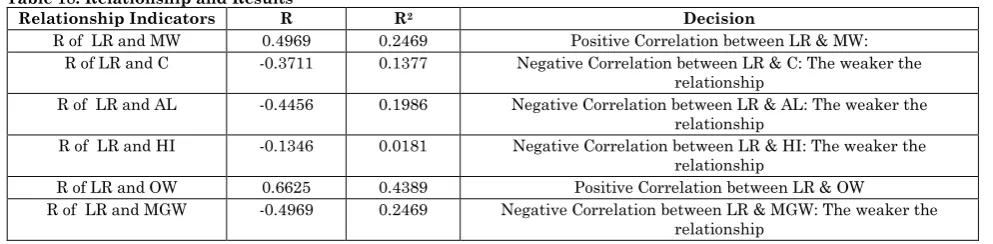
Table 18: Relationship and Results
Relationship Indicators R R2 Decision
R of LR and MW 0.4969 0.2469 Positive Correlation between LR & MW: R of LR and C -0.3711 0.1377 Negative Correlation between LR & C: The weaker the
relationship
R of LR and AL -0.4456 0.1986 Negative Correlation between LR & AL: The weaker the relationship
R of LR and HI -0.1346 0.0181 Negative Correlation between LR & HI: The weaker the relationship
R of LR and OW 0.6625 0.4389 Positive Correlation between LR & OW
R of LR and MGW -0.4969 0.2469 Negative Correlation between LR & MGW: The weaker the relationship
As per Table 18, positive relationship is observed i.e. r of LR and MW and r of LR and
OW but the negative relationship is found with r of LR and C, r of LR and AL, r of LR
and HI and r of LR and MGW. The worker in
the rural field generally unskilled
agricultural labour and there is no any pre-requisite condition of literacy and education.
0 5 10 15
AL
40 60 80 100
LR
0 2 4 6 8
C
0 10 20 30
HI
0 20 40 60 80
MG
W
10 20 30 40 50
MW
-20 0 20 40
OW
0 5 10 15
AL
50 60 70 80 90
LR
0 2 4 6 8
C
0 10 20 30
HI
0 20 40 60
MGW
20 30 40 50
MW
0 10 20 30 40
OW
Somnath Mukhuti et. al. | Jan.-Feb. 2019 | Vol.8| Issue 1 | 113-131 128 0 20,000 40,000 60,000 80,000 100,000 120,000 140,000
Darjeeling Jalpaiguri Coochbehar Uttar Dinajpur Dakshin Dinajpur Maldah Murshidabad Birbhum Barddhaman Nadia North 24 Parganas South 24 Parganas Hooghly Bunkura Purulia Howrah Kolkata Purba Medinipur Paschim Medinipur
Agriculture Labourer
0 4,000 8,000 12,000 16,000 20,000 24,000 28,000 32,000 36,000 Darjeeling
Jalpaiguri Coochbehar Uttar Dinajpur Dakshin Dinajpur Maldah Murshidabad Birbhum Barddhaman Nadia North 24 Parganas South 24 Parganas Hooghly Bunkura Purulia Howrah Kolkata Purba Medinipur Paschim Medinipur
Cultivators
0 20,000 60,000 100,000 140,000 180,000 220,000 Darjeeling
Jalpaiguri Coochbehar Uttar Dinajpur Dakshin Dinajpur Maldah Murshidabad Birbhum Barddhaman Nadia North 24 Parganas South 24 Parganas Hooghly Bunkura Purulia Howrah Kolkata Purba Medinipur Paschim Medinipur
Household Industries
80,000 120,000 200,000 280,000 360,000 440,000 Darjeeling
Jalpaiguri Coochbehar Uttar Dinajpur Dakshin Dinajpur Maldah Murshidabad Birbhum Barddhaman Nadia North 24 Parganas South 24 Parganas Hooghly Bunkura Purulia Howrah Kolkata Purba Medinipur Paschim Medinipur
Main Workers
Chart 5: Female Work Participation Structure (District Wise)
Somnath Mukhuti et. al. | Jan.-Feb. 2019 | Vol.8| Issue 1 | 113-131 129
Findings and Conclusions of the Study The objectives of the study have brought about certain conclusions with respect to the study. In the above discussion,
Firstly I: Development and Growth of women on the Basis of Education and Literacy
In 2011 census, literacy rate has been developed a very significant level as per average males 80.71 percent and females 68.74 percent than the previous year literacy rates i.e. males 75.56 percent and females 57.60 percent. On the basis of total literacy rate (both male and female), maximum
increased in Murshidabad district (12.48%) and similarly, the main focus of the study that is women literacy rate was increased in Maldah district (15.29%). While as per district wise ranking, overall highest only female literacy rate was Kolkata (72.10% in1991, 77.95% in 2001 and 84.06% in 2011).
Again can say, in for the most part of the cases it is shown that in both undergraduate & post graduate level women enrolment is higher than others education levels in West Bengal and maximum women are not interested in level of higher education such as M.Phil and Ph.D degrees.
Secondly II: Relationship between Female Literacy and Sex Ratio District Wise
According to the census 2011, the female literacy rate of 19 districts in West Bengal has increased to 68.74 per cent in 2011. But ranking wise top three districts are Kolkata (84.6 per cent), Purba Medinipur (81.37 per cent) and North 24 Parganas (80.34 per cent) respectively.
Spearman Correlation Coefficient results shows the two variables would not be well thought-out statistically significant because p < 0.10 and the value of RS is (-0.2252) which
indicates the negative correlation between the variables. Similarly, by using Pearson’s Correlation Coefficient, the relationship between the two variables observed that there is a fairly low and negative Correlation, that is, r = -0.3185 between the literacy and sex in West Bengal.
Thirdly-III: Development and Growth of women on the Basis of Economic Conditions
By using Proportion of Main Workers to
Total Female Worker, Proportion of Cultivators to Total Female Worker, Proportion of Household Industries to Total Female Worker, Proportion of Other Workers to Total Female Worker, Proportion of Marginal Workers to Total Female Worker and Literacy Rate as per 2011 census. Positive relationship is observed i.e. r of LR
and MW and r of LR and OW but the negative relationship is found with r of LR
and C, r of LR and AL, r of LR and HI and r
of LR and MGW. The worker in the rural field generally unskilled agricultural labour and there is no any pre-requisite condition of literacy and education.
Fourthly IV: Relationship between Different Areas of Working Class and Non-Working Class Women District Wise in West Bengal
In this section, maximum non working class of female in north 24 parganas (4263957), second is south 24 parganas (3380260) and third is Barddhaman (3132506). It will be discussed in future study separately after selecting important parameters.
Future Research
Finally, it can be said that there are so many research works has been available for future research in the area of women in politics, women in higher education, women in banking and SHGs, PACs and others [21-52].
References
1.Pal S (2016) Social and Economic Empowerment of Rural Women through Self-help groups (SHGs): A case study in West Bengal, India. International Journal of Agricultural Sciences. 8(32). 1673-1676. 2.Debroy S (2016) Importance of Empowerment of Women and Contribution-A Study in West Bengal. Seminar paper on Emerging issues in Accounting and Finance organised by Azad Hind Fouz Smriti Mahavidyalaya, Domjur, Howrah, Hind Fouz
Smriti Mahavidyalaya, Domjur, Howrah. West Bengal, India.
3.Basu S, Basu P (2001) Income Generation Program and Empowerment of Women-A case
study in India. Retrieved from
https://crawford.anu.edu.au/acde/asarc/pdf/papers/ conference/CONF2001_03.pdf.
Somnath Mukhuti et. al. | Jan.-Feb. 2019 | Vol.8| Issue 1 | 113-131 130
Interdisciplinary Research (IJIR). 3(3). 1852-1857. Economics Times News Report (2018). Retrieved from https://economictimes.indiatimes.com. 5.Pitt MM, Khandker SR (1998) The impact of
Group‐ Based Credit Programs on Poor Households in Bangladesh: Does the Gender of Participants Matter? Journal of Political Economy, the University of Chicago Press Journal. 106(5).
Retrieved from
https://www.journals.uchicago.edu/doi/abs/10.1086 /250037
6.Bardhan K, Klasen S (1999) UNDP's Gender-Related Indices: A Critical Review. World Development, 27(96):985-1010.
7.Dijkstra G (2002) ‘Revisiting UNDP’s G D I a n d G E M : T o w a r d s a n d alternative’, Social Indicators Research, 57(3):301-315.
8.Malhotra A, Schuler SR, Boender C (2002) Measuring Women’s Empowerment as a Variable in International Development. Retrieved from http://siteresources.worldbank.org/INTEMPOWER MENT/Resources/486312-1095970750368/529763-1095970803335/malhotra.pdf
9.Devika J, Binitha V, Thampi (2007) Between
‘Empowerment’ and ‘Liberation’: The
Kudumbashree Initiative in Kerala. 14(1).
Retrieved from
https://journals.sagepub.com/doi/10.1177/09715215 0601400103
10.Deininger Klaus, Liu Yanyan (2009) Economic and Social Impacts of Self-Help Groups in India (1). World Bank Policy Research Working 4884.
Available at
SSRN: https://ssrn.com/abstract=1372961
11.Lal SK (**) a Study of Issues and Challenges in
Empowerment of Women through Their
Participation in the Panchayat Raj Institution: A Case Study of Allahabad District of Uttar
Pradesh. Retrieved from
https://webcache.googleusercontent.com/search?q=
cache:Au5OGx1-t-cJ:https://www.isical.ac.in/~wemp/Papers/PaperSh ivaLalRevised.doc+&cd=1&hl=en&ct=clnk&gl=in. 12.Mukherjee D (2012) “Empowerment of women in
India”, Retrieved from
http://debaratimukherjee.blogspot.in/2012/11/an-essay-written-by-me-empowerment-of_7.html 13.Chaudhary A, Chani R, Muhammad I, Pervaiz Z
(2012) An Analysis of Different Approaches to Women Empowerment-A Case Study of Pakistan. World Applied Sciences Journal, 16 (7): 971-980. 14.Mainuddin M (2012) Education and women’s
participation in Indian economy: A regional analysis. Journal of Geography and Regional Planning, 5(2):36-50.
15.Sen Rajib “Women’s Political Participation through Panchayati Raj Institution in West Bengal”, Indian Streams Research Journals-International Recognition Multidisciplinary
Research Journal. Retrieved from
http://www.isrj.net/ArticleDetails.aspx?id=2250
16.Das A, Mondal S, Mondal J (2016) ‘Women and sports: A new area of empowerment–An ethnographic study in an urban spot in West Bengal’. International Journal of Physical Education, Sports and Health, 3(4):244-248. 17.Sabharwal G (2003) “From Margin to the
Mainstream: Micro- finance Programmes and
Women Empowerment: The Bangladesh
Experience” Retrieved from http://www.gdre.org 18.Bhattacharya LM (2009) Empowerment of
Women-A Survey of Issues & Definitions. Social Science Research Network. Retrieved from
http://ssrn.com/abstract=1324491 or
http://dx.doi.org/10.2139/ssrn.1324491
19.Sarkar R (2017) Recent Status of Education, Employment and Empowerment of Women in West Bengal. International Journal of Scientific and Research Publications, 7(1):263-269.
20.Ghosh R, Chakravarti P, Manshi K (2015)
Women's empowerment and education:
Panchayats and women's Self-help Groups in India. Sage Journals, 13(3): 294-314.
21.Ghadoliya Prof MK “Empowering women through self -help groups: Role of distance education”.
Retrieved from
http://www.col.org/pcf3/Papers/PDFs/Ghadoliya_M K.pdf
22.Arora SC (2002) ‘Women Empowerment in India’, Indian Journal of Politics, XXXVI. (3-4):124. 23.Baylis J, Smith S (2005) the Globalization of
World Politics. Third Edition (Indian Edition), Oxford University Press, 674-676.
24.OECD (2011) Women’s Economic Empowerment,
DAC Network on Gender Equality
(GENDERNET)-(OECD). Issues paper.
25.Goswami PJ (2013) Inclusive Growth Through Micro Finance-A Study on SHG Bank Linkage Programme in Agarwal, A. K et al (ed) Micro Finance in India, DVS Publishers, Guwahati ,ISBN 978-81-86307-64-9, 218-228.
26.United Nations (2009) The Millennium Development goals report, UN, New York.
27.Kucera D, Xenogiani T (2009) “Women in Informal Employment: What Do We Know and What Can We Do?” in J. Jutting and J.R. De Laiglesia (eds.), Is Informal Normal? : Towards More and Better Jobs in Developing Countries, OECD, Paris. 28.ILO (2009) Report VI - Gender equality at the
heart of decent work. International Labour Conference, 98th Session, Geneva.
29.Krishnaiah P (2003) Poverty Reduction: Self-Help Group Strategy UBSPD New Delhi, 180.
30.Ghadoliya Prof MK “Empowering women through self -help groups: Role of distance education”.
Retrieved from
http://www.col.org/pcf3/Papers/PDFs/Ghadoliya_M K.pdf
Somnath Mukhuti et. al. | Jan.-Feb. 2019 | Vol.8| Issue 1 | 113-131 131
(2001)’, National Commission for Women, New Delhi.
32.Krishan SK (2001) ‘Women’s Empowerment and Mutual Co-operation in the Family’, Social Welfare, 48-1.
33.Moyle TL, Dollard M, Biswas SN (2006) “Personal and Economic Empowerment in Rural Indian
Women-A Self-help Group Approach”,
International Journal of Rural Management (Sage Journal), 2 (2): 245-266, retrieved from http://irm.sagepub.com/content/2/2/245.abstract. 34.Purohit S (**) “Micro Credit and Women
Empowerment, Retrieved from
http://www.gdre.org.
35.Sabharwal G (2003) “From Margin to the Mainstream: Micro- finance Programmes and
Women Empowerment: The Bangladesh
Experience” Retrieved from http://www.gdre.org 36.Sudarshan R (1998) ‘Employment of Women:
Trends and Characteristics’, as in Haq & Haq, Human Development Report.
37.Wale VS, Deshmukh A (2011) “Women empowerment through self-help group”, Indian Streams Research Journal, I - IV, ISSN:-2230-7850.
38.Hazra BK (2017) ‘Media Convergence: Its prospect and role of empowering marginalized rural women in West Bengal’. Global Media Journal–Indian Edition Sponsored by the University of Calcutta, 8 (2):1-19
39.Mazumdar A (2014) “Empowerment of women in
India”, Retrieved from
http://www.shareyouressays.com/2884/1328-words-essay-on-womens-empowerment-in-india 40.Srivastava M (2009) “Essay on Women
Empowerment”, Social Science Research Network, October 4
41.The Statesman News Service (2013) State for more power to women, Kolkata. Retrieved from http://www.thestatesman.net/news/7131-state-for-more-power-to-women.html
42.Retrieved from Report of the Working Group on Empowerment of Women for the XI Plan, Ministry of Women and Child Development, Government of India.
43.Retrieved from
http://www.ifad.org/gender/learning/role/labour/in_ tamil.htm
44.Retrieved from
http://www.ipeglobal.com/social_economy.php 45.Retrieved from
http://www.ndi.org/womens-political-participation
46.Retrieved from
http://www.banglarmukh.gov.in/BanglarMukh/Do wnload?AlfrescoPath=Documents/Notice&FileNa me=Notice_Social_%20Policy_Women_05_07_13.p df.
47.Retrieved from
https://www.ideasforindia.in/topics/poverty- inequality/muktidhara-a-sustainable-livelihood-project-in-west-bengal.html
48.Retrieved from
https://www.cabdirect.org/cabdirect/abstract/20103 132916
49.Retrieved from
http://www.indiaonlinepages.com/population/west-bengal-population.html
50.Retrieved from
https://www.mapsofindia.com/west-bengal/geography/population.html