ISSN-L: 2501 - 1235 Available on-line at: www.oapub.org/edu
doi: 10.5281/zenodo.2541664 Volume 5 │ Issue 3 │ 2019
THE EXAMINATION ACCORDING TO THE POSITION OF
PLAYERS OF AEROBIC AND ANAEROBIC CAPACITY RELATION
IN PROFESSIONAL FOOTBALL PLAYERS
iYavuz K. Guldal,
Murat Bilgeii
Faculty of Sport Sciences, Kirikkale University, Turkey
Abstract:
The aim of this research is to examine the comparison of the aerobic and anaerobic capacity relationship according to positions of the professional football players (FP). The participants in this study were male FP (n = 32, Mage = 22.19, SD = 2.33, Mheight = 178
cm, SD = 0.04, Mweight = 73.05 kg, SD = 7.39, Mbodyfat % = 9.01, SD = 3.43, Mbodymasindex = 23.25,
SD = 2.23,) who professional trained regularly. They participated WAnT and shuttle run tests in order to measure anaerobic power (AnP) (MAnP = 14.31 watt/kg, SD = 1.57),
anaerobic capacity (AnC) (MAnC = 7.5 watt/kg, SD = 0.4), maximal heart rate (HRmax )
(MHRmax = 179 beat per minute, SD = 16.8) and maximal oxygen consumpt (VO2max )
(MVO’max = 51.8 ml/kg/min, SD = 4.25). According the positions (defence – midfield and
forward) of the FP, there isn't a statistical difference among HRmax, VO2max, AnP and
AnC (p>0.05). There is no longer the concept of classical position in today's football so the features specific to classical position change. All of the footballers perform in both attack and defense. In accordance with the coach tactics, midfielder and striker blocks are constantly moving back and forth as the field is shrinks and so each player is about the same distances.
Keywords: explosive strength, flexibility, lower limb strength, speed, strength
1. Introduction
Football is a sport required half-time activity which uses both aerobic and anaerobic system. The training frequency of the player continues potently from walking to sprint during the competition. Abrupt halt, depart and turns should be done by the sportsmen
i This study is based on the first author’s master thesis The Examination According to the Position of Players
│ │
are basic factors so that they can represent their performances just like running, strike, jumping in the best possible way and can get the strong aerobic and anaerobic components consisted of strength, speed and power combination during the match (Bangsbo et al., 2006; Tosun et al., 2017; Borras et al., 2017; Nitzsche et al., 2018).
The way of development as well aerobic and anaerobic endurance, flexibility and neuromuscular coordination features and the way of success with these abilities in the area make sportsmen obligatory to be in a specific point in most of the psychomotor parameters (Acikada et al., 1999; Scott, 2011; Li et al., 2018).
As football is a sports branch having feature of basic aerobic endurance, which can be sometimes very severe at irregular intervals, mostly reflecting the character of an anaerobic game and requiring multiple sports skills, many of scientific studies are need to be made for those who are dealing with this sport (Acikada et al., 1999; Vanderford et al., 2005; Borras et al., 2017).
Physical and athletic construction differences between defense and forward players disappear in football. This phenomenon must be normal. Advanced players with speed and quickness can resist to the players in high speed and quickness level. In football, sprint isn’t long more than 27,5 m. Usually it is about 4-5 meters. Because of the press application which is very important in today’s football, successive maximum efforts between 1 and 3 seconds must be done with short rest intervals (Rabson, 1987).
An effective training should be based on the physical methods appropriate to the structure of the individual, as well as on the physical and physiological needs of the sports branch. The aim of the training program applied to footballers is to improve their physical and physiological efficiency. The increasing of sportsmen efficiency is the result of directly quantity and quality of the performance carried out in training (Garganda et al., 1993; Dillern, 2017).
Football is related to anaerobic energy actions required sudden accelerations, direction changing, abrupt halts, head out to ball and shooting (Bompa, 1998; Scott, 2011). The increasingly gradually content and intensity of football make their anaerobic strength and capacities much more important. Football is a sport required intermediate activity which uses both aerobic and anaerobic system. The footballers must have strong aerobic and anaerobic components consisting of a combination of strength, speed and power in order to display their performances ideally such as running, hitting and jumping during the match. (Bangsbo and Michalsik, 2002; Dillern, 2017; Scott, 2011).
This research was to examine and compare according to their positions of aerobic and anaerobic capacity relation in professional footballers.
2. Method
2.1. Participants
Mage = 22.19, SD = 2.33, Mheight = 178 cm, SD = 0.04, Mweight = 73.05 kg, SD = 7.39, Mbodyfat %
= 9.01, SD = 3.43, Mbodymasindex = 23.25, SD = 2.23,) who professional trained regularly.
This research was conducted in accordance with the ethics statement of committee of the Kirikkale University before participation (Decision No: 127 Date; 29/06/2012.). Written parental permission was also provided for all volunteers.
2.2. Measures
In this study, after taken weight, height, body fat rate belonging to all players, WAnT and 20 meters’ shuttle run test was applied.
2.2.1. Body weight: In the measurement of person body weight, sensitive 0.01 kg
electronic scale with printer was used, produced by Huray Baskul Istanbul. There were only shorts on them; they were registered with barefoot and in anatomic upright position. The weighing results were recorded in the computer after to be seen on electronic indicator.
2.2.2. Height: The height of experimental group is measured by Soehnle Ultrasonic
Height measure when they are stand up and the values are recorded in cm in the positive of anatomic position, bale foot, abreast of wheels, hold his/her breath, frontal head and overhead tray is the same line of vertex point.
2.2.3. Heart Rate Measurements: The heart rate measurements of research group were identified Polars 810 measuring device and Polar Precision Software computer packaged software. Before installing, sticking, transmitter electrodes found within of transmitters are humidified sufficiently because in this way the conductance increases so they are contacted with skin. Transmitter is placed just above on chest cage. During the pulse measurement cell phone, television and just like this magnetics have been avoided.
2.2.4. Body Composition Measurements: On the purpose of determination of
│ │
to the point of extension, while he/she is pedaling in the lowest point of pedal and his/her foots are locked onto pedal by the help of clips. The weight corresponding to 7.5% of each research member body weight, during the test, is placed as a resistance weight on scale of bicycle and so test is started. First, they are demanded to maintain their pedal speed firstly 3-4 seconds unloaded, later with 30 seconds as loaded the highest possible maximal pedal speed. They are encouraged verbally during the test.
2.2.6. 20-meter Shuttle Run Test: This test designed for measuring aerobic power is
realized on non-slippery floor. During test, signal is arranged according to the signal from producer. In the case of access to the line before signal tone. The signal tone is waited for running another direction and if signal tone is missed two times, test has been finalized. For this application, marker funnels are placed on every two sides of 20-meter distance (Winnick and Short, 1999).
2.3. Procedure
Before the tests, calibration and linearity control has been made and reliability has been tested. Test and measurements are in 2 days. First day in the morning, player’s height, weight, body mass, body fat percentage and pulse indications have been taken. In the afternoon, 20-meter shuttle run test has been executed. The measurement has been made in sports hall.
2.4. Data analyses
Age (year), body weight (kg), height (cm), BMI (W/H2), body fat percentage and heart rate of the group have been obtained. Descriptive statistics (average, standard deviation, minimum-maximum) Kruskall Wallis H-test has been applied to find differences according to the different age groups of footballers’ anaerobic power, capacity number of shuttle and max VO2 values and according to their positions. Height, body weight and descriptive statistics belonging to VKI values have been obtained. For statistical analysis, SPSS 17.0 package software is used.
3. Results
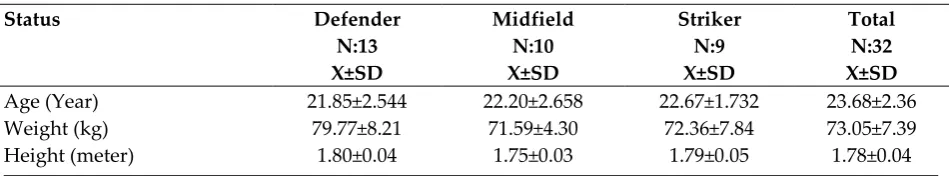
In this part, table and comments related to descriptive results of soma parameters acquired from research group according to the differences relevant to positions and age groups have been showed. Ages, weights, heights, body mass index, maximal heart rate speeds, AnP, AnC values of football players are given in Table 1.
Table 1: Antropometric and Physiologic values according to the status of
Professional Men Professional Footballers
Status Defender
N:13 X±SD
Midfield N:10 X±SD
Striker N:9 X±SD
Total N:32 X±SD
Age (Year) 21.85±2.544 22.20±2.658 22.67±1.732 23.68±2.36
Weight (kg) 79.77±8.21 71.59±4.30 72.36±7.84 73.05±7.39
BF (%) 10.77±3.48 7.47±2.54 8.18±3.38 9.01±3.43
BMI 23.81±2.62 23.32±1.91 22.35±1.85 23.25±2.23
AnP (W/kg) 14.31±1.65 13.60±1.73 15.11±0.89 14.31±1.57
AnC (W/kg) 7.55±0.38 7.44±0.53 7.73±0.36 7.57±0.43
Hrmax (beat/min.) 185.6±16.4 176.5±17.5 172.1±14.6 179.0±16.8 VO2max (ml/kg/mn) 50.67±5.08 51.525±2.871 53.75±3.96 51.80±4.25
Descriptive values have been calculated according to the status of those consisting research groups and finally by dealing with all footballers.
According to the difference in age groups and status of anaerobic power capacity, the number of shuttle and max VO2 values, tales and comments are given
below.
Average and standard deviation values according to the age groups of research team are given in Table 2.
Table 2: Average and standard deviation values according to the age groups of research team
Age Weight Height BMI
19-22 age (n=9) X±SD 73.98 ±6.53 1.80±.05 22.81±1.93
23-24 age (n=13) X±SD 73.12±9.05 1.78±.04 23.05±2.76
25 age and over (n=10) X±SD 75.66±6.10 1.77±.04 23.90±1.72
Total (n=32) X±SD 74.15±7.39 1.78±.04 23.25±2.23
When Table 2 was examined, it seems that age group 25 and over body weight and VKI values are higher than others and the height of 19-22 age groups is more than other age groups. According to the VKI parameters from research group, the highest VKI value is 25 and over.
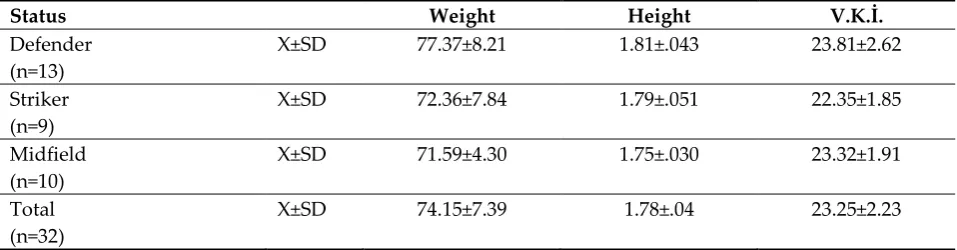
Table 3: Average and standard deviation values according to their status
Status Weight Height V.K.İ.
Defender (n=13)
X±SD 77.37±8.21 1.81±.043 23.81±2.62
Striker (n=9)
X±SD 72.36±7.84 1.79±.051 22.35±1.85
Midfield (n=10)
X±SD 71.59±4.30 1.75±.030 23.32±1.91
Total (n=32)
X±SD 74.15±7.39 1.78±.04 23.25±2.23
Examined Table 3, it seems that body weight, height and VKI values of defense players are higher than other players. Kruskal Wallis H-test results are given in Table 4 according to the status of anaerobic power, capacity, number shuttle, and Max VO2
│ │
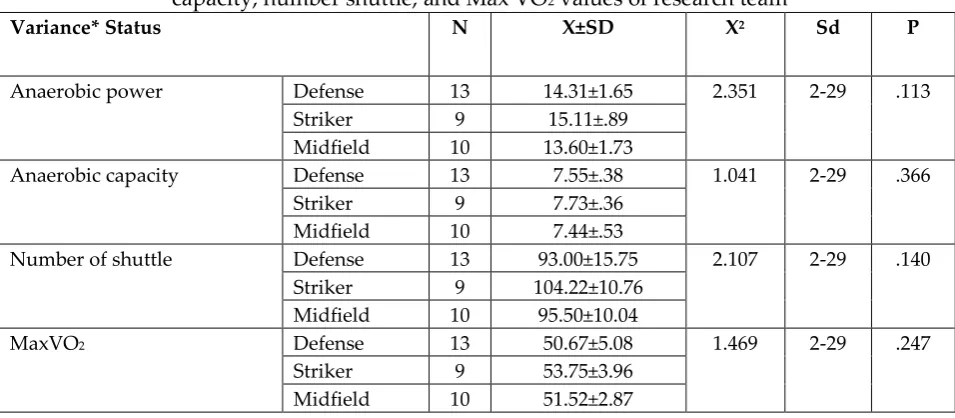
Table 4: Kruskal Wallis H-test results according to the status of anaerobic power, capacity, number shuttle, and Max VO2 values of research team
Variance* Status N X±SD X2 Sd P
Anaerobic power Defense 13 14.31±1.65 2.351 2-29 .113 Striker 9 15.11±.89
Midfield 10 13.60±1.73
Anaerobic capacity Defense 13 7.55±.38 1.041 2-29 .366 Striker 9 7.73±.36
Midfield 10 7.44±.53
Number of shuttle Defense 13 93.00±15.75 2.107 2-29 .140 Striker 9 104.22±10.76
Midfield 10 95.50±10.04
MaxVO2 Defense 13 50.67±5.08 1.469 2-29 .247
Striker 9 53.75±3.96 Midfield 10 51.52±2.87
When Table 5 is examined it seems that anaerobic power, capacity, number of shuttle and Max VO2 values don't show any differences in terms of the status (p>0.05).
Considering this finding, it is estimated that defender, striker and midfields have similarities in terms of anaerobic power, capacity, number of shuttle and Max VO2
values.
Table 5: Kruksal Wallis H-test results according to the age groups of anaerobic power,
capacity, number shuttle, and Max VO2 values of research team
Variance* Status N X±SD X2 Sd P
Anaerobic power Defense 13 14.31±1.65 2.351 2-29 .113 Striker 9 15.11±.89
Midfield 10 13.60±1.73
Anaerobic capacity Defense 13 7.55±.38 1.041 2-29 .366 Striker 9 7.73±.36
Midfield 10 7.44±.53
Number of shuttle Defense 13 93.00±15.75 2.107 2-29 .140 Striker 9 104.22±10.76
Midfield 10 95.50±10.04
MaxVO2 Defense 13 50.67±5.08 1.469 2-29 .247
Striker 9 53.75±3.96 Midfield 10 51.52±2.87
Kruskal Wallis H-test results according to the age groups of anaerobic power, capacity, number shuttle, and Max VO2 values of research team.
Examined Table 4 there are no differences through age groups in terms of anaerobic power, capacity, number shuttle, and Max VO2 values of research team
(p>0.05). In regards of this finding, the footballers in different age groups have similarities values in terms of anaerobic power, capacity, number shuttle, and Max VO2
4. Discussion
The height and weight are the most distinct and observable physical qualities for choosing footballer. In nowadays football, the importance of struggle shows an advance. The players who are powerful physically can survive. It can be seen differences according to the status in height and weight of footballers. These differences can be normal. The excess of weight and fat tissue can affect physical performance negatively. It is known that those whose body fat level is low, can show higher performance in comparison with those whose body fat level is higher (Kizilet et al., 2004). It is detected that the average of age is 24,75 ±5.17-year, height is 179,58 ±6.1 cm, body mass is 72.43± 8.31 of the footballers from third team who participate to the study made by Marangoz and Gencay (2017). In the study made by Duyul (2005) it is found that average of age is 23.33 ±1.33-year, height is 173,85 ±4.75 cm, body mass is 72.43± 8.31. In the study made by Tas (2006) it is detected that average of age is 23.53 ±3.6-year, height is 173 ±5.1 cm, body mass is 67.84± 5.1, and finally in this study made by Kutlu et al. (2007) to Kirikkale sport professional players, the height has found as 178 ±3.05.
Statistical data in each four studies show similarities in this study. Anthropometric features (heights, weights, body fast rates) can affect the performances of footballers. Weight of anthropometric features is an important factor in skill. The excess of body weight and body fat rate will be able to limit the skill in proportion to muscles. As for Alemdaroglu et al. (2007), the footballers with normal value will be more successful in body weight parameter.
In the study made by Casajus (2001), in Espanola league 15 elite professional footballers' body fat percentage is determined as 8.2±0.91. Another study realized by Sergezj (2003), has shown that total body fat percentage of footballers who participate in this study is 9.6±2.5. In the study made by Tamer (1995), they found Galatasaray football team's body fat percentage average is 7.36±0.48, that of Konyaspor is 7.03±0.64. One another study made by Marangoz and Gencay (2017), it is shown that average fat percentage of footballers is registered as 8.35±3.24. The study made by Sergezj (2003) shows some similarities with our study. The differences between studies made by Ozberk et al. (2009) and Marangoz and Gencay (2017) and our study show less fat percentages of elite footballers and also group, and personnel differences can be delivered from league and period differences.
There is no absolute data about ideal total body fat percentage intended for sport branches. Although sportsmen are in the same sport branches according as genetic and other factors, they can have body fat which they can present different performances. That's why there can be some similarities and differences between body fat percentage averages that we obtained in the literature. These differences may be related to the difference of practice levels, eating habits or method and formulations used for calculation.
There is no a statistical difference through maximal oxygen capacities (VO2max),
│ │
footballers consisting research group. (p>0.005). Although there is an approximate 55% correlation positively between maximal oxygen capacities (VO2max) and anaerobic
capacities (AnC), the correlation values obtained is meaningless statistically (p>0.05). Although there is an approximate 19% correlation positively between maximal oxygen using capacities (VO2max) of midfielders and anaerobic capacities (AnC),
correlation values obtained isn't meaningfully statistically (p>0.05). Although there is an approximate 36% correlation positively between maximal oxygen using capacities (VO2max) of strikers and anaerobic capacities (AnC), correlation values obtained isn't
meaningfully statistically (p>0.05). Although it is found 9% correlation between maximal oxygen using capacities (VO2max) of defenders and anaerobic powers (AnP),
correlation values obtained is meaningless statistically (p>0.05). Although it is found 2% correlation between maximal oxygen using capacities (VO2max) of defenders and
anaerobic powers (AnP), correlation values obtained is meaningless statistically (p>0.05). Although it is found 0.3% correlation negatively between maximal oxygen using capacities (VO2max) of strikers and anaerobic powers (AnP), correlation values
obtained is meaningless statistically (p>0.05).
In the conclusion of ANOVA test made in terms of maximal heart rate (KAHmax) showing whether there is a difference or not, there has no significant difference(p>0.05). There was no significant difference between aerobic and anaerobic capacities relation according to the status (Defense, midfield- striker, defense-striker) of professional footballers’ constituent research group (p>0.05).
In the study that Minahan et al. (2007) have made, the relation between anaerobic power and anaerobic capacity has been evaluated. 7 men and 7 women have been tested Wingate anaerobic and anaerobic power, anaerobic capacity and tiredness index have been detected. According to the findings of this study, high anaerobic power doesn't indicate better anaerobic capacity and additionally there is relation about anaerobic capacity to be able to protect power problem for 30 seconds bicycle sprint (Minahan et al., 2007; Ostojic, 2003).
The aim of the study made by Al-Hazzaa et al. (2001) is to detect the relation between aerobic and anaerobic power data of elite footballers. 23 national team footballers have participated in this study. Anaerobic powers of the footballers were tested by Wingate anaerobic test and in 5, 10, 20 and 30 seconds anaerobic power and anaerobic capacity values have been taken. Respiratory anaerobic step value of footballers is 43, 6ml.kg-1. min.-1 and when body fat percentages (12,3±2.7%), anaerobic power values 873,6± 141.8W, anaerobic capacities are recorded as 587.7± 55.4 W (Al-Hazzaa et al., 2001).
physiological profiles the sportsmen playing in Irish football examined by Mclntyre and Hall (2005), they have found that midfields players can product more power in vertical jumping than defenders and attackers. There is no meaningful difference among defend, attack and midfield players in Wingate test both absolute and relative power values (Mclntyre and Hall, 2005).
In the studies compared of young footballers’ anaerobic tests of Alemdaroglu et al. (2007), it hasn't been found any relation in anaerobic power, anaerobic capacity and fatigue indications. Additionally, there was a meaningful relation in anaerobic power, heart rate and average oxygen consumption (Alemdaroglu et al., 2007). In the studies of Bostanci et al. (2004), on amateur footballers, they compared the footballers according to their status, but they can't find a meaningful difference (Bostanci et al., 2004). In the studies compared of 125 young footballers’ anaerobic tests of Alemdaroglu et al. (2007), they haven't found a meaningful relation in anaerobic power, anaerobic capacity and fatigue indications (Alemdaroglu et al., 2007). Vardar et al. (2001), have compared wingate anaerobic power test and speed running test values according to the statues of professional footballers and in these test, they especially emphasized that strikers are better in both Wingate test values and speed tests (Vardar et al., 2001). Whereas the heights of players participated in our study are parallel with the height values in literature, their weights are lower than the literature values. In the study made by Arnason et al. (2004), about total 301 elite players from on Iceland football first and second league team, they determined that body fat percentage is average 10,5%, in Al Hazzaa Saudi professional football players' body fat percentage 12,3%, Rico Snaz Spain elite footballers' body fat 10% (Arnason et al., 2004).
In our study, body mass index values in defenders is 23.81±2.62 kg/m2, in midfielders is 23.32± 1.91 kg/m2, in strikers is 22.35± 1.85 kg/m2. As to body, fat percentage is 10.77 ±3.43 in defenders, in midfielders is 7.47 ± 2.54, in strikers is 8.18 ±3.38. These values match up with body mass index values in literature, but the body fat percentages are lower than literature values. The reason of these low values can be probably related to low age averages and for this reason, the fat rate of body mass is lower because of the age. In our study, all group of body fat rate is the same value, so we believe it results from the difference age groups of footballers and different exercises. In his study, Karakoc (2009) has studied for determining aerobic and anaerobic energy systems with 12 volunteers in the age group of 15 struggling on the background of professional football team consequently it has been no significant relation in distance following Yo-Yo tests. Compared with VO2max values directly
measured and the distance, it has been no important difference, either. The relation between Yo-Yo IR tests and VO2max isn’t parallel so the results from Yo-Yo IR tests
don’t reflect exactly direct measure results made on treadmill; it reflects better repetitive exercises construction including violent actions (Bangsbo et al., 2006). Based on these results, it is thought it will be better to use these tests for determining endurance performance and for pursuit of endurance performance instead of specifying of VO2
│ │
KAHmax values, a significant difference was found. This difference is related to KAH max value obtained from KAH max from endurance test and VO2max test. It can be said
that according to these results, IRT1 and IRT2 tests are interchangeable. When the anaerobic construction of anaerobic is examined, an important difference was not found in average power from Wingate test and highest power values with distance following Yo-Yo tests. According these results, anaerobic capacity contents of Yo-Yo tests contents can be interpreted as low.41 professional football players from Turkey Super league (22 persons) and Turkey Bank Asya League (19 persons) have participated in the study of Taka. They are grouped by their statues as defenders, midfielder and striker and it was studied to be compared with footballers’ physical convenience levels according to their statues. As a result, there is a difference in physical convenience parameters according to their statues. Between the groups, there was no difference in related to flexibility, agility, BKI, weight, speed, fat rate values and the reason of these was thought that most of the footballers’ life has the same background and also has the same exercises programs. With the chance of nowadays football, unfortunately notion of classic football is eliminated. For this reason, the features special to classic position required for each position change. All footballers have both attack and defense missions. In parallel with requirements of coaches, as the field gets smaller, defense, midfield and strike blocks move constantly so each footballer approximately pass the same distance.
5. Conclusion
There is a difference in physical convenience parameters according to their statues. Between the groups, there was no difference in related to flexibility, agility, BKI, weight, speed, fat rate values and the reason of these was thought that most of the footballers’ life has the same background and also has the same exercises programs. With the chance of nowadays football, unfortunately notion of classic football is eliminated. For this reason, the features special to classic position required for each position change. All footballers have both attack and defense missions. In parallel with requirements of coaches, as the field gets smaller, defense, midfield and strike blocks move constantly so each footballer approximately pass the same distance.
Acknowledgements
The authors declare that they do not have any conflict of interest in accordance with the journal policy and disclose no professional relationships with companies or manufacturers who will benefit from the results of the present study.
Conflict of interest
The authors have no conflicts of interest to declare.
Disclosure
References
Acikada, C., Hazir, T., Asci, A., Turnagol, H. (1999). The physical and physiology profile, football science and technology journal of a second league football team during pre-season training. (1): 14-20.
Alemdaroglu, B., Asci, A., Hazir, T. (2007). Comparison of anaerobic tests in young soccer players. Journal of Sports Science & Medicine: 10-114.
Hazzaa, Hm., Almuzaini, K.S., Refaee, S.A., Sulaiman, M.A., Dafterdar, M.Y., Al-Ghamedi, A., Al-Khuraiji, K.N. (2001). Aerobic and anaerobic power characteristics of Saudi elite soccer players. J Sports Med. & Physical Fitness, 41(1): 54-61.
Arnason, A., Sigurdsson, S.B., Gundmundsson, A., Holme, I.; Engebretsen, L., Bahr, R. (2004). Physical fitness, injures, and team performance in soccer. Medicine & Science in Sports & Exercise (MSSE), 36(2): 278-85.
Bangsbo, J., Michalsik, L.B. (2002). Assessment of the physiological capacity of elite soccer players. In W. Spinks, T. Reilly, & A. Murphy (Eds.), Science and football IV: [Fourth World Congress of Science and Football, Sydney, Australia, 22-26 February 1999].
Bangsbo, J., Mohr, M., Krustrup, P. (2006). Physical and metabolic demands of training and match-play in the elite football player. J Sports Sci. 24 (7): 665-74.
Borras, P.A., Herrera, J., Ponsetı, F.J. (2017). Effects of crossfit lessons in physical education on the aerobic capacity of young students. Journal of Physical Education & Health, Vol. 6 (10): 5-11.
Bostanci, O., Tasmektepligil, Y., Ayyildiz, M. (2004). The Effects on Physical and Physiological Parameters of the preparatory period in amateur footballers, Gazi University, Journal of Physical Education and Sports Science, 9(2): 43-58.
Casajus, J.A. (2001). Seasonal variation in fitness variables in professional soccer players. J Sports Med Phys Fitness, 41 (4): 463-9.
Dillern, T. (2017). Markers of the aerobic energy-delivery system as measures of post-match fatigue and recovery in soccer: a repeated measures design. Asian Sports Med. 8 (3).
Duyul, M. (2005). Comparation of effects to success of motor values and anthropometric characteristics of handball, volleyball and football player university teams. Ondokuz Mayıs University, Health Sciences Institute, Master Thesis, Samsun. Garganta, J., Maia, J., Silva, R., Natal, A. (1993). A comparative Study of Explosive leg
Strength in elite and non_elite young soccer players. London: Routledge: 304-306. Karakoc, B., Akalan, C., Alemdaroglu, U., Arslan, E. (2009). The relationship between the yo-yo tests, anaerobic performance and aerobic performance in young soccer players. Journal of Human Kinetics, 35: 81-88.
│ │
Kutlu, M., Sofi, N.; Bozkus, T. (2007). Changes in body compositions of elite level amateur and professional soccer players during the competitive season. Journal of Sport Science and Medicine, Supp. 10, http://www.jssm.org.
Li, Y. Niessen, M., Chen, X., Hartmann, U. (2018). Method-induced differences of energy contributions in women’s kayaking. International Journal of Sports Physiology and Performance, 13: 9-13.
Marangoz, I., Gencay, O.A. (2017). A comparison with physiological characteristics of kahramanmarassport and siirtsport professional football teams at the competition season. The Journal of Academic Social Science, 56: 374-385.
Minahan, C., Chia, M., Inbar, O. (2007). Does power indicate capacity? 30-s Wingate anaerobic test vs. maximal accumulated O2 deficit. J Sports Med. & Physical Fitness, 28(10): 836-43.
Mclntyre, M.C., Hall, M. (2005). Physiological profile in relation to playing position of elite college Gaelic footballers. British Journal of Sport Medicine, 39(5): 264-266. Nitzsche, N., Baumgartel, L., Schulz, H. (2018). Comparison of maximum lactate
formation rates in ergometer sprint and maximum strenght loads. Dtsch Z Sportmed. 69: 13-18.
Ostojic, S.M. (2003). Seasonal alterations in body composition and sprint performance of elite soccer players. Journal of Exercise physiology online, 6(3): 11-14.
Ozberk, N.Z., Oner Coskun, O., Akin, S., Korkusuz, F. (2009) Isokinetic strength of quadriceps and hamstring muscles in soccer players: playing in different leagues. Journal of Sport Sciences, 1 (1): 17-23.
Rabson, B. (1987). Brayn Rapson’s soccer skills, Edited Turrell. The Hamlyn Publishing Grouplim: 106-113, London-England.
Scott, C. (2011). The effect of time-under-tension and weight lifting cadence on aerobic, anaerobic, and recovery energy expenditures: 3 submaximal sets. Appl. Physiol. Nutr. Metah. 37: 252-256.
Sergezj, M., Ostojic (2003) Seasonal Alterations In Body Composition. Journal of Exercise Physiology, Vol. 6, Number 3.
Tamer, K. (1995). Measuring and evaluating the physical-physiological performance of the sport, Turkerler Bookstore: 81-180, Ankara.
Tas, M. (2006). The effect of sprint exercises on serum superoxide dismutase, catalase and malondialdehyde levels in soccer players. Ataturk University, Health Sciences Institute, Department of Physical Education and Sports, Master Thesis: 27-39, Erzurum.
Tosun, G., Hurmuz, K, Gokmen, O. (2017). The relationship between aerobic capacity and match performance in team-handball. Kinesiologia Slovenica, 23: 5-11.
│ │
Creative Commons licensing terms