Published by Science and Education Publishing DOI:10.12691/jfs-8-2-5
Prevalence of Household Food Insecurity among
Households in Selected Areas in Bangladesh
Md. Nahian Rahman1,*, Syeda Saima Alam2, Mahbubur Rahman3, Shaidaton Nisha1, Khaleda Islam4
1
MSc, Institute of Nutrition and Food Science, University of Dhaka, Bangladesh 2
Lecturer, Department of Food Technology and Nutrition Science, Noakhali Science and Technology University, Bangladesh 3
Nutrition Consultant, UNICEF, Bangladesh 4
Professor, Institute of Nutrition and Food Science, University of Dhaka, Bangladesh *Corresponding author: [email protected]
Received June 14, 2020; Revised July 15, 2020; Accepted July 24, 2020
Abstract
Household food insecurity is where no-one in the household has physical, social and economic access to sufficient, safe and nutritious food that meets dietary needs and food preferences for an active and healthy life at all times. A cross-sectional study was conducted in Dhaka ,Mymensing, Khulna and Sylhet division of Bangladesh. Total 100 households were selected by multistage sampling. Data were collected using structured and pretested questionnairethrough interviewing household heads. Data were analyzed using SPSS version 23 statistical package. Descriptive statistics and chi square were performed to achieve study objectives. It was found that about 19% households were food insecure. Of those households, 6% were mildly food insecure, 11% and 2% households were moderately and severely food insecure, respectively. Findings suggest that attention is needed on stabilization of food markets, and job opportunities should be created to improve household food insecurity in these study areas.Keywords
: household food insecurity, prevalence, food security, Bangladesh, Household Food Insecurity Access Scale (HFIAS), householdCite This Article:
Md. Nahian Rahman, Syeda Saima Alam, Mahbubur Rahman, Shaidaton Nisha, and Khaleda Islam, “Prevalence of Household Food Insecurity among Households in Selected Areas in Bangladesh.”Journal of Food Security, vol. 8, no. 2 (2020): 72-76. doi: 10.12691/jfs-8-2-5.
1. Introduction
Adequate food in terms of quantity and quality for all people at all time is vital to a nation growth. Consuming less food in long terms leads to hunger and starvation [1]. Indicators of food security include availability of food, economic and physical access to food, adequate food utilization and sustainably having access to adequate food
[2]. Food insecurity exists when all people, at all times, secure access to sufficient amounts of safe and nutritious food that meets their dietary needs and food preferences for an active and healthy life [3]. During food insecurity, people are not consuming enough food for an active and healthy life. This is due to the unavailability of food, inadequate purchasing power or inappropriate utilization at household level [4]. Household food insecurity can be chronic and transitory in its type. Chronic food insecurity is often the result of extended periods of poverty, lack of assets and inadequate access to productive resources. Transitory household food insecurity is primarily caused by short term shocks and fluctuations in food availability and food access, including year-to-year variations in domestic food production, food prices and household income [5]. Household food insecurity is one of major public health problems in both developing and developed nations [4]. Based on Food and Agricultural Organization
(FAO) report, 805 million (11.3%) global populations were unable to meet their dietary energy supplies in 2012-2014. In developing countries, 791 million people live in hunger, which means 13.5% of the overall population remains underfed [6]. Achieving food security for all people at all times remains a huge challenge for several developing countries.
2. Methods
2.1. Study Setting
The study was conducted in Dhaka, Mymensing, Sylhet and Khulna District in Bangladesh
2.2. Study Design, Period, and Sample Size
A community-based cross sectional study was conducted from January 01 to March 30, 2018. Total 100 households were selected by multistage sampling.
2.3. Sampling Technique
randomly selected from the total of 8 districts. Household number was equally distributed to each of the selected districts. Finally, systematic random sampling technique was employed to select households to be visited for data collection.
Data collection method used for this study
Data were collected using pretested and structured questionnaire. Household Food Insecurity Access Scale (HFIAS) developed by FANTA and validated for urban and rural was used [7]. Moreover, 12 food groups suggested by FANTA using a 24-h recall method were used to assess Household Dietary Diversity Score (HDDS)
[7,8,9]. Questionnaire was initially prepared in English
and translated to Bengali and finally back translated to English to check consistency and accuracy by language experts.
Data quality assurance
Enumerators and supervisors were trained for 2 days, 1 week prior to date of data collection on: study objectives, key highlights in methods to assess household food insecurity, data collection and interviewing approach, and data recording. Pretesting was done with 20 households. Data collection was strictly supervised in daily basis. Data were then checked for completeness and consistency before data entry and than exported to SPSS version 23 for further data processing and/or analysis.
Data processing and analysis
Households were classified based on responses to the nine severity items in the HFIAS and coded “0” for “No” and “1” for “Yes.” The procedure for scoring was used as follows: “0” was attributed if the event described by the question never occurred, “1” if it occurred during the previous 30 days. With regard to the occurrence, “1” was attributed if the events rarely occur, “2” sometimes and “3” often. Therefore, responses on the nine HFIAS questions were summed using the SPSS 23 program to create household food security score, with a minimum of “0” and a maximum score of “27.” According to the score, the higher the score, the more the household is vulnerable to food insecurity. The lower the score, the lesser the food insecurity a household experienced. Therefore, HFIAS score of 0-1 is categorized as food secure, 2 and above were considered as food insecure. Households scored 2-7, 8-14 and 15-27 were categorized to be mildly, moderately and severely food insecure households, respectively.
3. Results
3.1. Sociodemographic and Socioeconomic
Characteristics of Households
A total of 100 household heads participated in this study. The mean age of household head was 46.30 years, and majority of the household heads (88%) were males. Larger segment of participants 82% were married, and about 63 (63%) households have 4-6 family members. Besides, households with ≤2 dependent members were 73
(73%), and household heads attended formal education were 83 (83%). In terms of livelihood, among household heads included, 62 (62 %) were self-employed and 49 (49%) had monthly income of 10,001-20,000 Taka. (Table 1).
Table 1. Sociodemographic characteristics of the respondents
Variable N = 100 Category Frequency %
Sex of HH head Male 88 88
Female 12 12
Age of HH head 20-40 57 57
41-64 39 39
65 and above 4 4
Family size 1-3 23 23
4-6 63 63
7 and above 14 14
Religion Muslim 62 62
Hindu 30 30
Others 8 8
Marital status of HH head Married 82 82
Unmarried 1 1
Divorced 4 4
Separated 3 3
Widowed 10 10
Educational status No formal education 17 17
Formal education 83 83
Occupation of HH head Self-employed/Bussiness 62 62
GOV/NGO employed 21 21
Daily wage 17 17
Monthly income ≤10,000 Taka 19 19
10,001-20,000 49 49
≥20,001 32 32
3.2. Prevalence of Household Food Insecurity
in the Study Area
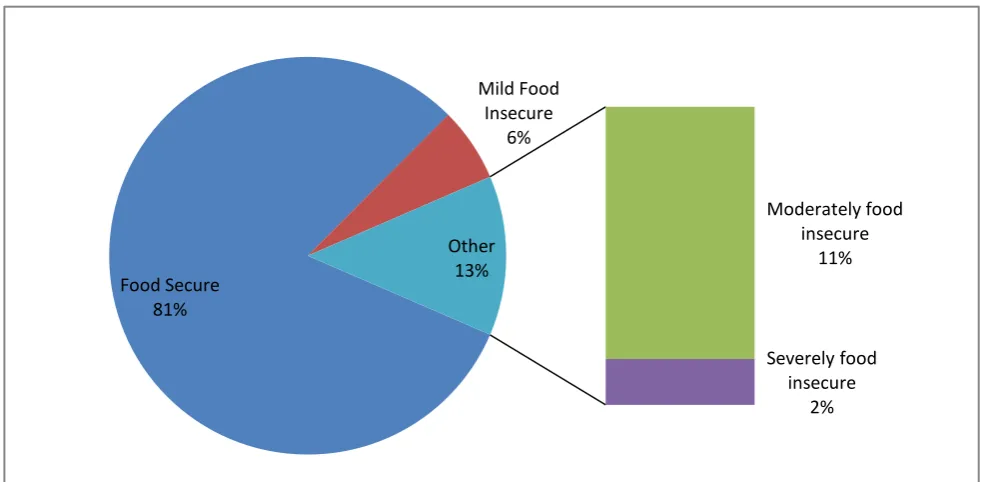
The mean (SD) dietary diversity score of households was 6.13 (±1.31). 23 (23 %) households were poorly diverse dietary consumers (who consume ≤5 food groups), 49 (49%) households belonged to medium dietary diversity category (who consume 6-7 food groups) and 28 % of households are classified as diverse dietary consumers (who consume >7 food groups). Based on set cutoff points, 6 (6%) households classified as mildly food insecure. Households classified as moderately and severely food insecure were 11 (11%) and 2 (2%), respectively (Figure 1).
Figure 1. Household food security status
Table 2. Occurrence of HFIAS conditions
Indicator No- N(%) Yes- N(%)
Worry about not having enough food? 81 (81%) 19 (19%)
Unable to eat preferred food 77(77%) 23(23%)
Eat just a few kinds of food 82(82%) 18(18%)
Eat food really do not want 76(76%) 24(24%)
Eat smaller amounts in meal 72(72%) 28(28%)
Eat fewer meals in a day 81(81%) 19(19%)
No food of any kind in household 97(97%) 3(3%)
Go to sleep hungry at night 96(96%) 4(4%)
Go a whole day and night without food 100(100%) 0(0%)
Figure 2. HFIAS domain showing percentage distribution of households Food Secure
81%
Mild Food Insecure
6%
Moderately food insecure
11%
Severely food insecure
2% Other
13%
Percentage(%)
19% 23%
28%
Anexiety & Uncertainity Insufficient food quality Insufficient food
3.3. Domains of Household Food Insecurity
The nine items can further be summarized into three major domains: (I) feelings of uncertainty or anxiety about the household food supplies (represented by item 1), (II) perceptions that household food is of insufficient quality and food type preference (signified by items 2-4), and (III) insufficient food intake and its physical consequences (items 5-9). The computed percentage for anxiety and uncertainty domains was 19 (19%), for the insufficient food quality domain 23 (23%) and insufficient food intake and its physical costs domain was 28 (28%) in the study area (Figure 2).
4. Discussion
This study looked at the level of household food insecurity using validated HFIAS. A total of 19% households were food insecure (6%, 11 %and 2%, mildly, moderately and severely food insecure, respectively). The state of household food insecurity (37.6%) identified in this study was analogous with studies done in Shashemene (36%), Kenya (38%) and national report (35%) [10-13]. However, it was lower than findings reported by studies conducted in South Delhi and Malda district of India (77.2 and 68.38%), Kinshasa (70%), Addis Ababa city (75 and 58.2%), Dire Dawa town (43%), Farta district (70.7%), Manna district (42.9%), Offa district (57%) and Boloso Sore district (65.5%) [14-20]. The possible reason to variation might be the coincidence of the data collection with a harvest season, where food is more available and the prices are relatively low. Thus, lower household food insecurity in this study might be associated with harvesting season of the year where the study was performed. In contrary, the finding observed in this study tends to be higher than the findings of some studies such as Pakistan (19%), Humbo (28.4%) and urban areas of Ethiopia (28.0%) [21,22,23]. The disparity might be due to the agro-ecological differences in settings and socioeconomic variations among study areas.
5. Limitations of the Study
Data collection was done by HFIAS (relies on the recall of events occurred in the last four weeks). Concurrence of study period with harvest season might underestimate the situation of household food insecurity in the setting. Besides, overestimation or underestimation related to monthly income and expenditure of household were the possible limitations of this study.
6. Conclusions
The findings shown as higher extent of households were food insecure in the study area than national rate. Municipality, health and agriculture sector, and other stakeholders need to take action toward improving household food security state in the study area. Actions should focus on: strengthening micro-finance and small business enterprise to increase access to food via
amplified income, design strategies on household food security program [e.g., Productive Safety Net Program (PSNP)]; strengthening family planning methods, stabilization of food markets/prices and income generating activities should be encouraged. Besides, backup of saving practice to ensure resilience for food insecure households is also needed. Further studies are desirable to come across seasonal variations of household food insecurity in urban setting.
References
[1] Gebre GG. Dimensions of Urban Food Insecurity: the Case of Addis Ababa, Ethiopia. J Agric Econ Rural Dev. 2014; 2(1): 1-9.
[2] Food Security Concepts and Frameworks, in EC-FAO Food Security Information for Action Programme. 2008, FAO.
[3] Bryceson DF. Nutrition and the commoditization of food in sub-Saharan Africa. Soc Sci Med. 1989; 28(5): 425-40.
[4] Worku Endale ZBM, Azeb A, Akilew AA. Food Insecurity in Farta District, Northwest Ethiopia: a community based cross-sectional study. BMC Res Notes. 2014; 7: 130.
[5] Mustaquim MIDM. Food Insecurity and Indian Muslims. IOSR J Humanit Soc Sci. 2013; 11 (1): 121-6.
[6] MOH. Training course on the management of severe acute malnutrition. In: Addis Ababa, Ethiopia; 2013.
[7] Gebreyesus SH, Lunde T, Mariam DH, Woldehanna T, Lindtjørn B. Is the adapted Household Food Insecurity Access Scale (HFIAS) developed internationally to measure food insecurity valid in urban and rural households of Ethiopia? BMC Nutr. 2015; 1(2): 2-10.
[8] Jennifer Coates AS, Paula Bilinsky. Household Food Insecurity Access Scale (HFIAS) for measurement of food access: Indicator Guide, Version 3. August 2007.
[9] Swindale A, Bilinsky P: Household Dietary Diversity Score (HDDS) for measurement of household food access: indicator guide FANTA III. September 2006; 2.
[10] Kaloi B, Tayebwa B, Bashaasha B. Food security status of households in Mwingi District, Kenya. Afr Crop Sci Conf Proc. 2005; 7: 867-73.
[11] Mitiku A, Fufa B, Tadese B. Empirical analysis of the determinants of rural households food security in Southern Ethiopia: The case of Shashemene District. Basic Res J Agric Sci Rev. 2012; 6(1): 132-9.
[12] Belachew T, Hadley C, Lindstrom D, Gebremariam A, Michael KW, Getachew Y, Lachat C, Kolsteren P. Gender differences in food insecurity and morbidity among adolescents in southwest Ethiopia. Pediatrics. 2011; 127(2): e398-405.
[13] Abo T, Kuma B. Determinants of food security status of female-headed households: the case of Wolaita Sodo town, South Nations, Nationalities and Peoples Region, Ethiopia. Int J Sci Foot Prints. 2015; 3(2): 8-24.
[14] Bogale Gebeyehu GR, Tebeje M. Rural households food security and livelihood strategies: the case of Offa woreda, in wolaita Sodo Zuria, Southern Nation, Nationalities and Peoples Regional State, Ethiopia. IJRESS. 2014; 4(7)91-104.
[15] Chinnakali P, Upadhyay RP, Shokeen D, Singh K, Kaur M, Arvind K, Singh A, Goswami A, Yadav K, Pandav CS. Prevalence of household-level food insecurity and its determinants in an Urban Resettlement Colony in North India. J Health Popul Nutr. 2014; 32(2): 227-36.
[16] Ismail M. Status of food security in some selected villages in Malda District. Soc Sci. 2012; 2: 64-87.
[17] Lebailly P, Muteba Kalala D. Characteristics of Urban Food insecurity: the case of Kinshasa. Afr Rev Econ Financ. 2011; 3(1): 58-68.
[18] Leza T, Kuma B. Determinants of rural farm household food security in Boloso Sore District of Wolaita Zone in Ethiopia. Asian J Agric Ext Econ Sociol. 2015; 5(2): 57-68.
[20] Ismail M, Mustaquim DM. Food Insecurity and Indian Muslims. IOSR J Humanit Soc Sci. 2013; 11(1): 121-6.
[21] Guja MM. Household food security status and coping strategies in Humbo Wereda, SNNPR, Ethiopia. Int J Sci Basic Appl Res. 2012; 6(6): 77.
[22] Bashirab MK, Schilizzi S, Pandita R. Livestock and rural household food security: the case of small farmers of the Punjab,
Pakistan working paper 1207. School of Agricultural and Resource Economics, University of Western Australia, Crawley, Australia; 2012.
[23] Shone M, Demissie T, Yohannes B, Yohannis M. Household food insecurity and associated factors in West Abaya district, Southern Ethiopia, 2015. Agric Food Secur. 2017; 6(2): 1-9.