Clinical Decision Support Systems: A Visual Survey
Kamran Farooq
Computing Science and Mathematics Division, University of Stirling, Scotland, UK E-mail: kfa@cs.stir.ac.uk
Bisma S Khanand Muaz A Niazi
Department of Computer Science, COMSATS University Islamabad, Islamabad, Pakistan E-mail: bis.sarfraz@gmail.com, muaz.niazi@ieee.org
Stephen J Leslie
Raigmore Hospital, Inverness, Scotland, UK E-mail: stephen.leslie@nhs.net
Amir Hussain
Computing Science and Mathematics Division, University of Stirling, Scotland, UK E-mail: ahu@cs.stir.ac.uk
Overview Paper
Keywords: cardiovascular decision support systems, CiteSpace, clinical decision support system, scientometrics, visualization
Received: March 28, 2017
Clinical Decision Support Systems (CDSS) form an important area of research. In spite of its importance, it is difficult for researchers to evaluate the domain primarily because of a considerable spread of relevant literature in interdisciplinary domains. Previous surveys of CDSS have examined the domain from the perspective of individual disciplines. However, to the best of our knowledge, no visual scientometric survey of CDSS has previously been conducted which provides a broader spectrum of the domain from the perspective of multiple disciplines. While traditional systematic literature surveys focus on analysing literature using arbitrary results, visual surveys allow for the analysis of domains by using complex network-based analytical models. In this paper, we present a detailed visual survey of CDSS literature using important papers selected from highly cited sources on the Clarivate Analytics’ Web of Science. Our key results include the discovery of the articles which have served as key turning points in literature. Additionally, we have identified highly cited authors and the key countries of origin of top publications. We also present the universities with the strongest citation bursts. Finally, our network analysis also identifies the key journals and subject categories both in terms of centrality and frequency. It is our belief that this paper will thus serve as an important guide for researchers as well as clinical practitioners interested in identifying key literature and resources in the domain of clinical decision support systems.
Povzetek: Predsatavljen je pregled sistemov za podporo odločanju v zdravstvu.
1
Introduction
Clinical decision support system (CDSS) is a significant field of health information technology. It is designed to assist clinicians and other healthcare professionals in the diagnosis and decision-making. CDSS uses healthcare data and the patient’s medical history to make recommendations. By using a predefined set of rules, CDSS intelligently filters knowledge from complex data and presents at an appropriate time [1]. By adopting CDSS, healthcare can become more accessible to large populations. However, it also implies that at times, CDSS may be used by people having literal medical knowledge [2].
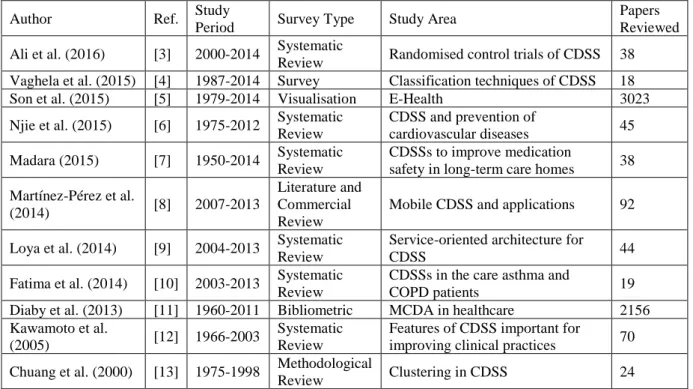
Several researchers have contributed in the form of systematic literature reviews (SLR) and surveys to provide
readers with an insightful information about CDSS, as demonstrated below in Table 1.
Despite the considerable variety of literature available, a key problem, researchers facing is the inability to understand the dynamics of CDSS-related literature. This is compounded due to the fact that this literature is spread across several related disciplines. Consequently, it is challenging to locate available information from a corpus of peer-reviewed articles. It is also difficult for researchers as well as clinical practitioners to comprehend the evolution of the research area.
scientific literature, which provides a broader spectrum by embracing publications across multiple disciplines of the domain. The visual survey allows us to explore various trends and patterns in the bibliographic literature more efficiently and keeps our knowledge up to date.
In this paper, we present a visual survey of key literature from Web of Science (WoS) to provide a meaningful and valuable reference for further study in the field. We have used CiteSpace a key visually analytical tool for information visualisation [14]. Although, CiteSpace has been used in a variety of disciplines, such as visual analysis of aggregation operator [15], agent-based computing [16], digital divide [17], anticancer research [18], tech mining [19], and digital medicine [20], etc. To the best of our knowledge, until now, there is no current review of recent literature on CDSS, which uses a scientometric analysis of networks formed from highly cited and important journal papers from the Web of Science (WoS).
The key contribution of this paper is the visual analysis of citations to give a scientometric overview of the diversity of the domain across its multiple sub-domains and the identification of core concepts. The ideas of visual analysis and survey stem from Cognitive Agent-based Computing framework [29] – a framework which allows for modelling and analysis of natural and artificial Complex Adaptive Systems.
In summary, the current paper identifies various important factors including the identification of emerging trends and patterns through exploring central nodes, pivot points, turning points, bursting nodes, and landmark nodes, the most important cluster in the cited references, visual analysis of the key authors, highly cited authors, key journals, core subject categories, countries of the origin of manuscripts, and the institutions from the
bibliographic literature of the domain. We hope that this work will assist researchers, academicians, and practitioners to learn about the key literature and developments in the CDSS domain.
The rest of the CDSS survey is structured as: In Section II, we give a brief background of the visualisation techniques. Next, in Section III, we present the methodology section including data collection and an overview of CiteSpace. This is followed by Section IV, containing results and discussion. In Section VII, correlation from actual literature is provided. Finally, Section VII concludes the paper.
2
Background
This section presents some of the commonly used techniques for the analysis of bibliographic networks.
A bibliographic network is a network composed of authors, journals, categories, terms, articles, or cited references and interaction among them. Nodes in the bibliographic networks may be authors, institutions, countries, articles, terms, cited references, or categories and edges may be interactions among them, such as co-citation, collaboration, coupling, or co-occurrence.
From bibliographic dataset, a variety of networks can be generated. Types of bibliographic networks include co-authorship networks of authors/organizations, co-citation networks of articles/authors/journals, coupling networks of authors/journals/articles/organizations, and co-occurrence networks of categories/terms/keywords.
2.1
Bibliometrics and scientometrics
Bibliometrics and Scientometrics are closely related fields which focus mainly on the analysis of bibliographic
Author Ref. Study
Period Survey Type Study Area
Papers Reviewed Ali et al. (2016) [3] 2000-2014 Systematic
Review Randomised control trials of CDSS 38 Vaghela et al. (2015) [4] 1987-2014 Survey Classification techniques of CDSS 18
Son et al. (2015) [5] 1979-2014 Visualisation E-Health 3023
Njie et al. (2015) [6] 1975-2012 Systematic Review
CDSS and prevention of
cardiovascular diseases 45 Madara (2015) [7] 1950-2014 Systematic
Review
CDSSs to improve medication
safety in long-term care homes 38 Martínez-Pérez et al.
(2014) [8] 2007-2013
Literature and Commercial Review
Mobile CDSS and applications 92
Loya et al. (2014) [9] 2004-2013 Systematic Review
Service-oriented architecture for
CDSS 44
Fatima et al. (2014) [10] 2003-2013 Systematic Review
CDSSs in the care asthma and
COPD patients 19
Diaby et al. (2013) [11] 1960-2011 Bibliometric MCDA in healthcare 2156 Kawamoto et al.
(2005) [12] 1966-2003
Systematic Review
Features of CDSS important for
improving clinical practices 70 Chuang et al. (2000) [13] 1975-1998 Methodological
Review Clustering in CDSS 24
literature. They explore the bibliographic literature to measure the evolution of the scientific domain.
The bibliometric is defined as “the application of mathematics and statistical methods to books and other media of communication” [21, 22]. Bibliometrics concentrates specifically on books and publications.
The scientometric is defined as “the quantitative methods of the research on the development of science as an informational process” [21, 23]. Scientometric concentrates specifically on the study of all aspects of the dynamics of scientific literature and technology [24].
Bibliometric research measures and evaluates the impact of scientific literature in qualitative and quantitative manners [25]. In addition to this, certain features of scientific publications are analysed to obtain various scientific communication-related findings from the bibliometric study.
Currently, various scientific techniques and methods are introduced for bibliometric studies. SNA is also one of the frequently used technique in bibliometric studies
2.2
Social Network Analysis (SNA)
SNA is an approach used to study personal relationships or social interactions among individuals or organizations. The main goal of SNA is to investigate patterns of interaction, structure, and organization of the social networks [26]. A social network is a network of personal relationships or social interactions among individuals or organizations. The nodes and edges in the social networks are referred to as actors and ties.
The most important concepts used in SNA are centrality, network density, and community structure. Here, we demonstrate different performance measures to understand network fundamentals.
▪ Centrality of a node depicts its topological importance in the network [27]. Some of the commonly used centralities are described below:
˗ Degree Centrality of a node is the number of links incident to it [27].
˗ Closeness Centrality is based on the average distance. It focuses on how close a node is to the rest of the nodes in the network [27].
˗ Betweenness Centrality of a vertex measures the extent to which that vertex lies in the
geodesics of pairs of all other vertices in the network [27]. A Geodesic is the shortest path between a node pair [27].
˗ Eigenvector Centrality measures the influence of a vertex based on degree centralities of its neighbours. The eigenvector centrality of a vertex is high if it is linked to the important nodes with higher degree centralities [28].
˗ Eccentricity centrality of a vertex is the maximum geodesic distance between that vertex and all other vertices [29].
▪ Density of a network is the actual connections in the network divided by the possible connections in the network [30].
▪ Component is a maximally connected subnetwork. There is at least one path between every node pair of the component [27].
▪ Giant component is the largest connected component in the network [27].
▪ K-core is a maximally connected subnetwork in which every node has degree at least k [27].
▪ Clique is a maximally complete subnetwork of three or more nodes, in which each node is connected directly to every other node [27].
▪ Bridge is a crucial link whose deletion increases the number of disconnected components in the network [27].
▪ A cut-vertex (or cutpoint) is such a vertex whose deletion increases the number of disconnected components in the network [27].
▪ Communities in a network are the dense groups of the nodes which are highly connected to each other inside the group and sparsely connected to the nodes outside the group [30].
▪ Affiliation networks are two-mode networks, which represent the involvement of a set of actors in a set of events [27].
After presenting the background, the next section presents the methodology used in this research.
3
Methodology
In Figure 1, we illustrate the proposed methodology for the visual analysis of bibliographic literature in the domain of CDSS to uncover emerging patterns and trends.
3.1
Data collection
The input dataset was collected from the Clarivate Analytics’ Web of Science [31] between the timespan of 2005 to 2016. Data were retrieved on 11 Nov 2016, by an extended topic search for CDSSs including the Web of Science. The databases searched include SCI-Expanded, SSCI, and A&HCI. The search was confined to document types including articles, reviews, letters, and editorial material published in the English language. Each data
record includes information as titles, authors, abstracts, and references. The input dataset contains a total of 1,945 records.
Figure 2 shows an example of our input data. The two-character field tags in the input data, identify fields in the records. The detailed description of the field tags [32] can be found in Table 2.
It is pertinent to note here that there is a problem in data collected from Web of Science. The WoS data identified two cited-authors named as “Anonymous” and “Institute of Medicine.” In terms of frequency,
Field Tags Fields in Record Field Tags Fields in Record
FN File Name Z9 Total Times Cited Count
VR Version Number U1 Usage Count (Last 180 Days)
PT Publication Type U2 Usage Count (Since 2013)
AU Authors PU Publisher
AF Author Full Name PI Publisher City
TI Document Title PA Publisher Address
SO Publication Name SN ISSN
LA Language J9 29-Character Source Abbreviation
DT Document Type JI ISO Source Abbreviation
DE Author Keywords PD Publication Date
ID Keywords Plus® PY Year Published
AB Abstract VL Volume
C1 Author Address IS Issue
RP Reprint Address DI DOI
EM E-mail Address PG Page Count
RI Researcher ID Number WC Web of Science Categories
OI ORCID Identifier SC Research Areas
FU Funding Agency and Grant Number GA Document Delivery Number
FX Funding Text UT Accession Number
CR Cited References PM PubMed ID
NR Cited Reference Count ER End of Record
TC Web of Science Core Collection Times
Cited Count EF End of File
Table 2: The field tags representing record fields in the input data [32]
Anonymous is the landmark node. However, “Anonymous” itself is not an author, however, as a whole it is indicating all articles with missing author names. The larger diameter of the node “anonymous” indicates that several publications have missing author names. Whereas on an extensive search on the internet, we found multiple papers having “Institute of Medicine” as an author.
3.2
Why CiteSpace?
A variety of tools are available for network analysis and visualization. In this section, we will give a brief overview of some of the most commonly used and freely available tools. Gephi and Pajek are the most common tools used for the general analysis of the networks. However, they require other software tools for extracting scientometric data from WoS. For Pajek, WoS2Pajek can be used and for Gephi, Sci2 is used for this purpose. Pajek is focused less on network visualization and more on network analysis, whereas Gephi is focused more on network visualization and less on network analysis.
VOSview, CiteNetExplorer, and CiteSpace are specifically developed for visualization of bibliometric networks. However, VOSview has computational limitations and memory constraints. It also ignores the time dimension. Whereas, CiteNetExplorer is designed only for the visualization of citation networks of publications [33]. Unlike other tools, CiteSpace provides visualization of dynamic networks. CiteSpace is extensively used for network visualization.
In this research, we have used CiteSpace a key visually analytical tool for information visualisation [14].
3.3
CiteSpace: an overview
CiteSpace is custom designed for visual analysis of citations. It uses colour coding to capture some details, which otherwise cannot be captured easily by using any other tool. In CiteSpace users can specify the years’ range and the length of the time slice interval to build various networks. CiteSpace is based on network analysis and visualisation. It enables interactive visual analysis of a knowledge domain in different ways. By selecting display of visual attributes and different parameters, a network can be viewed in a variety of ways. CiteSpace has been used to analyse diverse domain areas such as agent-based computing [16], cloud computing [34], cross-language information retrieval [35], and clinical evidence [36].
One of the key features of CiteSpace is the calculation of betweenness centrality [14]. The betweenness centrality score can be a useful indicator of showing how different clusters are connected [37]. In CiteSpace, the range of betweenness centrality scores is [0, 1]. Nodes which have high betweenness centrality are emphasised with purple trims. The thickness of the purple trims represents the strength of the betweenness centrality. The thicker the purple trim, the higher the betweenness centrality. A pink ring around the node indicates centrality >= 0.1.
Burst identifies emergent interest in a domain exhibited by the surge of citations [16]. Citation bursts indicate the most active area of the research [37]. Burst nodes appear as a red circle around the node.
3.3.1
Colours used
CiteSpace is designed for visualisation; it extensively relies on colours, therefore the description in this paper is based on colours.
The colours of the co-citation links personify the time slice of the study period of the first appearance of the co-citation link. Table 3 demonstrates CiteSpace’s use of colour to visualise time slices. The blue colour is for the earliest years, the green colour is for the middle years, and orange and red colours are for the most recent years. A darker shade of the same colour corresponds to earlier time-slice, whereas lighter shades correspond to the later time slice.
Link Colours Corresponding Time Slice
Blue Earliest years
Green Middle years
Orange and Redish Most recent years Darker shade of the same
colour Earliest time-slice
Lighter shade of the same
colour Later time-slice
Table 3: CiteSpace’s use of colours to visualise links, and time slices.
3.3.2
Node types
The importance of a node can be identified easily by analysing the topological layout of the network. Three most common nodes, which are helpful in the identification of potentially important manuscripts are i) hub node, ii) landmark node and iii) pivot node [14]. ▪ Landmark nodes are the largest and most highly cited
nodes. In CiteSpace, they are represented by concentric circles with largest radii. The concentric citation tree rings identify the citation history of an author. The colour of the citation ring represents citations in a single time slice. The thickness of a ring represents the number of citations in a particular time slice.
▪ Hub nodes are the nodes with a large degree of co-citations.
▪ Pivot nodes are links between different clusters in the networks from different time intervals. They are either gateway nodes or shared by two networks. Whereas turning points refer to the articles which domain experts have already identified as revolutionary articles in the domain. It is a node which connects different clusters by same coloured links.
4
Results and discussion
This section briefly demonstrates the results of our analysis.
4.1
Identification of the largest clusters in
document co-citation network
clusters. It uses time slice to analyse the clusters. The merged network of cited references is partitioned into some major clusters of articles. In Figure 3, years from 2005 to 2016 show up as yearly slices represented by unique colours. We have selected top 50 cited references per one-year time slice. The links between the nodes also represent the particular time slices. In [14] authors noted clusters with the same colours are indicative of co-citations in any given time slice. The cluster labels start from 0; the largest cluster is labelled as (#0), the second largest is labelled as (#1), and so on. The largest cluster is the indicator of the major area of research.
It can also be noticed in Figure 3 that the articles of David W. Bates (1999) and Thomas D. Stamos (2001) are the intellectual turning points, which join two linked clusters: (cluster #4) “combination” and (cluster #12) “family practice” respectively. Similarly, articles of Heleen Van Der Sijs (2008) and Blackford Middleton (2013) are the intellectual turning points, which join two linked clusters: (cluster #2) “decision support” and (cluster #16) “computerised prescriber order entry” respectively. After a gap of five years, Middleton B has
cited a paper of Van Der Sijs H, which drew the interest of many researchers in the field of “decision support”.
It is interesting to note that a half-life of the article of Bates DW is 7 years and a half-life of the article by Thomas D. Stamos is 4 years. Whereas a half-life of Van Der Sijis H’s article is 5 years and a half-life of Middleton B’s paper is 3 years.
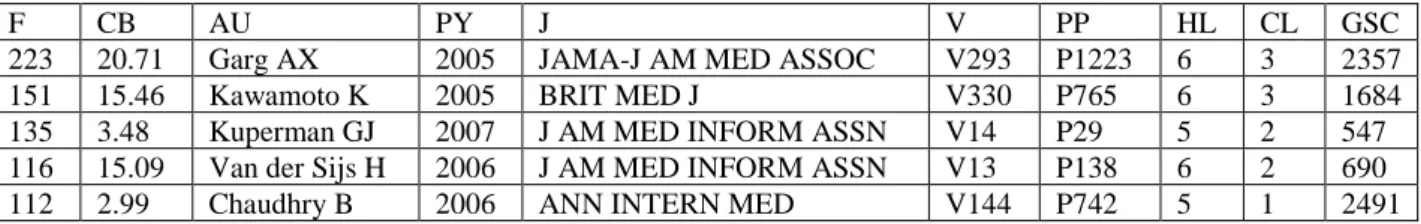
In Table 4, details of top five cited references are given in terms of high citation frequency. By observing this table, we observed that the top five articles have low centrality but are still significant by having more frequency. The article by Amit X. Garg (2005) has the highest frequency of citations among all the cited references. Following it are the articles of Kensaku Kawamoto and Gilad J. Kuperman published in 2005 and 2007 respectively. The articles of Van Der Sijs H and Basit Chaudhry are also included in the top five articles in this domain.
huge attention from the research community. It has 223 citations and 6-year half-life. It has 2357 citations on Google Scholar. Following it is the article of Kensaku Kawamoto (2005) with 15.46 citation burst, 151 citations, and a half-life of 6 years. It has 1684 citations on Google Scholar. Next is the article by Kuperman GJ (2007) with 3.48 citation burst, 135 citation frequency, and a half-life of 5 years. It has 547 citations on Google Scholar. It is
closely followed by the Van Der Sijs H (2007) with a citation burst of 15.09, citation frequency 116, and a half-life of 5 years. It has 690 citations on Google Scholar. The article by Basit Chaudhry (2006) has the lowest citation burst of 2.99 among top five articles in the domain. It has a citation frequency of 112 and a half-life of 6 years. It has 2491 citations on Google Scholar.
F CB AU PY J V PP HL CL GSC
223 20.71 Garg AX 2005 JAMA-J AM MED ASSOC V293 P1223 6 3 2357
151 15.46 Kawamoto K 2005 BRIT MED J V330 P765 6 3 1684
135 3.48 Kuperman GJ 2007 J AM MED INFORM ASSN V14 P29 5 2 547
116 15.09 Van der Sijs H 2006 J AM MED INFORM ASSN V13 P138 6 2 690
112 2.99 Chaudhry B 2006 ANN INTERN MED V144 P742 5 1 2491
Table 4: The summary table of cited references sorted in terms of frequency includes frequency (F), citation burst (CB), author (AU), publication year (PY), journal (J), volume (V), page no. (PP), a half-life (HL), cluster ID (CL), and Google Scholar Citations (GSC) of the top 5 cited references.
Table 5 contains cited documents in terms of betweenness centrality. The article by Basit Chaudhry (2006) is the most influential document with the highest centrality score of 0.43. The half-life of this article is 5 years and it has 2491 citations on Google Scholar. Following it is the article by Ross Koppel (2005) with 0.24 centrality, and a half-life of 5 years. It has 1995 citations on Google Scholar. Next is the article by Amit X. Garg (2005) with 0.18 betweenness centrality and a half-life of 6 years. It has 2357 citations on Google Scholar. It is closely followed by Jerome A. Osheroff (2007) with
betweenness centrality of 0.16 and a half-life of 5 years. It has 357 citations on Google Scholar. Finally, we have an article by Gilad J. Kuperman (2007) with lowest betweenness centrality of 0.14 among top five articles in the domain. It has a half-life of 5 years. It has 547 citations on Google Scholar.
The merged network in Figure 3 contains a total of 611 cited references and 1,958 co-citation links. The largest cluster, i.e. (#0) of the network is disconnected from the largest component of the network. In this analysis, we will consider only the largest component.
The largest component of connected clusters contains 442 nodes, which is 72% of the network. The largest component is further divided into 13 smaller clusters of different sizes. Table 6 illustrates the details of these clusters.
Cluster #1 (largest cluster) contains 65 nodes, which are 10.628% of all nodes in the network. The average publication year of the literature in this cluster is 2007. The mean silhouette score of 0.737 indicates relatively high homogeneity in the cluster.
Cluster #2 contains 57 nodes, which are 9.328% of all nodes in the network. The average publication year of the literature in this cluster is 2009. The mean silhouette score of 0.7 indicates relatively high homogeneity in the cluster. Cluster #3 contains 56 nodes, which are 9.165% of all nodes in the network. The average publication year of the literature in this cluster is 2008. The mean silhouette score of 0.722 indicates relatively high homogeneity in the
cluster. It is interesting to note that cluster #3 (“AIDS”) contains several articles with strongest citation burst, which indicates it is an active or an emerging area of research.
Cluster #4 contains 52 nodes, which are 8.51% of all nodes in the network. The average publication year of the literature in this cluster is 2001. The mean silhouette score of 0.791 indicates average homogeneity in the cluster. It is interesting to note that most of the highly influential articles are the members of cluster #4.
Cluster #5 contains 49 nodes, which are 8.01% of whole nodes in the network. The average publication year of the literature in this cluster is 2003. The mean silhouette score of 0.772 indicates relatively high homogeneity in the cluster.
Cluster #6 contains 45 nodes, which are 7.364% of whole nodes in the network. The average publication year of the literature in this cluster is 2012. The mean silhouette
BC AU PY J V PP HL CL GSC
0.43 Chaudhry B 2006 ANN INTERN MED V144 P742 5 4 2491
0.24 Koppel R 2005 JAMA-J AM MED ASSOC V293 P1197 5 0 1995
0.18 Garg AX 2005 JAMA-J AM MED ASSOC V293 P1223 6 4 2357
0.16 Osheroff JA 2007 J AM MED INFORM ASSN V14 P141 5 4 357
0.14 Kuperman GJ 2007 J AM MED INFORM ASSN V14 P29 5 1 547
score of 0.955 indicates very high homogeneity in the cluster.
Cluster #7 contains 40 nodes, which are 6.546% of all nodes in the network. The average publication year of the literature in this cluster is 2002. The mean silhouette score
of 0.73 indicates relatively high homogeneity in the cluster.
Cluster #8 contains 19 nodes, which are 3.10% of all nodes in the network. The average publication year of the literature in this cluster is 2003. The mean silhouette score of 0.854 indicates high homogeneity in the cluster. Cluster
ID Size Silhouette
Mean
(Year) Label (Log-Likelihood Ratio)
Terms (Mutual Information) 1 65 (10.638%) 0.737 2007 Impact; Adverse Drug Event;
Physician Order Entry
Computerized Decision Support 2 57 (9.328%) 0.7 2009 Alert; Ambulatory Care; Safety
Alert Drug Administration
3 56 (9.165%) 0.722 2008 Patient Outcome; Management;
Guideline Aid
4 52 (8.51%) 0.791 2001 Decision Support System; Primary
Care; Expert System Combination
5 49 (8.01%) 0.772 2003 Adverse Drug Event; Medication
Error; Prevention Chronic Illness
6 45 (7.364%) 0.955 2012
Personalized Medicine; Pharmacogenomics; Computed Tomography
ACR Appropriateness Criteria
7 40 (6.546%) 0.73 2002 Prevention; Intervention; Adverse
Drug Event Acute Kidney Failure
8 19 (3.10%) 0.854 2003 Emergency Medicine; ASHP;
Systems Analysis
Intra Cluster Correlation Coefficient 9 18 (2.945%) 0.976 2004 Personal Digital Assistant;
Resource; PDA Consultation
10 13 (2.127%) 0.976 2011 Medication Alert System;
Interview; Observational Study Surgery
11 12 (1.963%) 0.944 2002
Guideline Implementation; Adverse Event; Clinical Practice Guideline
Factor-V-Leiden
12 11 (1.800%) 0.979 1999 Statin; Cholesterol Reduction;
Treatment Panel III Family Practice 16 5 (0.818%) 0.995 2010 Smoking Cessation; Control
Intervention; Usability
Computerized Prescriber Order Entry
Table 6: The summary table of largest clusters of the cited authors. It contains the ID of the cluster, the size of the cluster, the average publication year of the literature in the cluster, and title terms of the clusters. The merged network contains 611 nodes and 1958 connections.
Cluster #8 contains 19 nodes, which are 3.10% of all nodes in the network. The average publication year of the literature in this cluster is 2003. The mean silhouette score of 0.854 indicates high homogeneity in the cluster.
Cluster #9 contains 18 nodes, which are 2.945% of all nodes in the network. The average publication year of the literature in this cluster is 2004. The mean silhouette score of 0.976 indicates very high homogeneity in the cluster.
Cluster #10 contains 13 nodes, which are 2.127% of all nodes in the network. The average publication year of the literature in this cluster is 2011. The mean silhouette score of 0.976 indicates very high homogeneity in the cluster.
Cluster #11 contains 12 nodes, which are 1.963% of all nodes in the network. The average publication year of the literature in this cluster is 2002. The mean silhouette
score of 0.944 indicates very high homogeneity in the cluster.
Cluster #12 contains 11 nodes, which are 1.800% of all nodes in the network. The average publication year of the literature in this cluster is 1999. The mean silhouette score of 0.979 indicates very high homogeneity in the cluster.
Cluster #16 (smallest cluster) contains 5 nodes, which are 0.818% of all nodes in the network. The average publication year of the literature in this cluster is 2010. The mean silhouette score of 0.955 indicates very high homogeneity in the cluster.
4.2
Analysis of journals
In this section, we visualise cited journals. Out of 1,945 records in the dataset, the 60 most cited journals were selected per one-year slice to build the network.
The pink rings around the nodes depicted in Figure 4 indicate that there are five nodes in the network with
centrality > 0.1. “Journal of the American Medical Informatics Association” has the largest number of highly cited publications. The second largest number of publications is associated with “The Journal of the American Medical Association.” “Proceedings of the AMIA Symposium” (2005) has the strongest citation burst among authors from the period of 2005.
Figure 4: Journals’ network in terms of centrality. Concentric citation tree rings indicate the citation history of the publications of a journal. The colours of the circles in the tree rings represent citations in a corresponding year. The red rings indicate the citation burst of the publication. The colours of the links correspond to the time slice. The pink rings around the nodes indicate the centrality >= 0.1. The “J AM MED INFORM ASSN” is the highly cited journal, whereas the “Jama-j AM MED ASSOC” is the most central journal of the domain.
Centrality Title Abbreviated Title Impact Factor
0.14 The Journal of the American Medical Association Jama-j AM MED ASSOC 37.684 0.13 Journal of the American Medical Informatics
Association J AM MED INFORM ASSN 3.428
0.13 International Journal of Medical Informatics Int J MED INFORM 2.363
0.13 The American Journal of Medicine Am J MED 5.610
0.13 Artificial Intelligence in Medicine (AIIM) Artif INTELL MED 2.142
Table 7 gives details of the top 5 key journals based on centrality. “The Journal of the American Medical Association” has the highest centrality score of 0.14 among all the other journals. It has 37.684 impact factor. In addition, it could be seen that in terms of centrality, the “Journal of the American Medical Informatics Association,” the “International Journal of Medical Informatics,” “The American Journal of Medicine” and the “Artificial Intelligence in Medicine” are also some of the productive journals of this domain with a centrality score of 0.13 and impact factor of 3.428, 2.363, 5.610, and 2.142 respectively.
Table 8 gives details of the top 5 key journals based on their frequency of publications. It is interesting to note that the table organised in terms of frequency of publications gives a somewhat different set of key journals. The “Journal of the American Medical Informatics Association” is at the top with the frequency of 1169 publications and 3.428 impact factor. This is followed by “The Journal of the American Medical
Association”, “The New England Journal of Medicine,” “The Archives of Internal Medicine”, and the “Annals of Internal Medicine Journal” with frequencies 1961, 819, 687, and 655 and impact factor 37.684, 59.558, 17.333, and 16.593 respectively.
After a visual analysis of the journals, in the next section, we will analyse the authors’ network.
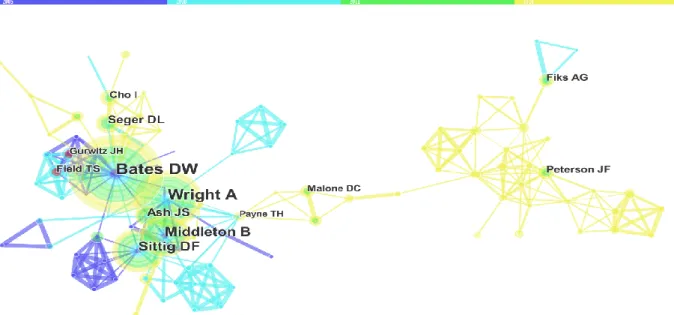
4.3
Analysis of co-authors
This section analyses the author collaborative network. Figure 5 displays the visualisation of the core authors of the domain. The merged network contains 346 authors and 719 co-authorship links. As shown in Figure 5, burst nodes appear as a red circle around the node. The citation burst in authors network specifies the authors who have rapidly grown the number of publications. As shown in Figure 5, in terms of frequency, David BW is the landmark node with largest radii of the node. Payne THis the most central author of this domain.
Publication
frequency Journal full title Abbreviated title
Impact Factor (2016) 1169 Journal of the American Medical Informatics
Association (JAMIA) J AM MED INFORM ASSN 3.428
1096 The Journal of the American Medical
Association Jama-j AM MED ASSOC 37.684
819 The New England Journal of
Medicine (NEJM) New ENGL J MED 59.558
687 Archives of Internal Medicine Arch INTERN MED 17.333
655 Annals of Internal Medicine Journal Ann INTERN MED 16.593
Table 8: The five most productive journals in the bibliographic literature of the CDSS domain based on frequency. J AM MED INFORM ASSN is the most cited journal with frequency 1169, whereas Ann INTERN MED is the least cited journal with frequency 655.
Visualisation in Figure 6 illustrates the authors who have the strongest publication bursts and years in which it took place. It can be seen that Ali S. Raja (2014) from “Harvard Medical School, USA” has the strongest burst among the top 5 authors since 2005. Ivan K. Ip (2005) from “Harvard Medical School, USA” has the second strongest burst, which took place in the period of 2013 to 2016. Following him are Terry S. Field (2005) from Meyers Primary Care Institute, Ramin Khorasani (2014) from “Brigham and Women’s Hospital”, and Jerry H. Gurwitz (2005) from “Meyers Primary Care Institute, USA.”
Figure 6: The top 5 Co-authors associated with strongest publication bursts. The history of the burstness of authors includes names of the authors, publication year, burst strength, starting, and ending year of the citation burst. “Raja AS” has strongest publication burst among all other authors. “Field TS” and “Gurwitz JH” have the longest burst period.
Even though this visualisation gives a general picture of the several authors, Table 9 also illustrates a comprehensive analysis of the authors’ network.
Frequency Author Abbreviations
395 David Bates BATES DW
296 Amit X. Garg GARG AX
255 Kensaku
Kawamoto KAWAMOTO K
180 Rainu Kaushal KAUSHAL R
173 Gilad J. Kuperman KUPERMAN GJ Table 9: The top 5 Authors in terms of the frequency of joint publications. David Bates is the most productive author with 395 publications.
Here we can notice that the most productive author in the network is David Bates with 59 joint publications. David Bates is a Prof. of Medicine at “Harvard Medical School, USA.” His areas of interest are medication safety, patient safety, quality, medical informatics, and clinical decision support. Next is Adam Wright, an Assoc. Prof. of Medicine, “Harvard Medical School, USA” and “Brigham and Women’s Hospital, USA.” His areas of interest are health information technology, medical informatics, biomedical informatics, clinical information systems, and CDS. Dean F. Sittig is the Cristopher Sarofim Family Prof. of Bioengineering, “Biomedical Informatics, and UTHealth, USA.” CDS, electronic health records, medical informatics, and biomedical informatics are his areas of interest. Next is Blackford Middleton, an Instructor, “Harvard TH Chan School of Public Health, USA”. His areas of interest include personal health record, clinical
informatics, CDS, knowledge management, and electronic medical record. Finally, we have Ramin Khorasani, MD, PhD, “Brigham and Women’s Hospital, USA.”
Centrality Author Abbreviations
0.08 Thomas Payne Payne TH
0.07 David Bates Bates DW
0.07 Richard D Boyce Boyce RD 0.07 Robert R Freimuth Freimuth RR 0.07 Matthias Samwald Samwald M Table 10: The top 5 Co-Authors in terms of centrality. Payne TH is the most central author with a centrality score of 0.08, whereas the rest of the authors have the same centrality score of 0.07.
For additional relative analysis, we have observed the collaborative authors based on centrality, as depicted in Table 10. Thomas Payne a Prof. of Medicine, “University of Washington, USA.” His areas of interest are clinical informatics and clinical computing. Richard D Boyce, Asst. Prof. of “Biomedical Informatics, University of Pittsburgh, USA.” His areas of interest are Pharmacoepidemiology, medication safety, knowledge representation, comparative effectiveness research, and semantic web. Next is Robert R Freimuth, “Mayo Clinic, USA.” His areas of interest include genomics CDS, personalised medicine, genetic variation, data integration, Pharmacogenomics, data integration and interoperable infrastructure
.
Matthias Samwald, “Medical University of Vienna, Austria.” His interest is in biomedical informatics.After analysing authors’ network, in the next section, we have visualised the cited authors’ network.
4.4
Analysis of cited-authors
This section analyses the authors’ co-citation network. Figure 7 displays the visualisation of the cited authors of this domain. The merged network contains 211 cited authors and 656 co-citation links. Burst nodes appear as a red circle around the node; the citation burst in cited-authors network specifies the cited-authors who have rapidly grown the number of citations. In terms of frequency, David BW is the landmark node with largest radii of the citation ring. The pink ring around David BW indicates that it is also the most central author of this domain.
Even though this visualisation gives a general picture of the several authors, Tabel 11 also illustrates a comprehensive analysis of authors’ network.
Hospital, Boston, Massachusetts, USA.” Finally, we have Gilad J. Kuperman, an Adjunct Assoc. Prof. of Biomedical Informatics, “Columbia University Clinical Informatics, USA”.
For additional comparative analysis, we have observed the top-cited authors in terms of centrality. Fresh names which enter in Table 11 are David Blumenthal
from the “Harvard Medical School, USA” and Basit Chaudhry from the “University of California, USA.”
After analysing authors’ network, in the next section, we will visualise the countries of the origin of the key publications of the domain.
Frequency Author Abbreviations
460 David Bates Bates DW
338 Amit X. Garg Garg AX
280 Kensaku Kawamoto Kawamoto K
207 Rainu Kaushal Kaushal R
198 Gilad J. Kuperman Kuperman GJ Table 12: The top 5 cited-authors in terms of the frequency of citations. David Bates is the most cited author with 460 citations, whereas Kuperman GJ is the least cited author with 198 citations.
Figure 7: Cited-authors network visualisation. The merged network contains 211 nodes and 656 links. Burst nodes appear as a red circle around the node. Concentric citation tree rings indicate the citation history of the publications of an author. The pink rings around the node indicate the centrality score >= 0.1. Bates DW is the landmark with largest radii and is also the hub node with the highest degree.
Centrality Author Abbreviations Year
0.29 David Bates Bates DW 2005
0.13 Gilad J.
Kuperman Kuperman GJ 2005
0.13 Amit X. Garg Garg AX 2005
0.13 David
4.5
Analysis of countries
In this section, we demonstrate a visual analysis of the spread of research in the domain from different countries. For this visualisation, top 30 countries are chosen from the entire time span of 16 years (i.e. 2005-2016) for each one-year time slice. In Figure 8, the concentric rings of different colours represent papers published in different time slices. The diameter of the ring thus indicates the publication frequency of the country. From the display, it can be seen that the “United States” has the highest publication frequency, which indicates that the origin of key publications in the domain is the “United States”. This is followed by articles originating from England, Canada, Netherlands, and Australia. The pink circle around the node represents the centrality >= 0.1. As depicted in Figure 8, Canada has the highest centrality value. This is followed by the US, England, Germany, and Spain. Red circles represent the publication burst. Scotland has the strongest publication burst, which provides the evidence that the articles originating in the domain from Scotland have attracted a degree of attention from its research community.
After a visual analysis of countries, we will present a visual analysis of institutions.
4.6
Analysis of institutions
In this section, the visualisation of institutions is performed. Figure 10 contains a merged network of institutions of 319 institutions and 844 collaboration links. We have selected top 50 nodes per one-year length time slice from 1,945 records. The “Harvard” is the most central, as well as the most productive node among all other institutions. Following it is the “Brigham and Women’s Hospital, USA.” Whereas, the “University of Massachusetts, USA” has the strongest publication burst.
A visual analysis of the history of the burstness of institutions identifies universities that are specifically active in the research in this domain.
from 2013 till 2016. Whereas, the “Weill Cornell Graduate School of Medical Sciences, USA” has shortest publication burst.
Next, we performed an analysis in terms of the frequency of publications associated with the institutions. Table 13 represents the top five institutions based on the frequency of publications. The “Havard, USA” has the highest ranking with the frequency of 165 publications. The “Brigham & Women’s Hospital, USA” followed it closely with the frequency of 122 publications. Next is the “Vanderbilt University, USA” with the frequency of 62 publications. With 56 publications, next, we have the “University of Utah, USA”. Following it, we have the “University of Washington, USA” with the frequency of 55 publications.
Here, we performed another analysis in terms of the centrality of the publications. Table 14 contains the list of the top five universities based on the centrality. It is interesting to note that the top two universities the “Harvard” and “Brigham & Women’s Hospital, USA” with centrality scores 0.3 and 0.17 respectively are also the highly cited institutions. Following them is the “University of Utah, USA” with a centrality score of 0.14.
Figure 10: The network of Institutions, containing 319 nodes and 844 edges. Concentric citation tree rings demonstrate the citation history of the publications of an institution. The purple circle represents betweenness centrality. The thicker the purple ring, the higher the centrality score. The “University of Massachusetts” has the strongest burst. The Harvard is the highly cited and most central institution of the domain.
Frequency Institution Countries
165 Harvard University USA
122 Brigham and Women’s
Hospital USA
62 Vanderbilt University USA
56 University of Utah USA
55 University of Washington USA Table 13: The top institutions in terms of frequency of publications. “Harvard” has the highest publication frequency of 165, whereas the “University of Washington” has the lowest frequency of 55.
Centrality Institutions Countries
0.3 Harvard University USA
0.17 Brigham and Women’s
Hospital USA
0.14 University of Utah USA
Next is the “University of Washington, USA” with a centrality score of 0.09. With centrality value 0.07, it seems however that the “Heidelberg University, USA” has the lowest centrality score among all other institutions.
After visualisation of institutions, in the next section, we will present an analysis of subject categories of the domain.
4.7
Analysis of categories
In this section, our next analysis is to discover publications associated with various categories. Figure 11 depicts the temporal visualisation of categories in the domain. This merged network contains 95 categories and 355 links (co-occurrences). We have selected top 50 nodes per one-year time slice. The detailed analysis based on the centrality and frequency is given below.
Table 15 lists the top 5 categories based on centrality. The category “Health Care Sciences & Services” leads over other categories with centrality value 0.29. It is closely followed by “Engineering” with centrality 0.28.
Next is “Computer Science” with a centrality score of 0.25. Following it is the “Surgery” with centrality 0.18. Subsequently, we have “Nursing” with a centrality score of 0.24.
For relative analysis, we have also analysed these categories in terms of frequency of occurrence in manuscripts. The outcomes of this analysis are illustrated underneath in Table 16.
Table 16 lists the top 5 categories based on the frequency of occurrence. With the frequency of 658, “Medical Informatics” leads the rest of the categories. Following it is the “Computer Science” with a frequency of 545. Next is “Health Care Sciences & Services” with a frequency of 495, which is followed by “Computer Science, Information Systems” and “Computer Science, Interdisciplinary Applications” with frequencies 320 and 318 respectively.
After visually analysing co-authors, journals, co-cited authors, countries, institutions, and subject categories, in the end, we are presenting the summary of the results.
5
Summary of results
In this paper, we have utilised CiteSpace for the analysis of various types of visualisation to identify emerging trends and abrupt changes in scientific literature in the domain over time. In this section, we give an overview of the key results of the visual analysis performed in this study.
Firstly, using clustering of cited references we observed Cluster #1, the “computerised decision support” is the largest cluster, which contains 65 nodes that are 10.638% of whole nodes in the network. The articles by Bates DW (1999), Stamos TD (2001), Van Der Sijs H (2008), and Middleton B (2013) are the key turning point. The half-life of these articles is 7, 4, 5, and 3 years respectively.
Subsequent analyses verified that there is conducted diversity in authors, journals, countries, institutions, and subject categories.
In the analysis of journals, we observed that the “Journal of the American Medical Informatics Association” has the largest number of highly cited publications in the domain and “Journal of the American Medical Association” is the most central journal among all other journals.
In terms of the analysis of the author’s network, we observed that since 2005 Ali S. Raja (2014) has the strongest burst among the top authors of the domain. We also observed that most collaborative author in the network is David Bates, a Prof. of Medicine at the “Harvard School”, has 59 publications is also the most central author with a centrality score of 0.33. His areas of interest are medication safety, patient safety, quality, medical informatics, and clinical decision support. It is interesting to note that David Bates is also the highly cited and most central cited author of this domain.
In the analysis of countries, top 30 countries were chosen from the entire time span of 2005-2016 for each one-year time slice. We observed that the United States has the highest frequency of publications, which indicates the origin of key publications in the domain. Whereas, Canada has the highest centrality score. Scotland has the strongest publication burst, which provides the evidence that the articles originating in the domain from Scotland have attracted a degree of attention from its research community.
On the visual analysis of institutions, we found that “The University of Massachusetts” has the strongest and longest publication burst in the timespan of 2006 to 2009. The “Indiana University School of Medicine” also has the longest period of the burst among all other institutes from 2013 till 2016. Harvard has a top ranking with a frequency of 165 publications. It is interesting to note that the Harvard is also the most central institution with the centrality score of 0.3.
In the analysis of categories, we observed that the category “Health Care Sciences & Services” leads over other categories with centrality value 0.29. Whereas with a co-occurrence frequency of 658, the category “Medical Informatics” leads the rest of the categories.
6
Correlation from actual literature
This section presents the necessary background of the Decision Support System (DSS) and CDSS.
6.1
Decision support system
The idea of DSS is very broad and different authors have defined it differently based on their research and roles DSS plays in the decision-making process [38-47]. DSS applications are adopted in several areas, such as business management [48], finance management [49], forest management [50], medical diagnosis [51], waste management [52, 53], oral anticoagulation management [54], ship routing [55], ecosystem management [56], value-based management [57], World Wide Web [58], diagnosis and grading of brain tumour [59], agent-based medical diagnosis [60, 61], and so on.
We intend to provide insight to CDSS researchers and practitioners about historical trends, current developments, and future directions of the CDSS domain.
6.2
Clinical decision support system
Since the beginning of computers, physicians and other healthcare professionals have expected the time when machines would aid them in clinical decision-making and other restorative procedures. “CDSS provides clinicians, patients, or individuals with knowledge and person-specific or population information, intelligently filtered or presented at appropriate times, to foster better health processes, better individual patient care, and better population health” [62].
There exist two main types of CDSS. The first one is derived from expert systems and uses knowledge base. The knowledge base depends on the inference engine to implement the rules, such as if-then-else on the patient Centrality Category
0.29 Health Care Sciences and Services
0.28 Engineering
0.25 Computer Science
0.18 Surgery
0.16 Nursing
Table 15: The top 5 categories based on centrality. The subject category “Health Care Sciences & Services” leads over other categories with a centrality score of 0.29.
Frequency Category
658 Medical Informatics 545 Computer Science
495 Health Care Sciences & Services 320 Computer Science, Information
Systems
318 Computer Science, Interdisciplinary Applications
data and presents the findings to end-users [2]. The second type of CDSS is based on non-knowledge based systems, which depends on machine learning techniques for the analysis of clinical based data [63].
CDSSs are considered as an important part in the modern units of healthcare organisations. They facilitate the patients, clinicians, and healthcare stakeholders by providing patient-centric information and expert clinical knowledge [64]. To improve the efficiency and quality of healthcare, the clinical decision-making uses knowledge obtained from these smart clinical systems. The automated DSSs of Cardiovascular are available in primary health care units and hospital in order to fulfil the ever-increasing clinical requirements of prognosis in the domain of coronary and cardiovascular diseases. The computer-based decision support strategies have already been implemented in various fields of cardiovascular care [65]. In the US and the UK, these applications are considered as the fundamental components of the clinical informatics infrastructures.
Many reviews have identified the benefits of the CDSSs, in particular, Computerized Physician Order Entry systems [66-68]. The CDSS as part of the Computerized Physician Order Entry has been found to alleviate adverse drug events and medication errors [69-71]. The key benefits of CDSS reported in the studies conducted in [72-76] are higher standards of patient safety, improving the quality of direct patient care, standardisation and conformance of care using clinical practice guidelines, and the collaborative decision-making.
CDSSs also have demonstrated to improve clinician performance, by way of promoting the electronic prescription of drugs, adherence to guidelines and to an extent the efficient use of time [69, 71]. CDSSs perform a key role in providing primary care and preventative measures at outpatient clinics, e.g. by alerting caregivers of the need for routine blood pressure checking, to recommend cervical screening, and to offer influenza vaccination [67, 77].
The adoption of CDSSs in diagnosis and management of chronic diseases, such as diabetes [78], cancer [79], dementia [80], heart disease [81], and hypertension [82] have played significant clinical roles in the main healthcare organisations in the improvement of clinical outcomes of the organisations worldwide at primary and secondary care. These CDSS also provide a foundation to system developer and knowledge expert to collate and build domain expert knowledge for screening by clinicians and clinical risk assessment [72, 83].
Ontology-driven DSSs are also used widely in the clinical risk assessment of chronic diseases. The ontology-driven clinical decision support (CDS) framework for handling comorbidities in [84] presented remarkable results in the disease management and risk assessment of breast cancer patients, which was deployed as a CDSS handling comorbidities in the healthcare setting for primary care clinicians in Canada.
The ontology-driven recommendation and clinical risk assessment system could be used as a triage system in the cardiovascular preventative care which could help
clinicians prioritize patient appointments after reviewing the snapshot of a patient’s medical history containing patient demographics information, cardiac risk scores, cardiac chest pain and heart disease risk scores, recommended lab tests and medication details.
7
Conclusions and future work
In this paper, we have demonstrated a comprehensive visual and scientometric survey of the CDSS domain. This research covers all Journal articles in Clarivate Analytics from the period 2005-2016. Our survey is based on real data from the Web of Science databases. This allowed us to comprehend all publications in the domain of CDSSs.
Our analysis has produced many interesting results. The CDSS has gained the interest of the research community from the era of 2005. David Bates is the highly cited author in the literature of CDSS, whereas Ali S. Raja is the author who has rapidly grown the number of publications during the period of study. The “Journal of the American Informatics Medical Association” is the top-ranking source journal. It contributes 1169 publications during the period of study. The United States has contributed the highest number of publications, whereas the United Kingdom is the second highest productive country. Most of the contributions came from Harvard, whereas the “University of Massachusetts” remained specifically active in the research in this domain. The “Health Care Sciences & Services” leads the rest of the categories in CDSS.
A significant dimension of future work is to conduct scientometric analysis for identifying disease patterns, specifically in the cardiovascular, breast cancer, and diabetes domains.
8
Acknowledgement
This research project is funded by the EPSRC (Grant Ref. No. EP/H501584/1) and Sitekit Solutions Ltd. We would like to thank Professor Warner Slack from Harvard Medical School for providing useful insights and for his support and encouragement.
9
References
[1] J. A. Osheroff, J. M. Teich, B. Middleton, E. B. Steen, A. Wright, and D. E. Detmer, "A roadmap for national action on clinical decision support," Journal of the American medical informatics association, vol. 14, pp. 141-145, 2007.
https://doi.org/10.1197/jamia.M2334
[2] J. T. Ahn, G. H. Park, J. Son, C. S. Lim, J. Kang, J. Cha, et al., "Development of test toolkit of hard review to evaluate a random clinical decision support system for the management of chronic adult diseases," Wireless Personal Communications, vol. 79, pp. 2469-2484, 2014.
https://doi.org/10.1007/s11277-014-1835-7
International journal of medical informatics, vol. 87, pp. 91-100, 2016.
https://doi.org/10.1016/j.ijmedinf.2015.12.017 [4] C. Vaghela, N. Bhatt, and D. Mistry, "A Survey on
Various Classification Techniques for Clinical Decision Support System," International Journal of Computer Applications, vol. 116, 2015. https://doi.org/10.5120/20498-2369
[5] Y.-J. Son, S. Jeong, B.-G. Kang, H. Kim, and S.-K. Lee, "Visualization of e-Health research topics and current trends using social network analysis," Telemedicine and e-Health, vol. 21, pp. 436-442, 2015. https://doi.org/10.1089/tmj.2014.0172 [6] G. J. Njie, K. K. Proia, A. B. Thota, R. K. Finnie, D.
P. Hopkins, S. M. Banks, et al., "Clinical decision support systems and prevention: a community guide cardiovascular disease systematic review," American journal of preventive medicine, vol. 49, pp. 784-795, 2015. https://doi.org/10.1016/j.amepre.2015.04.006 [7] K. M. Marasinghe, "Computerised clinical decision
support systems to improve medication safety in long-term care homes: a systematic review," BMJ open, vol. 5, p. e006539, 2015.
https://doi.org/10.1136/bmjopen-2014-006539 [8] B. Martínez-Pérez, I. de la Torre-Díez, M.
López-Coronado, B. Sainz-De-Abajo, M. Robles, and J. M. García-Gómez, "Mobile clinical decision support systems and applications: a literature and commercial review," Journal of medical systems, vol. 38, pp. 1-10, 2014.
https://doi.org/10.1007/s10916-013-0004-y
[9] S. R. Loya, K. Kawamoto, C. Chatwin, and V. Huser, "Service oriented architecture for clinical decision support: A systematic review and future directions," Journal of medical systems, vol. 38, pp. 1-22, 2014. https://doi.org/10.1007/s10916-014-0140-z
[10] M. Fathima, D. Peiris, P. Naik-Panvelkar, B. Saini, and C. L. Armour, "Effectiveness of computerized clinical decision support systems for asthma and chronic obstructive pulmonary disease in primary care: a systematic review," BMC pulmonary medicine, vol. 14, p. 1, 2014.
https://doi.org/10.1186/1471-2466-14-189
[11] V. Diaby, K. Campbell, and R. Goeree, "Multi-criteria decision analysis (MCDA) in health care: a bibliometric analysis," Operations Research for Health Care, vol. 2, pp. 20-24, 2013.
https://doi.org/10.1016/j.orhc.2013.03.001
[12] K. Kawamoto, C. A. Houlihan, E. A. Balas, and D. F. Lobach, "Improving clinical practice using clinical decision support systems: a systematic review of trials to identify features critical to success," Bmj, vol. 330, p. 765, 2005.
https://doi.org/10.1136/bmj.38398.500764.8F [13] J.-H. Chuang, G. Hripcsak, and R. A. Jenders,
"Considering clustering: a methodological review of clinical decision support system studies," in Proceedings of the AMIA Symposium, 2000, p. 146. [14] C. Chen, "CiteSpace II: Detecting and visualizing
emerging trends and transient patterns in scientific literature," Journal of the American Society for
information Science and Technology, vol. 57, pp. 359-377, 2006. https://doi.org/10.1002/asi.20317 [15] D. Yu, "A scientometrics review on aggregation
operator research," Scientometrics, vol. 105, pp. 115-133, 2015.
https://doi.org/10.1007/s11192-015-1695-2
[16] M. Niazi and A. Hussain, "Agent-based computing from multi-agent systems to agent-based models: a visual survey," Scientometrics, vol. 89, pp. 479-499, 2011. https://doi.org/10.1007/s11192-011-0468-9 [17] S. Zhu, H. H. Yang, and L. Feng, "Visualizing and
Understanding the Digital Divide," in International Conference on Hybrid Learning and Continuing Education, 2015, pp. 394-403.
https://doi.org/10.1007/978-3-319-20621-9_33 [18] P. Xie, "Study of international anticancer research
trends via co-word and document co-citation visualization analysis," Scientometrics, vol. 105, pp. 611-622, 2015.
https://doi.org/10.1007/s11192-015-1689-0
[19] F. Madani, "Technology Mining'bibliometrics analysis: applying network analysis and cluster analysis," Scientometrics, vol. 105, pp. 323-335, 2015. https://doi.org/10.1007/s11192-015-1685-4 [20] Y. Fang, "Visualizing the structure and the evolving
of digital medicine: a scientometrics review," Scientometrics, vol. 105, pp. 5-21, 2015.
https://doi.org/10.1007/s11192-015-1696-1
[21] J. Mingers and L. Leydesdorff, "A review of theory and practice in scientometrics," European Journal of Operational Research, vol. 246, pp. 1-19, 2015. https://doi.org/10.1016/j.ejor.2015.04.002
[22] J. Pritchard, "Statistical bibliography or bibliometrics?," Journal of documentation, vol. 25,
pp. 348-349, 1969.
https://doi.org/10.1108/eb026482
[23] V. V. e. Nalimov and Z. M. Mulʹchenko, "Measurement of science. Study of the development of science as an information process," Foreign technology div wright-patterson AFB Ohio, 1971. [24] W. Hood and C. Wilson, "The literature of
bibliometrics, scientometrics, and informetrics," Scientometrics, vol. 52, pp. 291-314, 2001. https://doi.org/10.1023/A:1017919924342
[25] Z. Taşkın and A. U. Aydinoglu, "Collaborative interdisciplinary astrobiology research: a bibliometric study of the NASA Astrobiology Institute," Scientometrics, vol. 103, pp. 1003-1022, 2015. https://doi.org/10.1007/s11192-015-1576-8 [26] M. Rahman and R. Karim, "Comparative study of
different methods of social network analysis and visualization," in Networking Systems and Security (NSysS), 2016 International Conference on, 2016,
pp. 1-7.
https://doi.org/10.1109/NSysS.2016.7400702 [27] W. De Nooy, A. Mrvar, and V. Batagelj, Exploratory
![Figure 1: The proposed methodology (adapted from [2, 3]) for the visual analysis of clinical decision support systems for the discovery of emerging patterns and trends in the bibliographic data of the domain](https://thumb-us.123doks.com/thumbv2/123dok_us/8037544.2128298/3.892.164.747.917.1101/proposed-methodology-analysis-clinical-decision-discovery-patterns-bibliographic.webp)
![Table 2: The field tags representing record fields in the input data [32]](https://thumb-us.123doks.com/thumbv2/123dok_us/8037544.2128298/4.892.120.810.707.1144/table-field-tags-representing-record-fields-input-data.webp)