A
Com
Abstra structur explana We inve signific focusing show th industri differen analyze Keywo
1. Int
Nowad from t enjoy pursuin transpo for the techno (1998) “A acqu their n
*Corresp
DOI: htt Print ISS Copyrig School o
The A
Analysis o
mmerce, Bu
S
1Departm 2School
act. This study ral changes of atory variables estigate influen cance of this m
g on the comm hat these varia
ial sectors, inc nt. Based on t ed sectors were
rds: ICT, Indu
troduction
days, our dail technology. F
games use ng their hobb ortation tools eir daily com
logy is also :
nd through te ired powerful natural enviro and, more
ponding author.
tp://dx.doi.org/1 SN: 1978-6956; ght@2013. Publi of Business and
Asian Journal
of Influenc
usiness Se
ectors Usi
Ubaidillah Z ment of Indus
of Business a
y analyzes inf of Japanese in s, computers (in
nces by the Co odel by the Lik merce, business bles, separatel cluding the an this difference, e dissimilar. ustrial Structur
ly activities a For example video gam by, and peop s, such as tra mmute. The i o mentioned
echnology hum l capabilities onments local recently glob
Email: ubaidilla
0.12695/ajtm.20 Online ISSN: 20 shed by Unit Re Management-In
of Technology
ces of ICT
ervices and
ing Multiv
Zuhdi1,2*, Shu trial Adminis and Managem
fluences of Inf ndustrial secto
ncluding main onstrained Mu kelihood Ratio s services and ly and jointly, h nalyzed ones. T
we can say
ral Changes, CM
are inseparabl , people wh e devices i le usually us ains and cars importance o d by Grüble
mans have to transform lly, regionally
ally.”
ah.zuhdi@gmail
013.6.2.5 089-791X. esearch and Know nstitut Teknologi
y Management
T on Struct
d Office Su
variate An
unsuke Mori1, stration, Toky ment, Institut T
nformation and ors from 1985
parts and acc ultivariate Reg o Test (LRT) me d office supplie
had significan The patterns of
that during 19
MR, LRT, Japa
le ho n se s, of er
y,
One t Inform (ICT) almos home comp A si regard many Lee perce office
.com
wledge. Bandung
Vol. 6 No. 2 (2
tural Chan
upplies, an
nalysis: 198
, Kazuhisa Ka yo University
Teknologi Ba
d Communica 5 through 200 cessories) and gression (CMR)
ethod. We then es, and person
t influence on f influence in 985–2005 the
an
technology th mation and C ), such as c st all peopl es, schools, puters an impo
imilar pheno ding mobile y previous stu
(2010) inve eption barrier
ers toward IC
2013): 102-111
nges in Ja
nd Person
85–2005
amegai1 of Science, Ja andung, Indon
ation Technolo 05. ICT is rep telecommunica R) model and t
n perform micr nal services sec
structural cha analyzed secto
business circu
hat permeate Communicati computers. In le use comp , and off ortant aspect omenon is
Internet dev udies of ICT stigated the rs of agricul CT program im
1
apanese
nal Service
apan nesia
ogy (ICT) in presented by t ations equipme test the statisti roscopic analys
ctors. The resu anges in Japan
ors are, howev umstances of
s our society ion Technolo n recent yea puters in th ffices, maki in everyday l also observ vices. There a T. Purnomo a
readiness a ltural extensi mplementation
es
the two ent. ical sis, ults ese ver, the
y is ogy
ars, heir ing life. ved
Zuhdi, Mori, and Kamegai, Analysis of Influences of ICT on Structural Changes in Japanese Commerce, Business Services and Office Supplies, and Personal Services Sectors Using Multivariate Analysis: 1985–2005
Their study focused on officers connected with public organizations in the Indonesian Ministry of Agriculture. Chigona et al. (2010) explored factors affecting ICT integration in teaching and learning activities. Their study focused on schools in disadvantaged communities in the Western Cape, South Africa. Sharma and Singh (2011) conducted a study of the performance and impact of ICT in universities in the Western Himalaya Region, India. Sudaryanto (2011) investigated factors influencing adoption of computers in East Java On-Farm Agribusiness (EJOFA), and implications for developing sustainable agriculture.
Zuhdi et al. (2012) compared the role of ICT sectors in national economic structural changes of specific countries. Specifically, they investigated the influences of ICT in changes of the Input–Output (IO) activities of industrial sectors in Indonesia and Japan to examine macroeconomic structural changes.
However, the analysis of statistical significance was not well discussed in their study. This discussion is important because it can analyze the business circumstances of the sectors and can clarify the chances of enhancing business activities of industrial sectors. This study is conducted to fulfill this gap.
This study analyzes the influences of ICT in structural changes of industrial sectors of Japan, one of the most developed countries in the world, and one where ICT has been eagerly developed. The analysis period is 1985–2005. We develop a statistical tool to investigate influences reflecting the properties of IO activity vectors. We also perform a deeper analysis on particular sectors to obtain more detailed information related to ICT influences. The remainder of this paper is arranged as follows. Chapter 2 describes the methodology of this study. Chapter 3 explores the calculation results and analysis of these results. Chapter 4 gives conclusions and suggests areas for further research.
2. Methodology
The methodology of this study is as follows. First, we aggregate some sectors in the Japanese IO tables for 1985, 1990, 1995, 2000, and 2005 to get the same number of industrial sectors. The number of Japanese industrial sectors for these years was 84, 91, 93, 104, and 108, respectively. These sectors are reclassified into 78 sectors.
We next do the calculation in order to get IO coefficient matrices for each year in the analysis period. Miller and Blair (2009) gave the following equation for this calculation:
j ij ij
X
z
a
=
. (1)where, aij, zij, and Xj are the input needed from
industry i to produce one unit of production in
industry j, inter-industry sales by sector i to
sector j, and total production of sector j,
respectively. Further, aij represents the IO
coefficient from sector i to sector j.
Next, we calculate the influence of the explanatory variables, which were computers (hereafter, including main parts and accessories) and telecommunications equipment, on Japanese industrial structural changes. These changes are represented by dynamic changes in the IO coefficient vectors extracted from the IO tables. To conduct this calculation, we develop a Constrained Multivariate Regression (CMR) model.
Data for the variables are obtained from the website of the Japanese Ministry of Internal Affairs and Communications. As with the main data, these variables hold data for 1985, 1990, 1995, 2000, and 2005. A detailed description of the CMR model is as follows. We begin by defining the years of analysis as T (here, 1985, 1990, 1995, 2000, and 2005). We can then define the data representing Japanese industrial structural changes, IO coefficient matrices, as a(t) t = 1…T. In this
each industrial sector of Japan through the IO coefficient of the sector. The explanatory variables used can be represented as x(k,t) k =
1…k. The following mathematical model, a representation of the CMR model, is employed as an elaboration of a(t):
∑
×
+
+
=
k
b
i
k
x
k
t
e
i
t
i
b
t
i
a
(
,
)
0
(
)
(
,
)
(
,
)
(
,
)
,
0
)
,
(
i
t
≥
a
∑
ia
(
i
,
t
)
=
1
.
0
. (2) where b0(i) and b(i,k) explain the regressioncoefficients of the model. Since coefficients are nonnegative and these sums should be unity by definition, constraints among estimators are imposed. e(i,t) describes the
difference of original and estimated values. One can obtain the parameters by the least squares method,
min
.
∑∑
i te
(
,i
t
)
2.Next, we test the statistical significance of estimators in the fitted model with the Likelihood Ratio Test (LRT) method. This method is based on calculation of –N(ln S – ln S0), where N and S are the total amount of data
and the results of performance function optimization, respectively. N is given by K × M × T, where K, M, and T are the number of
sectors that give input for the discussed sector(s), the number of discussed sectors, and the number of periods, respectively. The degrees of freedom are given by (K-1) × M ×
(number of removed explanatory variables). The statistical significance of an explanatory variable is given by –N(ln S – ln S0), which
follows a χ2 distribution. We take 0.05 as the level of significance, and thus use the 0.05 level of the χ2 distribution. The degrees of freedom are 78 × 1 × 2 = 156 for the joint explanatory variables and 78 × 1 × 1 = 78 for separate explanatory variables. The cutoff scores for statistical significance are χ2
0.05 (156) = 185.86 and χ2
0.05 (78) = 99.33. We use these scores to investigate the statistical significance of the explanatory variables on each Japanese industrial sector. A particular explanatory variable is said to significantly influence a specific sector if its significance
score is greater than the cutoff score. We use three null hypotheses to emphasize the results of this method. These are
• Hypothesis 1: Computers had no influence
on structural changes of Japanese industrial sectors from 1985–2005.
• Hypothesis 2: Telecommunications
equipment had no influence on structural changes of Japanese industrial sectors from 1985–2005.
• Hypothesis 3: Computers and
telecommunications equipment jointly had no influence on structural changes of Japanese industrial sectors from 1985– 2005.
The previous calculations can be simplified as follows. We first describe the original data of the five periods of the IO coefficient matrices of 78 Japanese industrial sectors as A(t,i,j).
The vectors of explanatory variables Ex_x(k,t)
are used as sources of influences on the data. We use the CMR model to calculate the influence of these variables on Japanese industrial structural changes in the analysis period. We then describe the influenced original IO coefficient matrices as an estimated IO coefficient matrices, A_est(t,i,j).
To perform the calculation we use the General Algebraic Modeling System (GAMS) software, which is software for analyzing high-level modeling systems for optimization and mathematical programming (GAMS, n.d.). The next step is a test using the LRT method to determine the statistical significance of estimators in the fitted model.
Zuhdi, Mori, and Kamegai, Analysis of Influences of ICT on Structural Changes in Japanese Commerce, Business Services and Office Supplies, and Personal Services Sectors Using Multivariate Analysis: 1985–2005
IO coefficients of these sectors as a first step of this analysis. The calculation for estimated IO coefficients is ignored because the results of this calculation generally follow the previous one. The purpose of this calculation is to know the magnitude of the changes of the original IO coefficients over the period of analysis. For each focused sector, we choose the ten coefficients with the highest standard deviations. These top ten coefficients represent inputs with dynamic changes. From these coefficients we choose one with an increasing pattern as a target for analysis. We also discuss input changes from value added sectors to analyzed sectors. The coefficient of variation and amount of correlation (R) are used to gain deeper insights related to influences of the variables in these sectors. Afterthis analysis, we describe the conclusions of this study and possible topics for further research.
3. Results and Analysis
3.1. The Results of LRT Calculation
We firstly calculate the LRT to estimate the CMR model. The summary of this calculation is described in Table 1. From information in this table, we can assert that computers significantly influenced the structural changes of a majority of Japanese industrial sectors from 1985 to 2005. Exceptions are seen for the petroleum refinery products, coal products, and steel products sectors. Similar results are obtained for the influences of telecommunications equipment, which significantly influenced the structural changes of all Japanese industrial sectors from 1985– 2005 except for the non-metallic ores, basic and intermediate chemical products, and gas and heat supply sectors. Because both explanatory variables significantly influenced the structural changes of a majority of Japanese industrial sectors from 1985 to 2005, we reject the first and second null hypotheses. The combination of explanatory variables used significantly influenced the structural changes of all Japanese industrial sectors from 1985–2005. This is a stronger result than the previous one. Based on this result, we then reject the third null hypothesis.
Table 1. Summary of LRT calculations (null model base)
No Explanatory variable
Number of sectors significantly
influenced
Number of sectors not significantly
influenced
1 Computers 75 3
2 Telecommunications
equipment 75 3
3 Combination of both 78 0
3.2. Microscopic Analysis 3.2.1. Commerce Sector
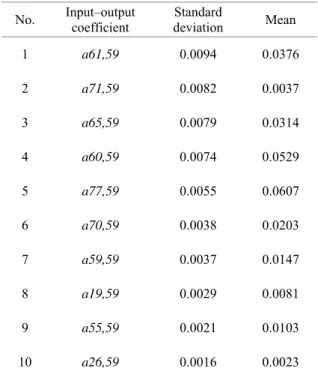
Table 2 describes the top ten original IO coefficients of commerce sectors as determined by standard deviation over the period from 1985–2005. Based on the information in this table, the most dynamic input is from the real estate agencies and rental services sector, sector number 61. For analysis we choose a70,59, the IO coefficient
that describes input from the communication sector to the commerce sector, because this coefficient has an increasing pattern.
Table 2. Top ten original IO coefficients in the commerce sector by standard deviation (1985–2005)
No. Input–output coefficient deviation Standard Mean
1 a61,59 0.0094 0.0376
2 a71,59 0.0082 0.0037
3 a65,59 0.0079 0.0314
4 a60,59 0.0074 0.0529
5 a77,59 0.0055 0.0607
6 a70,59 0.0038 0.0203
7 a59,59 0.0037 0.0147
8 a19,59 0.0029 0.0081
9 a55,59 0.0021 0.0103
Figure 2005. represe 2000, a of var values betwee These follow during had a s
F Tab estima C Or 0 Change 2005 relation commu device follow commu mail de activiti outside passes, signific compu is evid increas the co especia sector, inform
1 shows the Numbers in ent the analys and 2005. Tab riation of bo
of this coef en the value results indic s historical
1985–2005 strong influen
igure 1. Change
ble 3. Coefficien ated values of a7
value
Coefficient of va riginal Es 0.186
es in a70,59 i
ICT dev nship betwe unication sec s in this relati s. The c unication ser elivery servic ies. The com er, can provid , the quality a cantly advan uters and telec dence of thi se the intensi ommerce and
ally input f since the de mation between
change in a
n this and sis years 1985
ble 3 shows t oth original a fficient and t es over the
cate that our changes. In the explanat nce on a70,59.
s in a70,59 from 1
nt of variation of
70,59 and correlat
es (1985–2005) ariation C stimated 0.174 ndicate that vices streng
een the co ctors. The r ionship can b ommerce s rvices, such
ces, to condu mmunication de these serv and quantity o nces. The e communicatio is growth. T ity of cooper d communic from the co evices expedit
n both sectors
70,59 for 1985
other figure 5, 1990, 1995 the coefficien and estimate
he correlatio same period r model wel other words tory variable
1985–2005
f original and tion (R) of both
Correlation
0.936
during 1985 gthened th ommerce an role of thes e explained a sector need as postal an uct its busines sector, as a vices. As tim of ICT device emergence o ons equipmen These device ration betwee ation sectors ommunicatio te the flow o s. – es 5, nt d n d. ll s, es – he nd se as ds nd ss an me es of nt es n s, n of Figur the va durin increa coeffi 1995, 1995– variat value betwe These follow durin had a Tabl estim O Increa to pa price 2 sug comm patter coeffi years this contin devic the espec
We b estim
re 2 shows c alue added se ng 1985–200 asing–decreas ficient. An in
, while a dec –2005. Table tion of both es of this coe
een the valu e results sug ws historical ng 1985–2005 a strong influe
Figure 2. Chang
le 4. Coefficient mated values of valu
Coefficient of v Original E
0.024
asing input f articular sect of this sector ggests that du merce sector rn, refers to ficient, did no s of analysis.
IO coefficie nued through ces had a po price of c cially during 1
believe that mated a79,59 d
changes of a7
ector to the co 05. This fig
sing patte ncrease is evi creasing patte e 4 shows th
the original efficient, and ues over the ggest that o l changes. In
5 the explan ence on a79,59.
ges in a79,59 from
t of variation of b a79,59 and correl
ues (1985–2005)
variation Estimated
0.020
from the valu tor implies t r will rise. Th uring 1985–19 r outputs in the original ot continue in
From the est ent, howeve h 2000. This ositive impact
commerce s 1995–2000.
an increas during 1995–
79,59, input fro
ommerce sect gure shows
rn in th ident for 198 ern emerged
e coefficient l and estimat the correlati e same perio our model w
n other wor natory variab
.
m 1985–2005
both original and lation (R) of both
)
Correlation
0.833
due to Japan years, Nation sectors good withou ICT d telecom sectors quality that de sectors mainta device the inc 1995–2 3.2.2. B Sector Table coeffic office deviati that th publish 19. Fo coeffic finance service this co Table 5 services
No I
1 2 3 4 5 6
Zuhdi, Mori, an Ser
economic con continuously
further acce ns, 2000). T s should hav
quality outp ut adding emp
evices, repre mmunications s in that goal y assurance evice installat s need to mai ain cash flo s are employ creasing patt 2000.
Business Ser r
5 shows t cients for th
supplies sec ion during 19 he most dyn hing and prin or analysis, cient, which e and insuran es and office
efficient has a
5. Top ten origina s and office supp (1 nput–output coefficient a19,77 a71,77 a47,77 a60,77 a77,77 a18,77
nd Kamegai, Ana rvices and Office
nditions. Une y rose during elerating in Therefore, in ve taken step
puts and attr ployees.
esented by c s equipment, by, for examp activities. N tion costs ca intain an attra ow balances
ed. This argu ern in estim
rvices and O
the top ten he business
ctor, relative 985–2005. Th
namic input nting sector, s
we choose describes in nce sector to e supplies se an increasing
al IO coefficient plies sector by st
985–2005) Standard deviation 0.0291 0.0237 0.0116 0.0087 0.0086 0.0078
alysis of Influenc e Supplies, and P
employment i g slow growt 1999 (Unite n this perio ps to maintai ractive price
omputers an , can suppor
ple supportin ote, however an be high, s
active price t when thes ument explain ated a79,59 fo
ffice Supplie
original IO services an e to standar his table show is from th sector numbe the a60,77 IO
nput from th o the busines ector, becaus
pattern.
ts of the business tandard deviation Mean 0.0431 0.0427 0.0213 0.0396 0.1038 0.0141
ces of ICT on Str Personal Service n th d d n es nd rt ng r, o to se ns or es O nd rd ws he er O he ss se s n 7 8 9 10 Figur 2005. variat value these result histor 1985– strong Tabl estim O Chan 2005 betwe the bu An 1995– in the appea this d Japan unem 1999. condi exper ructural Change es Sectors Using
a46,77
a61,77
a43,77
a42,77
re 3 shows ch . Table 6 tion of both es of this coef
values ove ts suggest th rical change –2005 the e g influence on
Figure 3. Chang
le 6. Coefficient mated values of valu
Coefficient of v Original E
0.221
nges in a60,77
ICT devices een the finan usiness servic
interesting c –2000: a dec e original dat ars in the esti difference is d n during this p mployment in . Both secto ition to some riences this c
es in Japanese C g Multivariate An
0.0071
0.0051
0.0047
0.0040
hanges in a60,
shows the the original fficient and th er the same hat our mode
s. In other explanatory v
n a60,77.
ges in a60,77 from
t of variation of b a60,77 and correl
ues (1985–2005)
variation Estimated
0.175
indicate tha s supported t nce and insura
ces and office condition oc creasing patte ta, but an inc imated data. due to econom
period. As m n Japan incre ors were infl extent. Partic condition nee Commerce, Busin nalysis: 1985–20 0.0163 0.0120 0.0071 0.0066
77 during 198
coefficient l and estimat he correlation
period. The el well follo
words, duri variables had
m 1985–2005
both original and lation (R) of both
)
Correlation
0.793
at during 198 the relationsh ance sector a e supplies sec ccurred duri ern is observ creasing patte We believe th mic condition
entioned abov eased further uenced by t cular sector th ed to search
ways providi employ and te way o human perform increas for 199 Figure the val and of This f pattern coeffic and es correla These follow during had a s
F Table estima C Or 0 Increas particu of this sugges outputs supplie slight d show t
to increase ing good yees. ICT de elecommunica f doing so. n error and
mance. This m sing pattern s 95–2000.
4 shows ch lue added sec ffice supplies
figure show n in this coef cient of varia stimated valu ation of the va
results sugg s historical
1985–2005 strong influen
igure 4. Change
7. Coefficient o ated values of a7
value
Coefficient of va riginal Es 0.040
sed input from ular sector sug
s sector will sts that durin
s of the bus es sector inc decrease appe the same pat
e performanc service, wit evices, such ations equipm These device thus help may be a fac seen in the e
anges in a79,
ctor to the bus sector durin s a general fficient. Table ation for both ues of this co alues over the gest that our changes. In the explanat nce on a79,77.
s in a79,77 from 1
of variation of bo
79,77 and correlat
es (1985–2005)
ariation stimated
0.040
m the value a ggests that th
rise. Theref ng 1985–2000
siness servic creased. In 2
eared. Both I ttern, sugges
ce, includin thout addin as computer ment, are on es can reduc to maintai tor behind th stimated a60,7
77, input from
siness service ng 1985–2005 lly increasin e 7 shows th h the origina oefficient, an
e same period r model wel other words tory variable
1985–2005
oth original and tion (R) of both
Correlation
0.984
added sector t he goods pric fore, Figure 0 the price o es and offic 2000–2005, IO coefficient sting that ICT
ng ng rs ne ce n he 77 m es 5. ng he al nd d. ll s, es to ce 4 of ce a ts T devic the pr and o 1985– 3.2.3. Table coeffi relativ This is from For a descr servic has an Table ser No. 1 2 3 4 5 6 7 8 9 10 Figur 1985– variat value these result histor 1985– strong
ces had a po rice of the go office supplie –2000.
. Personal Se
e 8 shows ficients of th
ve to standar table shows t m the comme analysis, we c
ribes input fro ces sector, a5
n increasing p
e 8. Top ten origi rvices sector by s
Input–output coefficient a59,78 a77,78 a78,78 a71,78 a61,78 a72,78 a60,78 a26,78 a10,78 a58,78
re 5 shows t –2005. Table tion for both es of this coef values ove ts suggest th rical change –2005 the e g influence on
ositive impact oods of the bu
es sector, es
ervices Secto
the top te he personal rd deviation that the most erce sector, se choose the IO
om this sector
59,78, because
pattern.
inal IO coefficie standard deviatio t Standard deviation 0.0124 0.0077 0.0057 0.0055 0.0051 0.0039 0.0038 0.0031 0.0029 0.0029 the changes e 9 shows th h the original
fficient and th er the same hat our mode
s. In other explanatory v
n a59,78.
t on increasi usiness servic specially duri or en original services sect for 1985–200 t dynamic inp ector number
coefficient th r to the person this coefficie
nts of the person on (1985–2005)
d
n Mean
0.0546 0.0357 0.0165 0.0044 0.0199 0.0053 0.0202 0.0050 0.0367 0.0084
in a59,78 duri
e coefficient l and estimat he correlation
period. The el well follo
F Table estima C Or 0 Change 2005 relation person pattern the ori that charact This s produc this. F comme ICT d this co flow o device both se Figure the val sector, genera Table both th coeffic over th that ou In oth explan on a79,7
Zuhdi, Mori, an Ser
igure 5. Change
9. Coefficient o ated values of a5
value
Coefficient of va riginal Es 0.227
es in a59,78 i
ICT devic nship betwe
al services n clearly appe
iginal and es this pattern teristics of th sector needs cts, and the
igure 5 sugg erce sector in evices, espec onnection bec
of informatio s strengthen b ectors.
6 describes c lue added sec from 1985– lly decreasing 10 shows the he original an cient, and the he same peri ur model well her words,
atory variabl
78.
nd Kamegai, Ana rvices and Office
s in a59,78 from 1
of variation of bo
59,78 and correlat
es (1985–2005)
ariation stimated
0.197
ndicate that es well su een the co
sectors. A eared in this p stimated data n appears he personal se a “field” t commerce se gests that sup
ncreases from cially compu cause they can on. In other business activ
changes in a79
ctor to the per 2005. This fi g pattern in th e coefficient o nd estimated correlation o iod. These re
follows histo during 19 les had a str
alysis of Influenc e Supplies, and P
1985–2005
oth original and tion (R) of both
Correlation 0.868 during 1985 upported th ommerce an An increasin period, in bot a. We believ because o ervices sector to market it ector provide pport from th m year to yea uters, promot n expedite th words, thes vities betwee
9,78, input from
rsonal service figure shows his coefficien of variation o
values of thi of these value esults sugges orical changes 85–2005 th rong influenc
ces of ICT on Str Personal Service – he nd ng th ve of r. ts es he r. te he se n m es a t. of is es st s. he ce Table estim O Decre to pa price 6 sug price decre appea the p utilize will b This Furth of pro ICT d more not.
4. C
This struct sector consi capita stock teleco techn variab analy the st fitted ructural Change es Sectors Using
Figure 6. Chang
e 10. Coefficien mated values of valu
Coefficient of v Original E
0.024
eased input f articular sect of this secto ggests that du
of the person ease. We su
ars due to the personal ser e ICT devic be more effic efficiency w her, this reduc oducts. In oth devices in the competitive
Conclusions a
study analyz tural change
rs during 19 idered ICT t al stock. Mo k is represe
ommunication nologies we
bles. We emp ysis tool and u
tatistical sign d model. We
es in Japanese C g Multivariate An
ges in a79,78 from
nt of variation of a79,78 and correl
ues (1985–2005)
variation Estimated
0.020
from the valu tor suggests
r will fall. Th uring 1985–2 nal services s uggest that e adoption of rvices sector ces in produ cient than tho will reduce o ction will dec her words, sec eir business a
in market tha
and Further
zed the influe es of Japan 985–2005. In to be repres ore specifical ented by c ns equipment ere used a ployed the CM
used the LRT nificance of e
also conduc
Commerce, Busin nalysis: 1985–20
m 1985–2005
f both original an lation (R) of both
)
Correlation
0.851
ue added sec that the goo herefore, Figu 2000 the outp sector tended
this downtu f ICT devices
r. Sectors th uction activit
ose that do n operating cos crease the pr ctors that util activities will
an those that
Research
ences of ICT nese industr
this study, sented by IC lly, ICT capi computers a t. Both of the as explanato MR model as T method to t
testing to bolster the strength of the results. We then performed deeper analysis, focusing microscopically on the commerce, business services and office supplies, and personal services sectors. We used standard deviations, coefficients of variation, and correlations to obtain a deeper understanding of the influences of these variables in the examined sectors.
The results showed that in the analysis period these variables, separately and jointly, had a significant influence on structural changes of Japanese industrial sectors, including the analyzed sectors. From the statistical significance of the analyzed sectors, structural change of the commerce sector was more strongly influenced by telecommunications equipment than by computers. An opposite phenomenon was seen for the structural change of the business services and office supplies sector. The structural change of the personal services sector, in contrast, was equally influenced by both explanatory variables.
The results also show that the patterns of influence due to the explanatory variables differ among analyzed sectors. This difference is clearly observed in input from the value added sector. We believe that the implementation of ICT devices in the business activities of these sectors, and economic conditions, such as unemployment rates, influence this difference. These phenomena support the conclusion that in 1985–2005 the business circumstances of the analyzed sectors were dissimilar.
This study could analyze the influences of ICT in structural changes of Japanese industrial sectors from 1985–2005, especially focusing on the structural changes of ICT-related sectors. The scope of this study, however, should be expanded further. For instance, analysis of sectors, such as the agricultural and manufacturing sectors, would allow broader observation of the influences of ICT. Further analysis of, for example, structural changes in
capital formation coefficients, would more comprehensively show the influences of ICT by sector.
Finally, investigating this topic at the international level is also suggested for further research. Such a comparison would reveal the characteristics of industrial structural changes in the compared countries.
References
Chigona, A., Chigona, W., Kayongo, P., & Kausa, M. (2010). An Empirical Survey on Domestication of ICT in Schools in Disadvantaged Communities in South Africa. International Journal of Education and Development using Information and Communication Technology (IJEDICT) 6 (2):
21-32.
Grübler, A. (1998). Technology and Global Change. Cambridge: Cambridge University
Press. ISBN: 0 521 59109 0.
GAMS. (n.d.). Welcome to the GAMS home page!. Available at http://www.gams.com/.
[accessed 12 November 2013]
Japanese Ministry of Internal Affairs and Communications. (n.d.). 2009 White paper of information and communication: Reference.
Available at http://www.soumu.go.jp/johotsusintokei/white
paper/ja/h21/data/html/l6c00000.html. [accessed 9 November 2013]
Miller, R. E., & Blair, P. D. (2009). Input– Output Analysis: Foundations and Extensions–2nd Ed. New York: Cambridge
University Press. ISBN: 978 0 521 51713 3.
Zuhdi, Mori, and Kamegai, Analysis of Influences of ICT on Structural Changes in Japanese Commerce, Business Services and Office Supplies, and Personal Services Sectors Using Multivariate Analysis: 1985–2005
Communication Technology (IJEDICT) 6 (3):
19-36.
Sharma, D., & Singh, V. (2011). ICT in Universities of the Western Himalayan Region in India: Performance Analysis. International Journal of Education and Development using Information and Communication Technology (IJEDICT) 7 (1): 86-109.
Sudaryanto. (2011). The Need for ICT Education for Managers or Agri-businessmen for Increasing Farm Income: Study of Factor Influences on Computer Adoption in East Java Farm Agribusiness. International Journal of Education and Development using Information and Communication Technology (IJEDICT) 7 (1): 56-67.
United Nations. (2000). World economic situation and prospects 2000. Available at
http://www.un.org/esa/analysis/wess/wesp200 0.pdf. [accessed 19 November 2013]