9
Deformation And Stability Analysis Of A Cut Slope
Masyitah Binti Md Nujid
11
Faculty of Civil Engineering, University of Technology MARA (Perlis), 02600 Arau PERLIS
e-mail:masyitahmn@perlis.uitm.edu.my
Abstract
A cut slope is subjected to deform and fail during or after construction activities despite the limit equilibrium analysis done during the design process indicate that the designed slope would have a factor safety greater than one. Deformation occurred during and after the excavation yields an additional stress or reduction in the strength of the soil. The objectives of this research are to assess the deformation pattern of soil or slope face induced by cutting, to evaluate the stability of a slope based on shear strength reduction technique and to compare factor of safety results obtained by shear strength reduction technique (SRT) in Plaxis 7.2 and limit equilibrium method (LEM) in SLOPE/ W. The deformation pattern of the natural slope and the cut slopes were analyzed using finite element program in Plaxis 7.2 which soil behavior was modeled as a simple Mohr-Coulomb. Furthermore the stability of these slopes were evaluated based on shear strength reduction technique. Stability analysis was also done on the final cut slope where failure has occurred at this stage using limit equilibrium method (LEM) in SLOPE/W. It was observed that the deformation pattern was significantly affected by slope angle and soil strength. The factor of safety calculated using different computer program gave some differences due to the assumptions and limitations used in the analysis.
Keywords: Cut Slope, Deformation Pattern, Factor of Safety (FOS), Limit Equilibrium Method (LEM), Finite Element Method (FEM)
Introduction
The movement or instability of natural slopes has become a common civil engineering problem for many construction works and sometimes has major socio-economic impact on society (Lee, 2003). According to Lee (2003), soil mass located beneath a sloping ground surface has a tendency to move downward under the influence of gravity.
The stability of the cut slope is designed based on Limit Equilibrium Method (LEM) in which the stability is calculated using the LEM where Factor of Safety (FOS) is estimated as the ratio of the soil strength and driving stress acting along the potential failure surface (Jitno & Gofar, 2005). The method treats the soil as rigid plastic material in which the soil is assumed not to deform as long as the driving stress is less than the soil strength (Jitno & Gofar, 2005). The method does not take into account the change in driving stress when the soil deform during excavation or long time after it is formed. The biggest problem involved in the use of LEM is that failure occurs at a prescribed failure
surface and it will affect the calculated FOS (Cheng, 2003 and Jitno & Gofar, 2005). When failure occurs, the sum of all the shear stresses along the slip surface exactly equals the available strength of the soil, and the FOS is equal to one. SLOPE/W (Geoslope, 2002) is one of the computer programs available in market for slope stability analysis adopted LEM.
reduced by a “factor” that brings the slope into incipient failure. The output of the analysis will be the deformation pattern and the FOS which is calculated based on shear SRT (Duan et al. 2008).
SRT is the factor by which soil shear strength must be reduced to bring a slope to the verge of failure or give a FOS equal to one for certain geometry and loading condition (Duncan, 1996 and Duan et al. 2008). In this case, the shear strength of the soil is given as:
cF ’
+ tan φF ’
(1)
where the factored shear strength parameters cF’and φF’
are:
cF
’= c’ / SRF
(2)
φF’ = tan -1 (tan φ’ / SRF) (3)
The objectives of this study are: 1) to assess the deformation pattern of soil or slope face induced by cutting; 2) to evaluate the stability of a slope based on shear SRT and 3) to compare FOS results obtained by SRT in Plaxis 7.2 and LEM in SLOPE/W.
Methodology
In this project, a deformation and stability analysis of a slope cut according to area development will be conducted using Plaxis7.2. The FOS obtained by SRT the FE analysis will be compared with the FOS using Simplified Bishop method in Limit Equilibrium analysis integrated in SLOPE/W.
Case Study
This study was based on a case presented in Craig (1997) where a natural slope of 1 V : 21/2 H was excavated to make room for a development of a railway construction. The resulting slope was 1 V : 2 H. Thirty years after the construction of the railway, the slope was trimmed back to a slope of 1 V : 11/2 H for further development. The slope was simulated in a FE program using Plaxis 7.2 in which soil properties are modelled as a simple Mohr-Coulomb. Stability analysis will be conducted on Plaxis 7.2 using the SRT. The result in terms of FOS was analyzed with the calculation by LEM based on Bishop Method integrated in SLOPE/W.
FEM approach in Plaxis 7.2
The case study was selected such that the analysis of failed slope can be performed in Plaxis 7.2 for soil in drained condition and Mohr-Coulomb model can be adopted in this analysis (Figure 1).
Figure 1: Slope case studied
The deformation and stability of the cut slopes were analyzed using Plaxis 7.2 by applying the Mohr-Coulomb model for soil behavior and shear SRT to determine the FOS. The boundary condition is assigned as fixed boundary for both x and y directions therefore circle searches for minimum FOS was not allowed to pass through these boundaries. Figure 2 showed undeformed mesh for slope model in Plaxis 7.2.
Figure 2: Undeformed mesh in Plaxis 7.2
Consolidated undrained triaxial test with pore water pressure measurement gave a range of drained shear strength parameters: c’: 10 kN/m2 ( ± 2.2 kN/m2),
and '= 27° ± 2 (tan ’ = 0.512 ± 0.038). The lowest internal friction angle obtained from the test was 22°. For the purpose of the modeling, the highest values were regarded as the peak strength parameter while the lowest ones were regarded as the residual strength. In this case, the soil was assumed to have a peak strength of c’ = 12.2 kN/m2, and '= 29°, while the residual
strength was c’ = 7.8 kN/m2, and '= 22°. Table 1
showed slope material properties assigned in the analysis using Plaxis 7.2.
Table 1: Slope material peoperties
toe crest
(1) 1V:21/2 H = Natural slope
(2) 1V:2 H = Railway construction area
(3) 1V:11/2 H = Further
development area
Material properties Value
E’ (kN/m2) 100000
' 0.30
γ(kN/m3) 18
'peak 29°
'residual 22°
c’peak (kN/m 2
) 12.2
11 The peak strength parameters were assigned for Case 1, 2 and 3 in the analysis. Additional analysis was done for Case 3 where the failure had occurred by assigning residual strength parameters. The results obtained from analysis using Plaxis 7.2 presented in the form of deformation pattern and FOS obtained through the SRT.
LEM approach in SLOPE/W
Detailed stability analysis was performed for Case 3 which was the failed slope by assigning residual strength parameters (c’ = 7.8 kN/m2
, and '= 22°). LE analysis was performed by SLOPE/W for which the Simplified Bishop method was utilized and residual shear strength was compared to the FOS obtained by the shear SRT by FEM.
The result was also compared to the FOS obtained in Craig (1997). Comparison, discussion and conclusion were made based on cases model and case studied. Do not number your page.
Data analysis and results
The purpose of the analysis can be categorized into two which are assessment of deformation pattern of soil or slope induced by cutting and evaluation of slope stability based on shear SRT for three cases under peak strength conditions. The slope was actually failed five years after the second stage of excavation. Back calculation indicated that the FOS was slightly above one. FE analysis was also made for Case 3 under residual strength condition. Comparison in terms of safety factor obtained for Case 3 between SRT and Bishop Method integrated in SLOPE/W programme was made and discussed.
Deformation analysis
The deformation analysis was conducted on for Case 1, 2 and 3. In these cases the discussion is focused on the deformations resulted from the excavation activities. Note that the excavation on second stage in Case 3 results in slope instability which means that the plastic deformation is expected at this stage. The deformation pattern and total displacement of the natural slope (case 1) and the cut slopes (case 2, and case 3) are shown in Figure 3, 4, 5 and 6. From these figures (Figure 3-5), the increase in slope inclination from Case 1 (1V : 21/2 H ) with slope angle of 21.8o to Case 2 (1V : 2H) with slope angle of 26.6o induces an increase of displacement of the slope face. The same trend of deformation pattern was observed when the slope angle
increase to (1V : 11/2H) or slope angle of 33.7o. In this case, the maximum displacement is increasing from 21mm for Case 1, to 24mm for Case 2 and 28mm for Case 3. This shows that displacement at the slope face increases as the slope angle increase. Note that the above results were obtained for analysis performed on peak strength.
Deformation analysis was also made for Case 3 for which residual strength was adopted (Figure 6). The deformation become obvious when residual strength parameters were assigned in analysis. Much larger deformation was observed at the slope face resulting in maximum displacement of 43mm. It can be concluded that from these figures presented, the deformation Figure 2: undeformed mesh for slope model in Plaxis 7.2.
(a)
(b)
Figure 3: Slope of 1 V : 21/2 H (a) Deformed mesh (b) Total displacement
(a)
(b)
Figure 4: Slope of 1 V : 2 H (a) Deformed mesh (b) Total displacement
(a)
(b)
Figure 5: (peak strength) Slope of 1 V : 11/2 H (a) Deformed mesh (b) Total displacement
(a)
(b)
pattern and the total displacement were affected by slope angle and soil strength (Table 2).
Table 2: Total displacement results for Case 1, 2 and 3
Stability analysis
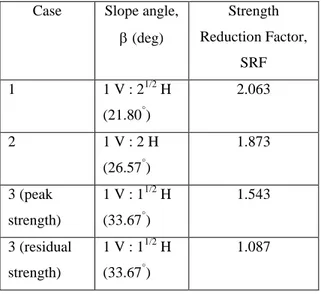
Stability analysis was conducted by using SRT for Case 1, 2 and 3 and the results were summarized in Table 3. It indicated that these slope angles were assigned with peak strength parameters in stable condition. This also indicated that the resulting deformation has not mobilized the full strength of the soil and hence no failure occurred. As expected, the Strength Reduction Factor (SRF) decreases as the slope become steeper. The Case 3 was also analyzed using residual strength as design parameters which indicated that the slope was in the verge of failure.
Table 3: Strength reduction factor obtained from Plaxis 7.2
This agreed with the deformation obtained from the FE analysis where the deformation was much bigger using residual strength as compared to the peak strength. The net total displacements of 43mm may represent plastic deformation. The contour shading of total displacement obtained from Plaxis 7.2 is shown in Figure 7. This figure does not actually represent the slip circle, but the trend in the slope movement.
Figure 7: Contour shading for Case 3
Stability analysis was also done on Case 3 by using SLOPE/W adopting Simplified Bishop method. This further stability analysis was done to verify the result obtained from Plaxis 7.2 and data presented in Craig (1997). Residual strength was assigned in this analysis by assuming that failure has occurred at this strength. Figure 8 shows result of defining slope stability analysis using SLOPE/W. The minimum FOS was 0.991 with critical slip surface started at toe of the slope. This does not represent the contour shading shown in Figure 7 and the slip plane obtained from the case study (Craig, 1997), however it shows a good agreement for shape of failure surface. Deeper failure plane was observed from the latter analysis. This is because the analysis done in this project does not consider the presence of tension crack as the starting point of failure surface.
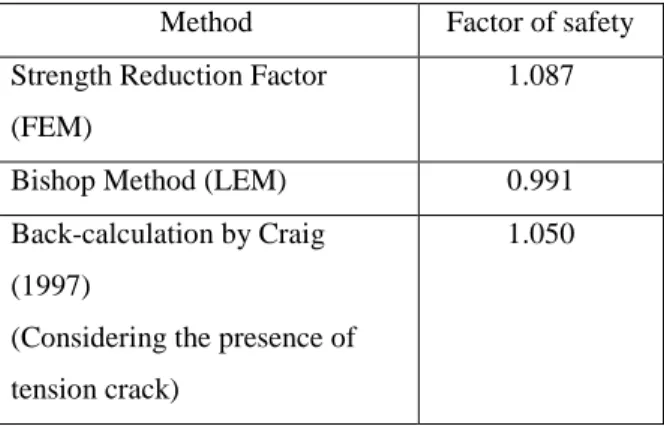
Table 4 summarized the FOS calculated with different methods and presented in Craig (1997). There is 6% difference in safety factor calculated by Plaxis 7.2 and SLOPE/W. The difference in calculated FOS results between Craig (1997) and SLOPE/W was also 6%. The comparison was also made between Craig (1997) and Plaxis 7.2 which gave 4% difference in calculated factor of safety. It can be observed that by assigning appropriate soil strength parameters in Plaxis 7.2, the SRF can be obtained at the end of analysis naturally without any assumption of shape and location of failure surface. However a few assumptions should Case Slope angle,
deg
Total
Displacement ,
TD (mm)
1 1 V : 21/2 H
(21.80°)
21
2 1 V : 2 H (26.57°) 24
3
(peak
strength)
1 V : 11/2 H
(33.67°)
28
3
(residual
strength)
1 V : 11/2 H
(33.67°)
43
Case Slope angle,
(deg)
Strength
Reduction Factor,
SRF
1 1 V : 21/2 H
(21.80°)
2.063
2 1 V : 2 H
(26.57°)
1.873
3 (peak
strength)
1 V : 11/2 H
(33.67°)
1.543
3 (residual
strength)
1 V : 11/2 H
(33.67°)
1.087
1.1 00 1.10
0 1 .1 0 0 1.2 00 1 .2 0 0 1.3 00 1 .3 0 0 1.6 00 1.9 00 0.991
Description: Case 3 Analysis Method: Bishop Direction of Slip Movement: Left to Right Slip Surface Option: Grid and Radius
Soil: 1 Soil Model: Mohr-Coulomb Unit Weight: 18 Cohesion: 7.8 Phi: 22
Distance (m)
0 10 20 30 40 50 60 70 80 90 100 110
13 be followed in SLOPE/W to give a reasonable result. Thus, it can be seen that the calculated safety factors vary with different methods and assumptions taken in the analysis.
Table 4: Comparisons of safety factor results for Case 3
Discussions
The results presented in the previous section indicated that the stability of a slope is influenced by several factors.
Factors Affecting Slope Stability
Based on the results obtained, slope angle ( have a significant influence on deformation or the total displacements at the slope face, hence on the slope stability. Noticed that the analysis of a cut slope should also consider the deformation occurred at the slope face (Figure 3 to 6) because if the displacement of soil particle has mobilized the full strength of the soil, then residual strength parameters may have to be used in the analysis.
Table 2 suggested that there is a significant amount of displacement occurred on Case 3 especially when residual strength parameters are used in the analysis. This indicated that the displacement or strain increases at constant stresses after reaching the yield point and give a factor of safety close to one as (Table 3). This is the case of slope, especially in clay soil, subjected to movement and fail after a long period of time where the residual strength remains to resists the sliding. This is similarly true from Skempton (1964) and Duncan & Wright (2005) suggested based on their study that undisturbed peak strength cannot represent the strength in the field to evaluate the stability of cut slope.
The other factor is the geological conditions and the history of the area. The site investigation conducted on the location of the slope failure reported in Craig (1997)
showed the presence of old river bed and there was a history of slides. Sowers (1979) stated that both defects are among the factors that contribute to the increase in shear stresses and the reduction of the soil strength. Furthermore, it was observed that there was a tension crack at the crest of the slope as presented in Craig (1997). The presence of tension crack is usually specified as the starting point of failure plane which progressing to the toe. When this is not considered, then the failure plane obtained during the analysis may be significantly different from the actual one, resulting in different of safety.
The deformation and stability of the cut slope analysis’s showed that reduction of deformation parameters (Young’s modulus, E and Poisson’s ratio,
and dilation angle, were not affected the results (Duan et al. 2008 and Cheng et al. 2007).
Effect of Analysis Method
In FE analysis, the location and shape of critical slip surface is obtained naturally because FEM approach requires no assumption in the location of failure plane (Griffiths & Lane, 1999). The FEM with SRT will locate position of failure within the zones of the soil mass where there is no sufficient shear strength of soil to resist the shear stresses. The LEM with Simplified Bishop requires the definition of the location of critical slip surface which give minimum FOS (Figure 8). The Simplified Bishop method has limitation because it searches for circular slip surface only. However, the comparison indicates that both methods show good agreement in the shape and location of the critical slip surface as well as the calculated FOS (Jitno & Gofar, 2005 and Cheng et al. 2007). There is a 6% difference in safety factor calculated by Plaxis 7.2 and SLOPE/W. A good agreement was also found in terms of factor of safety calculated by SRT in Plaxis 7.2, SLOPE/W and by Craig (1997). This shows that the effect of analysis method is not very significant in the analysis of slope stability.
Conclusions
The following conclusions are drawn corresponding to the objectives of the study:
1. The deformation pattern is significantly affected by slope angle and soil strength. The total displacements for Case 1, 2 and 3 are 21mm, 24mm and 28mm respectively. The total displacement of 43mm was obtained for Case 3 when residual strength parameters were used in the analysis. It shows the deformation pattern for Case 3 is large enough to mobilize
Method Factor of safety
Strength Reduction Factor
(FEM)
1.087
Bishop Method (LEM) 0.991
Back-calculation by Craig
(1997)
(Considering the presence of
tension crack)
the maximum shear strength and induce failure. The deformation pattern suggested that the failure is circular toward the toe of the slope.
2. The FOS based on SRT for Case 1, 2 and 3 are 2.063, 1.873 and 1.543 respectively. The FOS calculated for Case 3 with residual strength parameters is 1.087 which indicates that the slope is in the verge of failure.
3. The strength reduction factor (SRF) obtained from FE analysis shows a good agreement with deformation. SRF decreases as the deformation becomes larger. SRF decreases using residual strength as compared to the peak strength. For cut slope which has stiff-fissured clay and pre-existing slip surface the residual strength available when failure has occurred. Therefore the SRT cannot predict failure using peak strength parameters. 4. The FOS calculated from SRT and LEM are
1.087 and 0.991 respectively. There is 6% difference between two methods of analysis. The comparison calculated FOS results between Craig (1997) with Plaxis 7.2 and SLOPE/W are 4% and 6% respectively. This is due to the assumptions and limitations are used in the analysis.
Acknowledgment
The author would like to express gratitude to Associate Professor Dr. Nurly Gofar for comments and idea in completing this project and the project was funded personally by author.
References
Cheng, Y.M. (2003). Location of Critical Failure Surface and Further Studies on Slope Stability Analysis. Journal of Computers and Geotechnics. 30 : 255-267.
Cheng, Y.M., Lansivaara, T. & Wei, W.B. (2007). Two-dimensional Slope Stability Analysis by Limit Equilibrium Method and Strength Reduction Methods. Journal of Computers and Geotechnics. 34 : 137-150.
Craig, R.F. (1997). Soil Mechanic. 6th ed. Taylor & Francis Group.
Duan, Q.W., Wang, Y.J. & Zhang, P.W. (2008). Study on Deformation Parameter Reduction for the Strength Reduction Finite Element Method. London: Taylor & Francis Group.
Dunnicliff, J. (1988). GeotechnicalInstrumentation for Monitoring Field Performance. New York: John Wiley & Sons.
Lee, E.C. (2003). Report Writing: Talk on Slope Stability Analysis. Geo. Eng. Tech. Div., IEM. Pp 16.
Geo-slope (2002). Slope/W User’s Guide for Slope
Stability Analysis version 5.GEO-SLOPE International Ltd., Calgary, Alberta, Canada.
Griffiths, D.V. & Lane, P. A. (1999). Slope Stability Analysis by Finite Elements. Geotechnique. 49(3):387-403.
Jitno, H & Gofar,N. (2005). Stability and Deformation Analysis of Failed Embankments Founded on Soft Clays. Civil Engineering Journal. 17(1): 1-12.
Matsui, T. & San, K.C. (1992). Finite Element Slope Stability Analysis by Shear Strength Reduction Technique. Soils and Foundations. 32(1): 59-70.
Plaxis B-V. (2002). Plaxis: Finite Element Package for Analysis of Geotechnical Structures. Netherland.
Skempton, A.W. (1964). Long-term Stability of Clay Slopes. Geotechnique. 14(2): 77-102.