Designing Chain Sampling Plan Based On
Truncated Life Test For Log-Logistic
Distribution Using Minimum Angle Method
K.Tharani #1, A.R.Sudamani Ramaswamy #2
#1
Research Scholar, Department of Mathematics, Avinashilingam University, Coimbatore-641043(T.N),India #2
Professor, Department of Mathematics, Avinashilingam University, Coimbatore-641043(T.N),India
Abstract: In this paper a new approach of designing chain sampling plans for truncated life tests using minimum angle method, is proposed when the life time distribution follows Log-Logistic distribution. The test termination time and mean ratio time are specified. The acceptance number is also specified. The design parameter is obtained such that it satisfies both the producer’s risk and consumer’s risk simultaneously. The results are analyzed with the help of tables and examples.
Keywords: Consumer’s risk, Log-Logistic distribution, Minimum angle method, OC curve, Probability of
acceptance, Producer’s risk.
I. INTRODUCTION
Quality control has become one of the most important tools to differentiate between the competitive enterprises in a global business market. Two important tools for ensuring quality are the statistical quality control and acceptance sampling. The acceptance sampling plans are concerned with accepting or rejecting the submitted lots on the basis of quality of the products inspected in a sample taken from the lot. An acceptance sampling plan is a specified plan that establishes the minimum sample size to be used for testing. In most acceptance sampling plans for a truncated life test, major issue is to determine the sample size from the lot under consideration. Sampling inspection in which the criteria for acceptance and non acceptance of the lot depend in part on the results of the inspection of immediately preceding lots is adopted in Chain Sampling Plan.
The concept of Chain sampling inspection plans was proposed by Dodge [3], The ChSP – 1 plans are applicable for both smaller and larger samples. The Chain Sampling Plan (ChSP-1), making use of cumulative results of several sampling helps to overcome the shortcoming of the Single sampling plan. It avoids rejection of a lot on the basis of a single nonconforming unit and improves the poor discrimination between good and bad quality that occurs with the c = 0 plan. Chain sampling method is applied to cases where there is continuous production under the same essential conditions, and where the lots or batches of product to be sampled are offered for acceptance substantially in order of their production. Such situation may arise in receiving inspection of a continuing supply of purchased materials produced with in a manufacturing plan. Chain sampling is not suited to intermittent or job lot production, or to occasional purchases.
When large sampling is not practicable, and the use of c=0 plan is warranted, for example, when an extremely high quality is essential, the use of chain sampling plan is often recommended. Kantam et. al. [4] studies Log-logistic models. Sudamani Ramaswamy and Jayasri proposed Time Truncated Chain Sampling Plans for various distribution. The various distributions they considered are Generalized Exponential distribution [10], Marshall – Olkin Extened Exponential distribution [11], Log – Logistic distribution [12], Inverse Rayleigh distribution [13], Generalized Rayleigh distribution [14], Weibull distribution distribution [15]. Sudamani Ramaswamy and Jayasri [16], Time Truncated Modified Chain Sampling Plan for Selected Distributions. Sudamani Ramaswamy and Sutharani [9] planned a technique for designing chain sampling plan based on truncated life tests for various distribution using minimum angle method. The various distributions they considered are Rayleigh distribution, Generalized Exponential distribution, Weibull distribution and Gamma distribution.
The purpose of this study is to find the probability of acceptance for chain sampling plan using minimum angle method, assuming the experiment is truncated at pre-assigned time when the items follows Log-Logistic distribution. It is known that ChSP-1 is more efficient than the single sampling plan in forms of the sample size required. Further a ChSP-1 is expected to reduce the producers risk when specifying the consumers risk.
II. CONDITION FOR APPLICATION OF CHSP – 1
The cost of destructiveness of testing is such that a relatively small sample size is necessary, although other factors make a large sample desirable.
2) Normally lots are expected to be of essentially the same quality.
3) The consumer has faith in the integrity of the producer.
III. OPERATING PROCEDURE OF CHAIN SAMPLING PLAN FOR LIFE TESTS
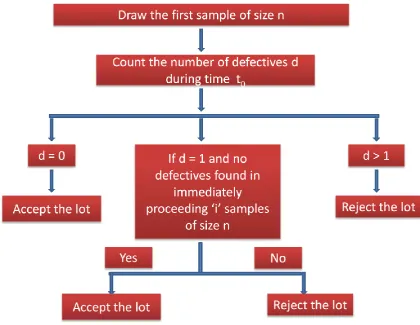
The plan is implemented in the following way :
1) For each lot, select a sample of n units and test each unit for conformance to the specified requirements during the time 𝑡0
2) Accept the lot if d (the observed number of defectives) is zero in the sample
of n unit, and reject if d >1.
3) Accept the lot if d is equal to 1 and if no defectives are found in the immediately preceding i samples of size n.
Thus a lot is accepted if no defects are found in its sample of n units. A lot is rejected if two or more defects are found in this sample. But if one defect is found the lot is still be accepted if the last defect found was far enough back in history as determined by the choice of i.
Dodge (1955), has given the operating characteristic function of ChSP-1 as
𝑃𝑎 𝑝 = 𝑃0+ 𝑃1(𝑃0)𝑖,
where 𝑃𝑎= the probability of acceptance,
𝑃0 = probability of finding no defects in a sample of n units from product of quality p.
𝑃1= probability of finding one defect in such a sample.
i = Number of preceding samples.
The Chain sampling plan is characterized by the parameters n and i. We are interested in designing the chain sampling plans based on truncated life tests under Log-logistic distribution using minimum angle
IV. FLOW – CHART
Figure 1: Operating procedure for Chain sampling plan for life tests
V. GLOSSARY OF SYMBOL
n - Sample size
d - Number of defectives
- Shape parameter c - Acceptance number
- Scale parameter, Mean life t - Termination time
- Producer’s risk
- Consumer’s risk P - Failure probability L(p) - Probability of acceptance
- Minimum angle
0 - Specified life
t/0 - Time termination ratio
VI. LOG – LOGISTIC DISTRIBUTION
Let us assume the shape parameter λ = 2, σ is the scale parameter. If another parameters are involved, then they are assumed to be known, as an example, if shape parameter of a distribution is unknown it is very difficult to design the acceptance sampling plan. In quality control analysis, the scale parameter is commonly referred to as the quality parameter or characteristics parameter. Therefore it is assumed that the distribution function depends on time only through the ratio t/σ.
Log-Logistic distribution has been studied so many times by different authors and areas. O’Quigely and Struthers [7] studied the Log-Logistic distribution in the case of survival analysis. Ragab and Green [18] and Ali and Khan [1] used the Log-Logistic distribution for the order statistics area. Balakrishnan and Malik [2] for the linear unbiased estimation of its parameters. Kantam et al. [5] studied An economic reliability test plan: log-logistic distribution.
VII. MINIMUM ANGLE METHOD
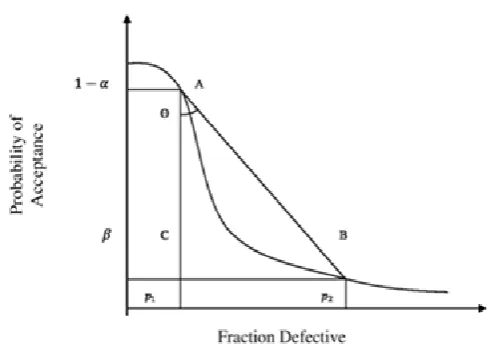
The practical performance of a sampling plan is discovered by it operating characteristic curve. Norman Bush et. al. [6], have used completely different techniques involving comparison of some portion of the OC curve to it of the best curve. The approach of minimum angle method by considering the tangent of the angle between the lines joining the points (AQL,1- α) and Limiting Quality Level (LQL, β) is shown in Fig.2 wherever 𝑝1= AQL, 𝑝2 = LQL. By using this method one will get a improved discriminating plan with the
minimum angle. Tangent of angle create by lines AB and AC is
tan θ= BC/AC
tan θ= (
P
2-𝑷𝟏)/(𝑷𝒂 (𝑷𝟏)-(𝑷𝒂(𝑷𝟐))The smaller the value of this tan θ, nearer that the angle θ approaching zero and also the chord AB approaching AC, the best condition through (AQL, 1-α ). This criterion minimizes at the same time the consumer’s and producer’s risks. So each producer and consumer favour the plans evolved by the criterion.
Figure 2: Minimum angle for given p1 and p2
t
t
t
F
VIII. OPERATING CHARACTERISTIC CURVE
OC curve is referred to two axis, the axis of p-Proportion nonconforming of the material offered for inspection and the axis of
P
a(
p
)
- probability of acceptance of a lot or process, is the locus of (p,P
a(
p
)
).
Figure 3 : OC curve of chain sampling plan when the life time of the items follows Log-Logistic distributions with (t/0=0.628)
IX. CONSTRUCTION OF TABLES
It is assumed that the lot size is large enough to use the binomial distribution to find the probability of lot acceptance. According to Dodge (1955), the probability of acceptance 𝑃𝑎 𝑝 for the Chain sampling plan is
calculated using the following Equation
𝑃𝑎 𝑝 =(1 − 𝑝)𝑛 + 𝑛𝑝(1 − 𝑝)𝑛−1(1 − 𝑝)𝑛𝑖
Where p is the failure probability.
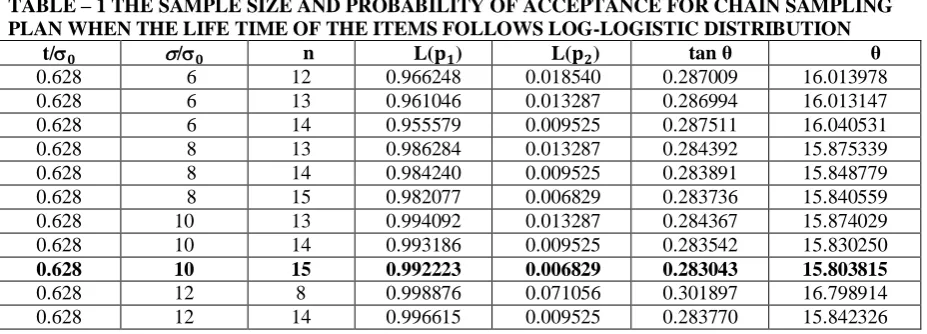
The Tables are constructed using OC function for Chain sampling plans under Log-Logistic distributions. The test termination ratio t/0 values are fixed as 0.628, 0.912, 1.257, 1.571, 2.356, 3.141,3.927
and 4.712, and the mean ratio 𝜎/0 values are fixed as 4,6,8,10,12. For various time ratios t/0 and mean ratios
σ/0, the parameter values n satisfying L(
p
1) ≥ 0.95 and L(p
2) ≤ 0.10 are determined for Log-Logisticdistribution and are provided in Table 1. The values of θ , tan θ are also provided in Table 1. The parameters can be selected corresponding to the minimum value of θ.
TABLE – 1 THE SAMPLE SIZE AND PROBABILITY OF ACCEPTANCE FOR CHAIN SAMPLING PLAN WHEN THE LIFE TIME OF THE ITEMS FOLLOWS LOG-LOGISTIC DISTRIBUTION
t/𝟎 /𝟎 n L(𝐩𝟏) L(𝐩𝟐) tan θ θ
0.628 6 12 0.966248 0.018540 0.287009 16.013978
0.628 6 13 0.961046 0.013287 0.286994 16.013147
0.628 6 14 0.955579 0.009525 0.287511 16.040531
0.628 8 13 0.986284 0.013287 0.284392 15.875339
0.628 8 14 0.984240 0.009525 0.283891 15.848779
0.628 8 15 0.982077 0.006829 0.283736 15.840559
0.628 10 13 0.994092 0.013287 0.284367 15.874029
0.628 10 14 0.993186 0.009525 0.283542 15.830250
0.628 10 15 0.992223 0.006829 0.283043 15.803815
0.628 12 8 0.998876 0.071056 0.301897 16.798914
0.628 12 14 0.996615 0.009525 0.283770 15.842326
0.94 0.95 0.96 0.97 0.98 0.99 1
6 8 10 12
Log-Logistic distribution
Lot Percent Defective
P rob abi lit y o f A cc e pt anc e o f
Lot Percent Defective
0.628 12 15 0.996129 0.006829 0.283136 15.808719
0.942 6 4 0.980806 0.080547 0.495529 26.359736
0.942 6 5 0.970904 0.042079 0.480289 25.654473
0.942 6 6 0.959482 0.022182 0.475946 25.451941
0.942 8 7 0.980795 0.011732 0.471059 25.223179
0.942 8 8 0.975398 0.006213 0.470999 25.220384
0.942 8 9 0.969483 0.003291 0.472458 25.288763
0.942 10 7 0.991629 0.011732 0.470830 25.212463
0.942 10 8 0.989190 0.006213 0.469355 25.143230
0.942 10 9 0.986483 0.003291 0.469252 25.138419
0.942 12 9 0.993194 0.003291 0.468769 25.115733
0.942 12 10 0.991666 0.001744 0.468760 25.115301
0.942 12 11 0.990002 0.000924 0.469160 25.134092
1.257 6 3 0.968547 0.059162 0.627199 32.095880
1.257 8 3 0.988916 0.059162 0.632766 32.324253
1.257 8 4 0.980751 0.022640 0.614039 31.551549
1.257 8 5 0.970821 0.008752 0.611512 31.446299
1.257 10 5 0.987056 0.008752 0.610093 31.387055
1.257 10 6 0.981721 0.003391 0.610076 31.386368
1.257 10 7 0.975646 0.001314 0.612579 31.490780
1.257 12 5 0.993477 0.008752 0.610889 31.420288
1.257 12 6 0.990715 0.003391 0.609280 31.353116
1.257 12 7 0.987532 0.001314 0.609963 31.381658
1.571 8 2 0.988578 0.085981 0.747312 36.771209
1.571 8 3 0.974991 0.024076 0.709340 35.349598
1.571 8 4 0.957502 0.006916 0.709585 35.358945
1.571 10 4 0.980762 0.006916 0.706033 35.223345
1.571 12 4 0.990193 0.006916 0.706620 35.245780
2.356 12 3 0.975010 0.003558 0.834040 39.829451
X. EXAMPLE
Suppose one want to design Chain sampling plan under Log-Logistic distribution. The specified values are t/0
= 0.628,
/
0 = 10,i = 2. One can observe that from the Table 1, among the various values of
theMinimum angle is
= 15.803815 and also
= 0.007777,
= 0.0068 it corresponds to n=15. It is very much less than the specified risk. Thus, the desired sampling plan has parameters (15, 2).XI. CONCLUSION
In this paper, designing chain sampling plan based on truncated life test for Log-Logistic distribution using minimum angle method is presented. The minimum sample size for various values of
/
0 and different experiment times are calculated using Log-Logistic distribution. By applying minimum angle method there is a reduction in the sample size and minimizes simultaneously the consumer’s risk and producer’s risk. The minimum angle method provides better differentiation of accepting good lots.REFERENCE
[1] Ali M. M. and Khan A. H., (1987), “On Order Statistics from the Log-Logistic Distribution,” J. Stat. Plan. Inference, vol. 17, pp.
103-108.
[2] Balakrishnan, N. and Malik, H.J., (1987), Best linear unbiased estimation of location and scale parameter of log-logistic
distribution, Communication Statist. Theory and Methods, 16, 3477-3495.
[3] Dodge H. F.,(1955), “Chain Sampling Inspection Plans, Industrial Quality Control”,Vol. 11(4), 10-13.
[4] Kantam, R.R. L., Rosaiah, K. and Srinivasa Rao, G., (2001): Acceptance sampling based on life tests: Log-logistic models.
Journal of Applied Statistics 28, 121-128.
[5] Kantam, R.R.L. and Srinivasa Rao, G. and Sriram, G., (2006). An economic reliability test plan: log-logistic distribution. J. App.
[6] Norman Bush N. Leonard E.J., and Merchant M.Q.M.Jr., (1953), “ A Method of Single and Double Sampling OC curves Utilizing the Tangent of the Point of the Inflexion”.
[7] O’Quigley J. and Struthers L., (1982), “Survival Model based upon the Logistic and Log-Logistic Distribution,” Computer
Programs in Biomedicine, vol. 15, pp. 3-12.
[8] Shah, B.K. and Dave, P.H., (1963). A note on log-logistic distribution, J. Math. Sciences University Baroda (Science number) 12,
21-22.
[9] Sudamani Ramaswamy A.R & Sutharani S(2013), “Designing Chain SamplingPlan Based on Truncated Life Tests under various
Distribution using Minimum Angle Method”, SOP Transactions on Applied Mathematics, volume1, Number 1 page 21-29.
[10] Sudamani Ramaswamy A.R and Jayasri S (2012), “Time Truncated Chain Sampling Plans for Generalized Exponential
Distribution”, International Journal of Computational Engineering Research,volume 2,issue 5,PP:1402-1407
[11] Sudamani Ramaswamy A.R and Jayasri S (2013), “Time Truncated chain sampling plans for Marshal-Olkin extended exponential
distributions”, International organization of scientific research,volume 5, issue 1, PP:01-05.
[12] Sudamani Ramaswamy A.R and Jayasri S (2013), “ Time Truncated Chain Sampling Plans for Log - Logistic Distribution”
International Journal of Engineering Research and Development ,Volume 7, Issue 4, PP. 09 -13
[13] Sudamani Ramaswamy A.R and Jayasri S (2014), “Time Truncated Chain Sampling Plans for Inverse Rayleigh Distribution”,
International Journal of Engineering Inventions, Volume 3, Issue 6, PP: 41-45
[14] Sudamani Ramaswamy A.R and Jayasri S (2014) , “Time Truncated Chain Sampling Plans for Generalized Rayleigh
Distribution,” International Refereed Journal of Engineering and Science, vol. 3, no. 2, pp. 49-53.
[15] Sudamani Ramaswamy A.R and Jayasri S (2015) , “Time Truncated Chain Sampling Plan for Weibull Distribution,” Int. J. Eng.
Res. Gen. Sci., vol. 3, no. 2, pp. 59-67.
[16] Sudamani Ramaswamy A.R and Jayasri S (2015), “Time Truncated Modified Chain Sampling Plan for Selected Distributions”,
International Journal of Research in Engineering and Science (IJRES),Volume 3, Issue 3 , PP.01-18
[17] Tadikamalla, P. R. and Johnson, N.L. (1982). Systems of frequency curves generated by the transformation of logistic variables.
Biometrika, 69, 461-465.
[18] Ragab, A. and Green, J. (1984). On order statistics from the log-logistic distribution and their properties, Commu. Statist. Theory