A Monthly Double-Blind Peer Reviewed (Refereed/Juried) Open Access International e-Journal - Included in the International Serial Directories
Indexed & Listed at:
VOLUME NO.5(2015),ISSUE NO.03(MARCH) ISSN 2231-5756
INTERNATIONAL JOURNAL OF RESEARCH IN COMMERCE, IT & MANAGEMENT
CONTENTS
Sr.
No.
TITLE & NAME OF THE AUTHOR (S)
Page
No.
1
.
CHALLENGES OF INFORMATION & COMMUNICATION TECHNOLOGY (ICT) AS A TEACHING AND LEARNING
TOOL IN THE EDUCATION SECTOR IN ZAMBIA: A CASE STUDY OF SELECTED SECONDARY SCHOOLS OF
MONGU DISTRICT
DR. B. NGWENYA & J. KAUNDA
1
2
.
TO MEASURE SIGNIFICANT DIFFERENCE IN FINANCIAL PERFORMANCE OF SELECTED FERTILIZER
COMPANIES IN INDIA BASED ON PROFITABILITY RATIOS
ANKIT D. PATEL
4
3
.
A STUDY ON DEMOGRAPHIC PROFILE AND PROBLEMS FACED BY THE POWERLOOM OWNERS WITH
SPECIAL REFERENCES TO COIMBATORE CLUSTER
DR. S. SARAVANAN & K. A. RAMYA
8
4
.
ANALYTICAL STUDY OF DIRECT TAX CODE TO BE INTRODUCED IN INDIAN ECONOMY
DR. MAHESH BHIWANDIKAR
13
5
.
NEED OF ICT FOR DIRECT RELATION BETWEEN FARMER AND CONSUMER
DR. MANOJKUMAR JYOTIRAM GAIKWAD & PRAKASHKAILASHCHANDRAVYAS
16
6
.
FINANCIAL ANALYSIS OF COMMERCIAL BANKS: A COMPARATIVE STUDY
DR. ATIYA MAHBOOB
19
7
.
EFFICIENCY OF COMMODITY FUTURES IN PRICE DISCOVERY: AN EMPIRICAL STUDY OF AGRICULTURAL
COMMODITIES
SIDDULA NARSIMHULU & DR. S. V. SATYANARAYANA
22
8
.
NON PERFORMING ASSETS MANAGEMENT IN HDFC BANK
S. R. PRASAD
29
9
.
COMMERCIALISATION OF FOREST RESOURCES: AN EMERGING ISSUE IN ARUNACHAL PRADESH
DR. TASI KAYE
33
10
.
AN ANALYSIS OF FACTORS AFFECTING ONLINE CONSUMER BUYING BEHAVIOR IN INDIA
PRACHI GOYAL & DR. BHUMIJA CHOUHAN
38
11
.
EVOLUTION OF INDIA’S TELECOMMUNICATIONS INDUSTRY
GAUTAM KUMAR JHA
46
12
.
STUDENT AWARENESS OF EDUCATION LOANS AS A SOURCE OF FINANCING – A STUDY OF BELGAUM CITY,
KARNATAKA
SONAL REVANKAR
55
13
.
EFFECT OF CAPITAL STRUCTURE ON PROFITABILITY OF LISTED MANUFACTURING COMPANIES IN SRI
LANKA
ANANDASAYANAN S & SUBRAMANIAM V. A.
57
14
.
AN EVALUATION OF THE ECONOMIC AND FINANCIAL CAPACITY OF INDIGENOUS UNDERWRITING FIRMS
FOR MARINE RISKS AND INVESTMENT COVER IN NIGERIA
NWOKORO, IGNATIUS A. & NWOKEDI, THEOPHILUS C.
61
15
.
HOUSEHOLD SAVING BEHAVIOR IN JIMMA ZONE OF OROMIA REGION, ETHIOPIA
TADELE MENGESHA
65
16
.
AN EMPIRICAL ANALYSIS OF FACTORS AFFECTING WLB OF EMPLOYEES IN SERVICE SECTOR
ANJU CHAWLA
77
17
.
PROSPECT AND POTENTIAL OF RURAL TOURISM IN BODHGAYA
AJIT KUMAR SINGH
81
18
.
VERTICAL PRICE TRANSMISSION BETWEEN CEREALS AND BREAD AND OTHER PREPARED FOODS: DOES
PRICE STABILITY IN CEREALS MARKET STABILIZES PRICE OF BREAD AND OTHER PREPARED FOODS?
YONAS ABERA MAMO, HABTAMU REGASSA LEMMA & YOHANNES MENGESHA
83
19
.
SERVICE MARKETING INNOVATION: A PARADIGM SHIFT (A CASE STUDY OF INDIAN BANKING SYSTEM)
AHMAD AZHAR
91
20
.
A CASE STUDY OF SAHARA INDIA PARIWAR SCANDAL (WITH REFERENCE TO ETHICAL AND GOVERNANCE
ISSUES INVOLVED)
NANCY RAO
100
CHIEF PATRON
PROF. K. K. AGGARWAL
Chairman, Malaviya National Institute of Technology, Jaipur
(An institute of National Importance & fully funded by Ministry of Human Resource Development, Government of India)
Chancellor, K. R. Mangalam University, Gurgaon
Chancellor, Lingaya’s University, Faridabad
Founder Vice-Chancellor (1998-2008), Guru Gobind Singh Indraprastha University, Delhi
Ex. Pro Vice-Chancellor, Guru Jambheshwar University, Hisar
FOUNDER PATRON
LATE SH. RAM BHAJAN AGGARWAL
Former State Minister for Home & Tourism, Government of Haryana
Former Vice-President, Dadri Education Society, Charkhi Dadri
Former President, Chinar Syntex Ltd. (Textile Mills), Bhiwani
CO-ORDINATOR
AMITA
Faculty, Government M. S., Mohali
ADVISORS
DR. PRIYA RANJAN TRIVEDI
Chancellor, The Global Open University, Nagaland
PROF. M. S. SENAM RAJU
Director A. C. D., School of Management Studies, I.G.N.O.U., New Delhi
PROF. M. N. SHARMA
Chairman, M.B.A., Haryana College of Technology & Management, Kaithal
PROF. S. L. MAHANDRU
Principal (Retd.), Maharaja Agrasen College, Jagadhri
EDITOR
PROF. R. K. SHARMA
Professor, Bharti Vidyapeeth University Institute of Management & Research, New Delhi
CO-EDITOR
DR. BHAVET
Faculty, Shree Ram Institute of Business & Management, Urjani
EDITORIAL ADVISORY BOARD
DR. RAJESH MODI
Faculty, Yanbu Industrial College, Kingdom of Saudi Arabia
PROF. SANJIV MITTAL
University School of Management Studies, Guru Gobind Singh I. P. University, Delhi
PROF. ANIL K. SAINI
VOLUME NO.5(2015),ISSUE NO.03(MARCH) ISSN 2231-5756
INTERNATIONAL JOURNAL OF RESEARCH IN COMMERCE, IT & MANAGEMENT
DR. SAMBHAVNA
Faculty, I.I.T.M., Delhi
DR. MOHENDER KUMAR GUPTA
Associate Professor, P. J. L. N. Government College, Faridabad
DR. SHIVAKUMAR DEENE
Asst. Professor, Dept. of Commerce, School of Business Studies, Central University of Karnataka, Gulbarga
ASSOCIATE EDITORS
PROF. NAWAB ALI KHAN
Department of Commerce, Aligarh Muslim University, Aligarh, U.P.
PROF. ABHAY BANSAL
Head, Department of Information Technology, Amity School of Engineering & Technology, Amity
University, Noida
PROF. A. SURYANARAYANA
Department of Business Management, Osmania University, Hyderabad
DR. SAMBHAV GARG
Faculty, Shree Ram Institute of Business & Management, Urjani
PROF. V. SELVAM
SSL, VIT University, Vellore
DR. PARDEEP AHLAWAT
Associate Professor, Institute of Management Studies & Research, Maharshi Dayanand University, Rohtak
DR. S. TABASSUM SULTANA
Associate Professor, Department of Business Management, Matrusri Institute of P.G. Studies, Hyderabad
SURJEET SINGH
Asst. Professor, Department of Computer Science, G. M. N. (P.G.) College, Ambala Cantt.
TECHNICAL ADVISOR
AMITA
Faculty, Government M. S., Mohali
FINANCIAL ADVISORS
DICKIN GOYAL
Advocate & Tax Adviser, Panchkula
NEENA
Investment Consultant, Chambaghat, Solan, Himachal Pradesh
LEGAL ADVISORS
JITENDER S. CHAHAL
Advocate, Punjab & Haryana High Court, Chandigarh U.T.
CHANDER BHUSHAN SHARMA
Advocate & Consultant, District Courts, Yamunanagar at Jagadhri
SUPERINTENDENT
CALL FOR MANUSCRIPTS
We invite unpublished novel, original, empirical and high quality research work pertaining to recent developments & practices in the areas of Computer Science & Applications; Commerce; Business; Finance; Marketing; Human Resource Management; General Management; Banking; Economics; Tourism Administration & Management; Education; Law; Library & Information Science; Defence & Strategic Studies; Electronic Science; Corporate Governance; Industrial Relations; and emerging paradigms in allied subjects like Accounting; Accounting Information Systems; Accounting Theory & Practice; Auditing; Behavioral Accounting; Behavioral Economics; Corporate Finance; Cost Accounting; Econometrics; Economic Development; Economic History; Financial Institutions & Markets; Financial Services; Fiscal Policy; Government & Non Profit Accounting; Industrial Organization; International Economics & Trade; International Finance; Macro Economics; Micro Economics; Rural Economics; Co-operation; Demography: Development Planning; Development Studies; Applied Economics; Development Economics; Business Economics; Monetary Policy; Public Policy Economics; Real Estate; Regional Economics; Political Science; Continuing Education; Labour Welfare; Philosophy; Psychology; Sociology; Tax Accounting; Advertising & Promotion Management; Management Information Systems (MIS); Business Law; Public Responsibility & Ethics; Communication; Direct Marketing; E-Commerce; Global Business; Health Care Administration; Labour Relations & Human Resource Management; Marketing Research; Marketing Theory & Applications; Non-Profit Organizations; Office Administration/Management; Operations Research/Statistics; Organizational Behavior & Theory; Organizational Development; Production/Operations; International Relations; Human Rights & Duties; Public Administration; Population Studies; Purchasing/Materials Management; Retailing; Sales/Selling; Services; Small Business Entrepreneurship; Strategic Management Policy; Technology/Innovation; Tourism & Hospitality; Transportation Distribution; Algorithms; Artificial Intelligence; Compilers & Translation; Computer Aided Design (CAD); Computer Aided Manufacturing; Computer Graphics; Computer Organization & Architecture; Database Structures & Systems; Discrete Structures; Internet; Management Information Systems; Modeling & Simulation; Neural Systems/Neural Networks; Numerical Analysis/Scientific Computing; Object Oriented Programming; Operating Systems; Programming Languages; Robotics; Symbolic & Formal Logic; Web Design and emerging paradigms in allied subjects.
Anybody can submit the soft copy of unpublished novel; original; empirical and high quality research work/manuscriptanytime in M.S. Word format
after preparing the same as per our GUIDELINES FOR SUBMISSION; at our email address i.e. infoijrcm@gmail.com or online by clicking the link online submission as given on our website (FOR ONLINE SUBMISSION, CLICK HERE).
GUIDELINES FOR SUBMISSION OF MANUSCRIPT
1. COVERING LETTER FOR SUBMISSION:
DATED: _____________
THE EDITOR
IJRCM
Subject: SUBMISSION OF MANUSCRIPT IN THE AREA OF.
(e.g. Finance/Marketing/HRM/General Management/Economics/Psychology/Law/Computer/IT/Engineering/Mathematics/other, please specify)
DEAR SIR/MADAM
Please find my submission of manuscript entitled ‘___________________________________________’ for possible publication in your journals.
I hereby affirm that the contents of this manuscript are original. Furthermore, it has neither been published elsewhere in any language fully or partly, nor is it under review for publication elsewhere.
I affirm that all the author (s) have seen and agreed to the submitted version of the manuscript and their inclusion of name (s) as co-author (s).
Also, if my/our manuscript is accepted, I/We agree to comply with the formalities as given on the website of the journal & you are free to publish our contribution in any of your journals.
NAME OF CORRESPONDING AUTHOR:
Designation:
Affiliation with full address, contact numbers & Pin Code: Residential address with Pin Code:
Mobile Number (s): Landline Number (s): E-mail Address: Alternate E-mail Address:
NOTES:
a) The whole manuscript is required to be in ONE MS WORD FILE only (pdf. version is liable to be rejected without any consideration), which will start from
the covering letter, inside the manuscript.
b) The sender is required to mentionthe following in the SUBJECT COLUMN of the mail:
New Manuscript for Review in the area of (Finance/Marketing/HRM/General Management/Economics/Psychology/Law/Computer/IT/
Engineering/Mathematics/other, please specify)
c) There is no need to give any text in the body of mail, except the cases where the author wishes to give any specific message w.r.t. to the manuscript. d) The total size of the file containing the manuscript is required to be below 500 KB.
e) Abstract alone will not be considered for review, and the author is required to submit the complete manuscript in the first instance.
f) The journal gives acknowledgement w.r.t. the receipt of every email and in case of non-receipt of acknowledgment from the journal, w.r.t. the submission
of manuscript, within two days of submission, the corresponding author is required to demand for the same by sending separate mail to the journal.
2. MANUSCRIPT TITLE: The title of the paper should be in a 12 point Calibri Font. It should be bold typed, centered and fully capitalised.
3. AUTHOR NAME (S) & AFFILIATIONS: The author (s) full name, designation, affiliation (s), address, mobile/landline numbers, and email/alternate email address should be in italic & 11-point Calibri Font. It must be centered underneath the title.
4. ABSTRACT: Abstract should be in fully italicized text, not exceeding 250 words. The abstract must be informative and explain the background, aims, methods,
VOLUME NO.5(2015),ISSUE NO.03(MARCH) ISSN 2231-5756
INTERNATIONAL JOURNAL OF RESEARCH IN COMMERCE, IT & MANAGEMENT
5. KEYWORDS: Abstract must be followed by a list of keywords, subject to the maximum of five. These should be arranged in alphabetic order separated by commas and full stops at the end.
6. MANUSCRIPT: Manuscript must be in BRITISH ENGLISH prepared on a standard A4 size PORTRAIT SETTING PAPER. It must be prepared on a single space and
single column with 1” margin set for top, bottom, left and right. It should be typed in 8 point Calibri Font with page numbers at the bottom and centre of every page. It should be free from grammatical, spelling and punctuation errors and must be thoroughly edited.
7. HEADINGS: All the headings should be in a 10 point Calibri Font. These must be bold-faced, aligned left and fully capitalised. Leave a blank line before each
heading.
8. SUB-HEADINGS: All the sub-headings should be in a 8 point Calibri Font. These must be bold-faced, aligned left and fully capitalised.
9. MAIN TEXT: The main text should follow the following sequence:
INTRODUCTION REVIEW OF LITERATURE
NEED/IMPORTANCE OF THE STUDY STATEMENT OF THE PROBLEM OBJECTIVES
HYPOTHESES
RESEARCH METHODOLOGY RESULTS & DISCUSSION FINDINGS
RECOMMENDATIONS/SUGGESTIONS CONCLUSIONS
SCOPE FOR FURTHER RESEARCH ACKNOWLEDGMENTS REFERENCES APPENDIX/ANNEXURE
It should be in a 8 point Calibri Font, single spaced and justified. The manuscript should preferably not exceed 5000 WORDS.
10. FIGURES &TABLES: These should be simple, crystal clear, centered, separately numbered & self explained, and titles must be above the table/figure. Sources of data should be mentioned below the table/figure. It should be ensured that the tables/figures are referred to from the main text.
11. EQUATIONS:These should be consecutively numbered in parentheses, horizontally centered with equation number placed at the right.
12. REFERENCES: The list of all references should be alphabetically arranged. The author (s) should mention only the actually utilised references in the preparation
of manuscript and they are supposed to follow Harvard Style of Referencing. The author (s) are supposed to follow the references as per the following:
•
All works cited in the text (including sources for tables and figures) should be listed alphabetically.•
Use (ed.) for one editor, and (ed.s) for multiple editors.•
When listing two or more works by one author, use --- (20xx), such as after Kohl (1997), use --- (2001), etc, in chronologically ascending order.•
Indicate (opening and closing) page numbers for articles in journals and for chapters in books.•
The title of books and journals should be in italics. Double quotation marks are used for titles of journal articles, book chapters, dissertations, reports, workingpapers, unpublished material, etc.
•
For titles in a language other than English, provide an English translation in parentheses.•
The location of endnotes within the text should be indicated by superscript numbers.PLEASE USE THE FOLLOWING FOR STYLE AND PUNCTUATION IN REFERENCES: BOOKS
•
Bowersox, Donald J., Closs, David J., (1996), "Logistical Management." Tata McGraw, Hill, New Delhi.•
Hunker, H.L. and A.J. Wright (1963), "Factors of Industrial Location in Ohio" Ohio State University, Nigeria.CONTRIBUTIONS TO BOOKS
•
Sharma T., Kwatra, G. (2008) Effectiveness of Social Advertising: A Study of Selected Campaigns, Corporate Social Responsibility, Edited by David Crowther &Nicholas Capaldi, Ashgate Research Companion to Corporate Social Responsibility, Chapter 15, pp 287-303.
JOURNAL AND OTHER ARTICLES
•
Schemenner, R.W., Huber, J.C. and Cook, R.L. (1987), "Geographic Differences and the Location of New Manufacturing Facilities," Journal of Urban Economics,Vol. 21, No. 1, pp. 83-104.
CONFERENCE PAPERS
•
Garg, Sambhav (2011): "Business Ethics" Paper presented at the Annual International Conference for the All India Management Association, New Delhi, India,19–22 June.
UNPUBLISHED DISSERTATIONS AND THESES
•
Kumar S. (2011): "Customer Value: A Comparative Study of Rural and Urban Customers," Thesis, Kurukshetra University, Kurukshetra.ONLINE RESOURCES
•
Always indicate the date that the source was accessed, as online resources are frequently updated or removed.WEBSITES
EFFICIENCY OF COMMODITY FUTURES IN PRICE DISCOVERY: AN EMPIRICAL STUDY OF AGRICULTURAL
COMMODITIES
SIDDULA NARSIMHULU
RESEARCH FELLOW
INSTITUTE OF PUBLIC ENTERPRISE
OSMANIA UNIVERSITY
HYDERABAD
DR. S. V. SATYANARAYANA
PROFESSOR
DEPARTMENT OF COMMERCE
OSMANIA UNIVERSITY
HYDERABAD
ABSTRACT
The main aim of the present study is to find out whether commodity futures market is efficient in price discovery for agricultural commodities in India. The daily closing price information of spot and futures markets, for a period of 10 years (2004 – 2013), for three agricultural commodities viz., Chana, Chilli and Turmeric which are traded in National Commodity & Derivatives Exchange Ltd (NCDEX), is taken for the study. The present study examines price discovery function in spot-futures agricultural commodity market in India by using VAR model, Johansen test of Co-integration, VECM, OLS method, and Granger Causality tests. The cointegration results reveal that there is a long-run association between commodity spot and futures prices of Chana, Chilli and Turmeric. The VECM results show that there is a long–run causality running from futures prices to spot prices of near month contracts of Chana, Chilli and Turmeric. The speed of adjustment towards equilibrium is lower in the sample agricultural commodities. The granger causality test results disclose that there is only a unidirectional causality from futures returns to spot returns of Chilli and Turmeric. In case of Chana, bidirectional causality from futures to spot returns is observed. So, it is revealed that the near month futures contracts are suitable for hedging.
JEL CLASSIFICATION
C22, C32, G14, O13, Q13.
KEYWORDS
Commodity Futures, Price Discovery, Price Risk Management, Price Volatility.
1.
INTRODUCTION
n the wake of globalization and surge in global uncertainties, the prices in commodity markets have been showing wide fluctuations. Commodity price volatility is the most critical issue faced by the producers of primary commodities. Fluctuating commodity prices pose a continuous financial risk for businesses. Derivatives products serve the vitally important economic functions of price discovery and risk management. The transparency, which emerges from their trading mechanism, ensures the price discovery in the underlying market. Further, they serve as risk management tools by facilitating the trading of risks among the market participants.
Price discovery and risk transfer are considered to be two major contributions of futures market towards the organization of economic activity (Garbade & Silber, 1983). Price discovery hinges on whether new information in the market is reflected first in the changes in futures prices or changes in spot prices (Hoffman, 1932). Through price discovery function, futures market establishes a competitive reference (future) price from which spot price can be derived. This implies that futures price serves as market’s expectations of subsequent spot price. In other words, price discovery is the process by which markets incorporate this information to arrive at equilibrium (Working, 1948). In a static sense, price discovery implies the existence of equilibrium price and in a dynamic sense, the price discovery process describes how information is produced and transmitted across the markets. Futures prices serve as the market expectations of subsequent spot prices and can be used by exporters, producers including farmers for optimal decision making and resource allocation.
In efficient markets, new information is impounded simultaneously into cash and futures markets (Zhong et al. 2004). In other words, financial market pricing theory states that market efficiency is a function of how fast and how much information is reflected in prices. The rate at which prices exhibits market information is the rate at which this information is disseminated to market participants (Zapata et al. 2005). In reality, institutional factors such as liquidity, transaction costs, and other market restrictions may produce an empirical lead-lag relationship between price changes in the two markets. The market that provides the greater liquidity and low trading cost as advocated by Fleming, Ostdiek and Whaley (1996) is likely to play a more important role in price discovery.
2.
REVIEW OF LITERATURE
Pindyck and Robert S (2001) have provided an explanation of short-run commodity price movements that is based on “fundamentals,” i.e., rational shifts in supply and demand in each of two markets. It also explained how prices, rates of production, and inventory levels are interrelated, and are determined via equilibrium in two interconnected markets.
Susan Thomas (2003) has shown some evidence on the role played by the nascent futures markets in price discovery. They offered three policy proposals: using reference rates for strengthening transparency, exploring a greater role for cash settlement, and treating warehouse receipts as securities.
YangJianet et al. (2005) have examined the lead-lag relationship between futures trading activity (volume and open interest) and cash price volatility of major agricultural commodities. Granger causality tests and generalized forecast error variance decompositions method have shown that an unexpected increase in futures trading volume unidirectionally causes an increase in cash price volatility for most commodities. Further, they found a weak causal feedback between open interest and cash price volatility.
S.M. Lokare (2007) has examined the efficacy and performance of commodity derivatives in steering the price risk management. He found that almost all the commodities throw an evidence of co-integration in both spot and future prices, presaging that these markets are marching in the right direction of achieving improved operational efficiency, albeit, at a slower pace. He also found that hedging proves to be an effective proposition in respect of some commodities, while the others entail moderate or considerably higher risk.
R. Salvadi Easwaran and P. Ramasundaram (2008) have made an investigation into the futures markets in agricultural commodities in India. Bartlett’s homogeneity of variance test was used to test the integration between spot and futures markets. The test results of price discovery have indicated that price
VOLUME NO.5(2015),ISSUE NO.03(MARCH) ISSN 2231-5756
INTERNATIONAL JOURNAL OF RESEARCH IN COMMERCE, IT & MANAGEMENT
discovery does not occur in agricultural commodity futures market. The econometric analysis of the relationship between price return, volume, market depth and volatility has shown that the market volume and depth are not significantly influenced by the return and volatility of futures as well as spot markets. Nath and Lingareddy (2008) the authors have tried to explore the effect of futures trading on spot prices of pulses by using correlations, regression analysis and the Granger causality test. Their study found that volatility in urad as well as pulses prices was higher during the period of futures trading than in the period prior to its introduction as well as after the ban of futures contract.
Mantu Kumar Mahalik et al. (2009) have examined price discovery and volatility spillovers in Indian spot-futures commodity markets by using cointegration (Johansen, 1991), VECM and the bivariate EGARCH (Nelson, 1991) model. This study has used four futures and spot indices of Multi-Commodity Exchange (MCX). VECM shows that commodity futures markets effectively serve the price discovery function in the spot market implying that there is a flow of information from future to spot commodity markets. Besides the bivariate GARCH model indicates that the volatility spillovers from future to the spot market are dominant in the case of ENERGY and COMDEX index while AGRISP acts as a source of volatility towards the agri-futures market.
Mallikarjunappa T and Afsal E M (2010) had made an attempt to determine the lead-lag relationship between spot and futures markets in the Indian context by using high frequency price data of twelve individual stocks, observed at one-minute interval. The study applied the concept of co-integration and establishes the spot-futures relationship using Vector Error Correction Mechanism (VECM) represented by EGARCH framework. They found no significant leading or lagging effects in either spot or futures markets with respect to top twelve individual stocks. There exists a contemporaneous and bi-directional lead-lag relationship between the spot and the futures markets.
Mukherjee Kedar Nath (2011) has made an attempt to re-validate the impact of futures trading on agricultural commodity market in India. The statistical techniques used are multiple regression model, VAR model and GARCH model. The analysis showed that the price volatility for most of the selected agricultural commodities was higher in pre- futures period and gets significantly reduced after getting listed in futures. The empirical findings have significantly shown that comparative advantage of futures market in disseminating information, leading to a significant price discovery and risk management.
Kumar Brajesh and Pandey Ajay (2011) have investigated the effectiveness of the price discovery function of commodity futures markets in India. It can be concluded that in the Indian commodity futures markets, futures markets do not dominate the price discovery process as they do in other developed markets. For the precious metals and energy commodities, the futures markets lead the price discovery role. In the case of agricultural commodities and industrial metals, the price discovery takes place in both spot and futures markets. For the precious metals and energy commodities, which are more tradable in nature, futures markets are not affected by spot markets.
Sehgal Sanjay et al. (2012) have empirically examined the effect of futures trading activity (trading volume; proxy of futures liquidity) on spot price volatility for seven agricultural commodities (guar seeds, turmeric, soya bean, black pepper, barley, Maize and Castor Seed). They found that unexpected futures trading volume is Granger causing spot price volatility and are significant for five out of seven agricultural commodities (Guar seed, Turmeric, Soybean, Maize and Castor Seed).It has been found reversed effect for one commodity i.e. Pepper the effect of spot volatility on futures trading and for Barley no causality is revealed either from future to spot or Vice-Versa.
Chauhan Ajay Kumar et al. (2013) have made an effort to analyze the market efficiency of the Indian commodity market and volatility spillover effects between the spot and future market with reference to agri-commodities guar seed and chana. The results indicated that the commodity futures markets effectively serves the price discovery function in the spot market implying that there is a flow of information from future to spot commodity markets. The results also indicated that the volatility spillovers from future to the spot market are dominant. However in Agri-commodities the volatility in spot market may influences volatility in future market.
3.
NEED FOR AND IMPORTANCE OF THE STUDY
Indian markets have been increasingly integrating with global markets in commodities. This opens a window of opportunity to Indian companies but at the same time exposes them to a whole new world of risks. Among these risks, the most important one is commodity price volatility. Companies need to be able to manage these risks if they are to be globally competitive, and this is where an efficient commodity futures market plays a vital role not only in facilitating price/volatility risk mitigation but also catalyzing near-perfect price discovery. Therefore, the price volatility drives the demand for hedging the risk in the commodity market. The need for commodity derivatives is multifarious in a growing economy like India. Since India is one of the largest producer of agricultural commodities, time is ripe for India to take a dominant role in price leadership at international level. In this backdrop, it is important to empirically examine the price discovery mechanism of select agricultural/primary commodities.
4.
RESEARCH GAP
Though commodity markets in emerging economies like India have been growing, not much research has been done on testing the efficiency of commodity derivatives in price discovery of agricultural/primary commodities in India. In this backdrop, an attempt has been made to revisit the debate on price discovery mechanism in agricultural commodities market. It covers fairly longer study period compared to prior research of the subject. The study attempts to address the following question: Are the commodity futures prices useful in price discovery function of spot prices?
5.
OBJECTIVE OF THE STUDY
The main aim of the present study is to find out whether commodity futures market is efficient in price discovery for agricultural commodities in India.
6.
HYPOTHESES OF THE STUDY
H01: There is no significant long-run association between commodity futures and spot prices.
H02: There is no significant Granger causality from commodity futures prices to spot prices.
7.
DATA & RESEARCH METHODOLOGY
This study is based on secondary data which is obtained from the National Commodity & Derivatives Exchange Limited (NCDEX). The daily prices of near-month contracts of spot and futures markets, for a period of 10 years (2004 – 2014), for three agricultural commodities, such as Chana, Chilli and Turmeric are taken from the NCDEX website. Natural Logarithm of daily closing prices is taken to minimize the heteroscedasticity in data. In order to analyze price discovery and risk management functions in both spot and futures prices in agricultural commodity market, Ordinary Least Square (OLS) Method, Vector Autoregression (VAR) model, Johansen test of Co-integration, Vector Error Correction Model (VECM) and Granger Causality model have been used.
8.
SCOPE OF THE STUDY
9.
DATA ANALYSIS
TABLE 1: DESCRIPTIVE STATISTICS OF DAILY SPOT PRICE AND FUTURES PRICES (2004 – 2014) Descriptive Statistics NCDEX - Agricultural Commodities - Near Month Contracts
Chana Chilli Turmeric
SP FP SR FR SP FP SR FR SP FP SR FR
Mean 2561.86 2570.97 0.03 0.02 5673.81 5502.37 0.13 0.12 5503.32 5405.33 0.05 0.06
Median 2390.00 2404.50 0.00 0.00 5452.15 5178.00 -0.07 -0.04 4947.50 4719.00 -0.02 -0.06
Maximum 5021.90 4933.00 10.39 10.63 10420.00 10336.00 47.30 42.95 17047.05 15776.00 23.31 31.90
Minimum 1386.45 1398.00 -12.17 -25.76 1695.60 1733.00 -49.78 -58.06 1896.65 1817.00 -44.65 -36.45
Std. Dev. 759.14 742.28 1.48 1.72 1944.90 1917.04 3.13 3.95 3827.61 3592.07 2.66 3.34
Skewness 0.97 0.93 -0.22 -1.61 0.39 0.62 2.38 0.58 1.43 1.37 -4.25 0.21
Kurtosis 3.96 3.86 9.82 31.24 3.08 3.22 124.04 68.10 4.20 4.05 96.48 32.48
No. of Observations 2676 2676 2675 2675 1187 1187 1186 1186 1386 1386 1385 1385 Note: SP = Spot Price; FP = Futures Price; SR = Spot Returns; FR = Futures Returns
Table 1 reports the descriptive statistics of variables for the period of the sample based on the daily prices and returns. It shows that the returns on spot and futures of Chilli are much higher than the returns of Chana and Turmeric during the study period. It also shows that the standard deviation of returns of Chilli and Turmeric is more than the Chana. It implies that the variability in returns is more in case of Chilli and Turmeric than Chana. Positive skewness was observed in the prices of spot and futures for Chana, Chilli and Turmeric near month contracts. Negative skewness was observed in the returns of spot and futures of Chana and spot returns of Turmeric. A large Kurtosis figure (> 3) is also observed in the prices and returns of spot and futures of Chana, Chilli and Turmeric commodities, indicating a relatively Leptokurtic distribution.
EFFECTIVENESS OF COMMODITY FUTURES IN PRICE DISCOVERY OF SPOT PRICES TESTING STATIONARITY OF COMMODITY FUTURES AND SPOT RETURNS
Augmented Dickey Fuller (ADF) test has been conducted to analyse the stationarity of spot and futures returns of sample commodities for near month contracts. The following equation describes the estimation of stationarity under ADF test.
∑
= −
−
0
+
+
∆
+
=
∆
p 1 j t j t j 1 tt
Y
Y
Y
α
γ
β
ε
The unit root test is then carried out under the null hypothesis γ =1 against the alternative hypothesis of γ < 1. Once the value for the test statistic is computed, it can be compared to the relevant critical value for the ADF test. If the test statistic is less than the critical value then the null hypothesis of γ =1 is rejected and no unit root is present and the series become stationary.
TABLE 2: TESTING OF STATIONARITY OF COMMODITY SPOT AND FUTURES PRICES & RETURNS
Augmented Dickey Fuller test - Log Prices
Particulars Chana - Near Month Chilli - Near Month Turmeric - Near Month
t-Statistic Prob.* t-Statistic Prob.* t-Statistic Prob.* Log Spot Prices -1.983179 0.2945 -1.901357 0.3319 -0.967595 0.7664
Log Futures Prices -2.008064 0.2835 -2.096392 0.2463 -1.083507 0.7243 Augmented Dickey Fuller test - Ln futures and Spot Returns
Particulars Chana - Near Month Chilli - Near Month Turmeric - Near Month
t-Statistic Prob.* t-Statistic Prob.* t-Statistic Prob.* Spot Returns -47.11322 0.0001 -31.62426 0.0000 -32.88813 0.0000
Futures Returns -50.83035 0.0001 -31.63985 0.0000 -36.53932 0.0000 Test critical values:1% level -3.432948; 5% level -2.862574; 10% level -2.567366
*MacKinnon (1996) one-sided p-values.
The table 2 shows the results of stationarity test on the log values of spot and futures prices and log values of spot and futures returns for near month contracts of Chana, Chilli and Turmeric respectively. The results of the ADF test confirm that the data series of spot and futures prices is non- stationary at level form (p > 0.05) and the data series of spot and futures returns is stationary (p < 0.05). Hence, Johansen test of cointegration is used to check long run equilibrium relationship between spot and futures prices of sample commodities.
TABLE 3: OPTIMAL LAG SELECTION – NEAR MONTH CONTRACTS
VAR Lag Order Selection Criteria – Endogenous variables: LSP LFP – Chana
Lag LogL LR FPE AIC SC HQ
0 5000.367 NA 8.13E-05 -3.741293 -3.736884 -3.739697 1 15147.52 20271.52 4.10E-08 -11.33347 -11.32025 -11.32869 2 15442.96 589.7779 3.30E-08 -11.55162 -11.52957* -11.54364 3 15456.55 27.10598 3.27E-08 -11.5588 -11.52793 -11.54763 4 15471.98 30.75584* 3.25e-08* -11.56735* -11.52767 -11.55299* Endogenous variables: LSP LFP - Chilli
Lag LogL LR FPE AIC SC HQ
0 842.2153 NA 0.000828 -1.420482 -1.411901 -1.417248 1 5006.643 8307.735 7.30E-07 -8.454173 -8.428429* -8.444469 2 5017.61 21.83968* 7.22e-07* -8.465950* -8.423044 -8.449776* 3 5021.583 7.899248 7.22E-07 -8.465905 -8.405836 -8.443262 4 5024.191 5.176524 7.23E-07 -8.463552 -8.38632 -8.434439 Endogenous variables: LSP LFP - Turmeric
Lag LogL LR FPE AIC SC HQ
VOLUME NO.5(2015),ISSUE NO.03(MARCH) ISSN 2231-5756
INTERNATIONAL JOURNAL OF RESEARCH IN COMMERCE, IT & MANAGEMENT
* indicates lag order selected by the criterion
LR: sequential modified LR test statistic (each test at 5% level); FPE: Final prediction error; AIC: Akaike information criterion; SC: Schwarz information criterion; HQ: Hannan-Quinn information criterion
As the results of cointegration are sensitive to lag length used in the analysis, selection of optimal lag length is necessary. Table 3 presents the results of lag length selection criteria applied in the present study. As per Akaike Information Criterion (AIC) the optimal lag length of 4 days is selected for near month contracts of Chana, 2 days for Chilli and 3 days for Turmeric respectively.
ESTIMATION OF LONG-RUN ASSOCIATION BETWEEN COMMODITY FUTURES AND SPOT PRICES
The price linkage between futures market and spot market is examined using cointegration (Johansen, 1991) analysis which reveals the extent to which two markets have moved together towards long run equilibrium. There are two test statistics for cointegration under the Johansen approach, which are formulated as
TRACE TEST
= − ln 1 −
MAXIMUM EIGENVALUE TEST
, + 1 = − ln 1 −
Where r is the number of cointegrating vectors under the null hypothesis and is the estimated value for the ith ordered Eigenvalue from the Π matrix. It is the
ith largest Eigenvalue of matrix Π. T is the sample size or number of observations. is the (1+r)th largest squared Eigenvalue. λtraceis a joint test where the null
is that the number of cointegrating vectors is less than or equal to r against an unspecified or general alternative that there are more than r. λmax conducts
separate tests on each Eigenvalue, and has as its null hypothesis that the number of cointegrating vectors is r against an alternative of r +1.
TABLE 4: ESTIMATION OF LONG-RUN ASSOCIATION BETWEEN COMMODITIES FUTURES AND SPOT PRICES Johansen Co-integration Test
LSP LFP - Chana - Near Month Contracts
Hypothesized No. of CE(s) Eigenvalue Trace Test Max-Eigen Value Test Statistic value Critical Value Prob.** Statistic value Critical Value Prob.** None * 0.022399 64.30359 15.49471 0.0000 60.50876 14.2646 0.0000 At most 1 0.00142 3.794828 3.841466 0.0514 3.794828 3.841466 0.0514
LSP LFP - Chilli - Near Month Contracts
Hypothesized No. of CE(s) Eigenvalue Trace Test Max-Eigen Value Test Statistic value Critical Value Prob.** Statistic value Critical Value Prob.** None * 0.036177 47.28236 15.49471 0.0000 43.62791 14.2646 0.0000 At most 1 0.003082 3.654446 3.841466 0.0559 3.654446 3.841466 0.0559
LSP LFP - Turmeric - Near Month Contract
Hypothesized No. of CE(s) Eigenvalue Trace Test Max-Eigen Value Test Statistic value Critical Value Prob.** Statistic value Critical Value Prob.** None * 0.031188 44.94325 15.49471 0.0000 43.7877 14.2646 0.0000 At most 1 0.000836 1.155554 3.841466 0.2824 1.155554 3.841466 0.2824
Trace test indicates 1 cointegrating eqn(s) at the 0.05 level; Max-eigenvalue test indicates 1 cointegrating eqn(s) at the 0.05 level; * denotes rejection of the hypothesis at the 0.05 level; **MacKinnon-Haug-Michelis (1999) p-values
Table 4 reveals that there is a presence of one cointegration equation between commodity spot and future prices of near month contracts of Chana, Chilli and Turmeric and this signifies the long-run association. While the trace test results point out less than or one cointegration equations, Maximum Eigen value test results confirm the presence of one cointegration equation.
ESTIMATION OF LONG-RUN AND SHORT-RUN ADJUSTMENT/CONVERGENCE TOWARDS EQUILIBRIUM (CAUSALITY) BETWEEN COMMODITY SPOT AND FUTURES PRICES
To examine the lead-lag relationship or the long-run and short-run speed adjustment/convergence towards equilibrium or long-run steady state (causality) between spot and futures prices of the select commodities, the study uses the Vector Error Correction Model (VECM) as spot and futures prices are cointegrated. When the coefficient of error correction term (coefficient of CointEq1) is negative in sign and significant, then it can say that there is a long-run causality running from futures prices to dependent spot prices (Gujarati, 2009).
= +λ + !
"
+ #$% $ %
&
% "
+ '
$ = $+λ$ + !$ $
"
+ #% %
&
% "
+ '$
Where αS and αF are the intercepts and εSt and εFt are the error terms. Zt-1 is the error correction term, which measures how the dependent variable adjusts to
the previous period’s deviation from the long-run equilibrium. Zt -1 = St -1 - αFt -1 where α is the cointegrating vector. The coefficients λS and λF are interpreted as
TABLE 5: ESTIMATION OF LONG-RUN AND SHORT-RUN ADJUSTMENT /CAUSALITY BETWEEN COMMODITY FUTURES AND SPOT PRICES VEC - Vector Error Correction Estimates of LSP LFP for Near Month Contracts
Chana Chilli Turmeric Error Correction: D(LSP) D(LFP) D(LSP) D(LFP) D(LSP) D(LFP)
CointEq1 Coefficient -0.021754 0.044737 -0.02778 0.039219 -0.044087 0.028871 Standard Error 0.0086 0.01087 0.01179 0.01497 0.01317 0.01708 t-statistics [-2.52934] [ 4.11402] [-2.35688] [ 2.61933] [-3.34655] [ 1.68986] Prob. 0.0115 0.0000 0.0186 0.0089 0.0008 0.0913 D(LSP(-1)) Coefficient -0.140273 0.048932 0.01054 -0.093393 -0.052826 0.052339
Standard Error 0.02521 0.03188 0.04125 0.05241 0.03802 0.04931 t-statistics [-5.56322] [ 1.53491] [ 0.25550] [-1.78214] [-1.38939] [ 1.06145] Prob. 0.0000 0.1249 0.7984 0.0750 0.1649 0.2887 D(LSP(-2)) Coefficient 0.019354 0.068243 -0.053819 -0.064645 -0.087443 -0.02068
Standard Error 0.02536 0.03206 0.04119 0.05233 0.03741 0.04852 t-statistics [ 0.76315] [ 2.12833] [-1.30652] [-1.23540] [-2.33715] [-0.42623] Prob. 0.4454 0.0334 0.1916 0.2169 0.0196 0.6700 D(LSP(-3)) Coefficient -0.087573 0.009288 0.034782 0.017152
Standard Error 0.02527 0.03196 0.03606 0.04677 t-statistics [-3.46491] [ 0.29065] [ 0.96443] [ 0.36672] Prob. 0.0005 0.7713 0.3350 0.7139 D(LSP(-4)) Coefficient -0.064059 0.055019
Standard Error 0.02233 0.02823 t-statistics [-2.86897] [ 1.94893] Prob. 0.0042 0.0514 D(LFP(-1)) Coefficient 0.3772 0.007302 0.068277 0.147738 0.158608 0.000229
Standard Error 0.02035 0.02573 0.03298 0.0419 0.03045 0.03949 t-statistics [ 18.5370] [ 0.28384] [ 2.07006] [ 3.52609] [ 5.20862] [ 0.00579] Prob. 0.0000 0.7766 0.0387 0.0004 0.0000 0.9954 D(LFP(-2)) Coefficient -0.057483 -0.037123 0.075657 0.046685 0.132713 0.042404
Standard Error 0.02224 0.02812 0.03311 0.04206 0.03066 0.03976 t-statistics [-2.58449] [-1.32010] [ 2.28490] [ 1.10991] [ 4.32921] [ 1.06660] Prob. 0.0098 0.1869 0.0225 0.2673 0.0000 0.2863 D(LFP(-3)) Coefficient -0.004722 -0.01027 0.028648 0.021175
Standard Error 0.02212 0.02796 0.03003 0.03894 t-statistics [-0.21348] [-0.36727] [ 0.95411] [ 0.54380] Prob. 0.8310 0.7134 0.3402 0.5867 D(LFP(-4)) Coefficient 0.036744 -0.03691
Standard Error 0.02128 0.02691 t-statistics [ 1.72643] [-1.37164] Prob. 0.0844 0.1703 C Coefficient 0.000256 0.000205 0.001179 0.001203 0.000432 0.000522
Standard Error 0.00026 0.00033 0.0009 0.00114 0.00069 0.0009 t-statistics [ 0.97738] [ 0.61949] [ 1.30903] [ 1.05089] [ 0.62308] [ 0.58069] Prob. 0.3285 0.5356 0.1908 0.2935 0.5333 0.5615 R-squared 0.166567 0.013296 0.024333 0.01566 0.066839 0.005486 Adj. R-squared 0.163748 0.009959 0.020192 0.011482 0.062084 0.00042 F-statistic 59.09103 3.984085 5.875785 3.748278 14.05914 1.082847 Prob(F-statistic) 0.0000 0.000045 0.0000 0.002264 0.0000 0.371762
Table 5 shows the error correction terms of spot and futures prices for different lags and indicate the long-run and short-run speed adjustment/convergence towards equilibrium or long-run steady state. In case of near month contracts of all the select commodities, the coefficient of error correction term of log spot prices is negative in sign and significant (p<0.05), which shows long-run causality running from futures prices to spot prices for all the three commodities. The error correction terms of sample commodities viz., Chana, Chilli and Turmeric are -0.021754, -0.02778 and -0.044087 and indicate that there is nearly 2.2%, 2.8% and 4.4% speed of adjustment towards equilibrium.
TABLE 6: ESTIMATION OF PRESENCE OF SHORT-RUN CAUSALITY BETWEEN COMMODITY FUTURES AND SPOT PRICES Wald Test: - LSP LFP - Near Month Contracts
Test Statistic Chana Chilli Turmeric
Value df Prob. Value df Prob. Value df Prob. F-statistic 107.539 (4, 2661) 0.0000 4.825 (2, 1178) 0.0082 12.497 (3, 1374) 0.0000 Chi-square 430.155 4 0.0000 9.650 2 0.0080 37.490 3 0.0000
Wald test is performed to test the null hypothesis that the joint value of coefficients of future prices at different select lag lengths is zero and the results of the Wald test disproves the hypothesis (p < 0.05) for all the coefficients of futures prices of select commodities. This indicates the presence of the short-run causality between the spot and futures markets of Chana, Chilli and Turmeric.
ESTIMATION OF DIRECTION OF CAUSALITY – GRANGER CAUSALITY
Engle and Granger (1987) and Johansen (1991) suggest that if cointegration exists between two variables in the long-run, then there must be either unidirectional or bi-directional causality between these variables. If spot and futures prices are cointegrated, then causality must exist at least in one direction (Granger, 1986). Further, to find out the direction of the causality, Granger Causality test is conducted with the help of the following equations:
CAUSAL RELATIONSHIP FROM FUTURES TO SPOT MARKET
= (+
)
+ ! $
)
VOLUME NO.5(2015),ISSUE NO.03(MARCH) ISSN 2231-5756
INTERNATIONAL JOURNAL OF RESEARCH IN COMMERCE, IT & MANAGEMENT
CAUSAL RELATIONSHIP FROM SPOT TO FUTURES MARKET
$ = (+
)
+ ! $
)
+ μ ++
In the above two equations, RSt and RFt are returns of spot and futures price in period t and RS(t - k)and RF(t - k)are the spot and futures price returns in k previous
periods, i.e. period (t- k).αk, and βkare the coefficients and µt are the error terms. For the first equation the null hypothesis βk= 0 implies that previous periods
futures returns do not Granger- cause present periods spot price returns. However, if the null is rejected using a standard joint test like the F-test then it would imply that previous period futures price returns help in predicting today’s spot price returns. Similarly, for the second equation rejection of the null βk= 0 (which
means previous periods spot prices do not cause today’s futures price) would signify the power of the previous values of spot price returns in predicting today’s futures price returns.
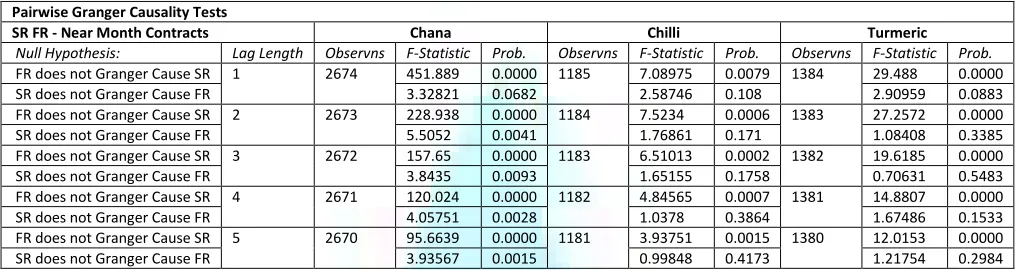
TABLE 7: ESTIMATION OF DIRECTION OF CAUSALITY – GRANGER CAUSALITY Pairwise Granger Causality Tests
SR FR - Near Month Contracts Chana Chilli Turmeric
Null Hypothesis: Lag Length Observns F-Statistic Prob. Observns F-Statistic Prob. Observns F-Statistic Prob.
FR does not Granger Cause SR 1 2674 451.889 0.0000 1185 7.08975 0.0079 1384 29.488 0.0000 SR does not Granger Cause FR 3.32821 0.0682 2.58746 0.108 2.90959 0.0883 FR does not Granger Cause SR 2 2673 228.938 0.0000 1184 7.5234 0.0006 1383 27.2572 0.0000 SR does not Granger Cause FR 5.5052 0.0041 1.76861 0.171 1.08408 0.3385 FR does not Granger Cause SR 3 2672 157.65 0.0000 1183 6.51013 0.0002 1382 19.6185 0.0000 SR does not Granger Cause FR 3.8435 0.0093 1.65155 0.1758 0.70631 0.5483 FR does not Granger Cause SR 4 2671 120.024 0.0000 1182 4.84565 0.0007 1381 14.8807 0.0000 SR does not Granger Cause FR 4.05751 0.0028 1.0378 0.3864 1.67486 0.1533 FR does not Granger Cause SR 5 2670 95.6639 0.0000 1181 3.93751 0.0015 1380 12.0153 0.0000 SR does not Granger Cause FR 3.93567 0.0015 0.99848 0.4173 1.21754 0.2984 Table 7 presents the results of granger causality. The granger causality test has been done from lag one to lag five, to assess the direction of causality on all the week days prices in futures and spot market. The results disclose that there is only a unidirectional causality from futures returns to spot returns of commodities Chilli and Turmeric (P < 0.05). However, in the case of Chana, there is a unidirectional causality from futures to spot returns (P < 0.05) for lag one and bidirectional causality from futures to spot returns of Chana (P < 0.05) for remaining lags.
10.
FINDINGS & CONCLUSIONS OF THE STUDY
The cointegration results reveal that there is a presence of one cointegration equation between commodity spot and future prices of near month contracts of Chana, Chilli and Turmeric. It also reveals that there is a long-run association between commodity spot and futures prices of Chana, Chilli and Turmeric. The VECM results show that there is a long –run causality running from futures prices to spot prices of near month contracts of Chana, Chilli and Turmeric. The results of the Wald test reveals that the joint value of all the coefficients of futures prices at select lag lengths of Chana, Chilli and Turmeric contracts indicates the presence of the short-run causality between the spot and futures markets. The granger causality test results disclose that there is only a unidirectional causality from futures returns to spot returns of Chilli and Turmeric. In case of Chana, a unidirectional causality from futures to spot returns for lag one and bidirectional causality from futures to spot returns for remaining lags is observed. So, it is revealed that the near month futures contracts are efficient in price discovery of agricultural commodities in India.
11.
IMPLICATIONS OF THE STUDY
As Derivatives market resembles the price expectations of the farmers, the commodity futures will be helpful in efficient price discovery in the agricultural spot market in India. Despite gaps, the futures price and spot prices are related in long-run. The farmer can use futures to hedge price risk. The futures indicate future spot price and so in two commodities futures decide the price of spot but in one commodity there is bidirectional flow showing spot gives the direction to futures.
REFERENCES
1. Bose, Sushmitha (2008). Commodity Futures Market in India: A study of trends in the National Multi-Commodity Indices, Money & Finance, ICRA Bulletin, pp 125-158.
2. Chauhan, Ajay Kumar., Singh, Shikha., and Arora, Aanchal. (2013). Market Efficiency and Volatility Spillovers in Futures and Spot Commodity Market: The Agricultural Sector Perspective, Samvad – SIBM, Volume VI, No. 2, 61-84.
3. Engle, Robert F. and Granger, Clive W. J. (March 1987) “Cointegration and error correction: representation, estimation and testing”, Econometrica 55(2) 251–76.
4. Fleming, J; Ostdiek, B and Whaley, R E (1996). “Trading Costs and the Relative Rates of Price Discovery in Stock, Futures, and Option Markets,” Journal of Futures Markets, 16(4), 353-87.
5. Garbade, K. D. and Silber, W. L. (1983): ‘Price Movements and Price Discovery in Futures and Cash Markets’, The Review of Financial and Economic Studies, Vol.65, pp.421-440.
6. Granger C (1986), “Developments in the Study of Cointegrated Variables”, Oxford Bulletin of Economics and Statistics, Vol. 48, No. 3, pp. 213-227. 7. Gujarati, D.N, Dawn C. Porter (2009), “Time Series Econometrics: Some Basic Concepts”, in: Basic Econometrics (5th Edition), pp. 764-765, Tata
McGraw-Hill Publishing Company Limited, New Delhi.
8. Hoffman, G. Wright, Future Trading Upon Organized Commodity Markets in the United States(Philadelphia: University of Pennsylvania, 1932).
9. Johansen, S.J. (1991), “Estimation and hypothesis testing of cointegration vectors in Gaussian vectors auto regression models”,Econometrica, vol. 59, pp. 1551-80.
10. Kumar, Brajesh., and Pandey, Ajay. (2011). Price Discovery in Emerging Commodity Markets:Spot and Futures Relationship in Indian Commodity Futures Market, Boğaziçi Journal, Vol. 25, no. 1, pp. 79-121.
11. Kumar, Mantu., Debashis, Mahalik., Acharya & M. Suresh Babu, (2009). Price Discovery and Volatility Spillovers in Futures and Spot Commodity Markets: Some Empirical Evidence from India, IGIDR Proceedings/Project Reports Series.
12. Mallikarjunappa, T., and Afsal, E M (2010). Price Discovery Process and Volatility Spillover in Spot and Futures Markets: Evidences of Individual Stocks, Vikalpa, Volume 35, No 2, April – June.
13. Mukherjee, Kedar Nath (2011). Impact of Futures trading on Indian Agricultural CommoditiesMarket, MPRA (Munich Personal RePEc Archive) Paper No. 29290, February 14, 2011.
14. Nath C. Golaka, Tulsi Lingareddy (2008). Impact of Futures Trading on Commodity Prices, Economic & Political Weekly, 18-23, (January 19, 2008). 15. Pindyck, Robert S. (2001). The Dynamics of Commodity Spot and Futures Markets: A Primer, The Energy Journal, Vol. 22, No. 3.
17. S.M. Lokare (2007). Commodity Derivatives and Price Risk Management: An Empirical Anecdote from India, Reserve Bank of India Occasional Papers, Vol. 28, No. 2, Monsoon 2007.
18. Sehgal, Sanjay., Rajput, Namita., and Dua, Rajeev Kumar. (2012). Futures Trading and Spot Market Volatility: Evidence from Indian Commodity Markets, Asian Journal of Finance & Accounting, Vol. 4, No. 2, 199-217.
19. Susan Thomas, (2003). Agricultural commodity markets in India: Policy issues for growth, Indira Gandhi Institute for Development Research, Mumbai. 20. Working, H. (1948), ‘Theory of inverse carrying charge in futures markets’, Journal of Farm Economics, 30 February.
21. Yang, Jian., Brian Balyeat, R., and Leatham David, J. (2005). Futures Trading Activity and Commodity Cash Price Volatility, Journal of Business Finance & Accounting, 32(1) & (2), 297-323.
22. Zapata, H., Fortenbery, T.R. and Armstrong, D. (2005), “Price discovery in the world sugar futures and cash markets: implications for the Dominican Republic”, Staff Working PaperNo.469, March, Agricultural and Applied Economics.
VOLUME NO.5(2015),ISSUE NO.03(MARCH) ISSN 2231-5756
INTERNATIONAL JOURNAL OF RESEARCH IN COMMERCE, IT & MANAGEMENT
REQUEST FOR FEEDBACK
Dear Readers
At the very outset, International Journal of Research in Commerce, IT & Management (IJRCM)
acknowledges & appreciates your efforts in showing interest in our present issue under your kind perusal.
I would like to request you tosupply your critical comments and suggestions about the material published
in this issue as well as on the journal as a whole, on our E-mail
infoijrcm@gmail.com
for further
improvements in the interest of research.
If youhave any queries please feel free to contact us on our E-mail
infoijrcm@gmail.com
.
I am sure that your feedback and deliberations would make future issues better – a result of our joint
effort.
Looking forward an appropriate consideration.
With sincere regards
Thanking you profoundly
Academically yours
Sd/-
Co-ordinator
DISCLAIMER