Please cite this article as: M. Sharifipour, H. Bonakdari, A. H. Zaji, Impact of the Confluence Angle on Flow Field and Flowmeter Accuracy in Open Channel Junctions, International Journal of Engineering (IJE), TRANSACTIONS B: Applications Vol. 28, No. 8, (August 2015) 1145-1153
International Journal of Engineering
J o u r n a l H o m e p a g e : w w w . i j e . i r
Impact of the Confluence Angle on Flow Field and Flowmeter Accuracy in Open
Channel Junctions
M. Sharifipour, H. Bonakdari *, A. H. Zaji
Department of Civil Engineering, Razi University, Kermanshah, Iran
P A P E R I N F O
Paper history:
Received 09 June 2015
Received in revised form 26 July 2015 Accepted 30 July 2015
Keywords: CFD
Confluence Angle Flow Field Flowmeter
Open Channel Junction
A B S T R A C T
Open channel junction is one of the most common hydraulic structures that are used in various practical situations such as sewer, drainage, and flood control systems. Knowing the fluid flow behavior, is one of the most important topics in designing the efficient open channel junctions. The complexity and deviation of flow in the junction’s zone disrupts the proper functioning of the flowmeter devices which are located in the cross section and causing error in their measurements. Various three-dimensional computational fluid dynamic (CFD) models were developed in this paper in order to study in the velocity field and flowmeter accuracy of junctions in different hydraulic conditions and confluence angles. The results showed that by increasing the confluence angle, the junction’s downstream flow becomes more complicated, and consequently, the difference between the flowmeter measured discharge values and the real discharge value becomes greater. For the junction with 30° confluence, the flowmeter discharge prediction error is equal to 2 and 6.45% in the junction’s upstream and downstream, respectively. These values increase to 6 and 38.65% for the junction’s upstream and downstream with 90° confluence, respectively.
doi: 10.5829/idosi.ije.2015.28.08b.06
1. INTRODUCTION1
Open channel junctions are an important element in natural rivers and man-made hydraulic systems such as water distribution, wastewater, and drainage structures. Numerous junction configurations exist in nature and the flow behavior which are a function of geometric and hydraulic conditions. Velocity is a specific parameter that affects the channel morphology and hydrodynamic flow upstream and downstream of the junction. High velocity in contraction zone leads to the channel walls erosion, as well as, low velocity in the separation zone leads to sediment accumulation which may block the flow. Complex three-dimensional velocity changes create vortex flows. Therefore, the knowledge about velocity field and flow rate at post-junction has great importance in hydraulic engineering practical problems. Due to the complex hydrodynamics of the flow and different parameters influencing it, many researchers
1
*Corresponding Author’s Email: [email protected] (H. Bonakdari)
the depth of flow. They calculate the flow rate from continuity equation and in the form of the product of average velocity by wet cross section (Q = A(h)×Umean). Cross section A(h) is calculated by measuring flow depth (h) and exact geometrical information. Determination of average velocity needs a specific knowledge. The scanned zone by Doppler velocimeter is a limited conic volume and velocimeters measure a confined volume of the flow [13]. Mean velocity by sensors is calculated based on this volume which is different from mean cross-sectional velocity [12-15].
The mean velocity in the cross section is different from the velocity measured by the flowmeter, especially in areas where the velocity distribution is not homogeneous, i.e. post-junction area. In this region, velocity is accompanied with three-dimensional and quick changes. Therefore, the velocity measured by the flow meter cannot represent the mean flow velocity since it is obtained from a limited volume [12, 16]. Hilgenstock and Ernst [17] examined the effect of the flow behavior on different flowmeters numerically and demonstrated that ultrasonic flowmeters can be numerically calibrated under different conditions. Pollert and Bares [18] and Bonakdari [14] calibrated a flow meter located in a sewer through using the computational fluid dynamics method. Bonakdari and Zinatizadeh [12] studied the influence of position and type of Doppler flow meters on flow-rate measurement in open channels by CFD modeling. They showed that the measured velocity by sensors was not certainly sufficient to determine an average velocity in straight channels. The sensor installed at the bottom of channel can be produce an adequate measurement, if there is no risk for sedimentation in the channel. Mignot et al. [19] studied flow structures in junctions by 3D numerical model. The authors analyzed the impact of the junction on the velocity distribution, according to the distance from the junction. They reported that the relative error of the flowmeter installed at the bottom of channel near the junction areas could be reached 60%. Sharifipour et al. [20] investigated the width and discharge ratio effect on the flow pattern and flowmeter measurement accuracy in 90 open channel junctions. The authors studied a flowmeter located in the middle of the cross section of a rectangular channel with a 90° junction numerically through evaluating the effect of different width ratios of the discharge measured by the flowmeter.
This article follows two general objectives. The first
model. Two-phase flow has been considered (water + air). Verification was carried out based on the experimental data to make sure that the numerical results have an acceptable degree of accuracy. Velocity changes were analyzed in particular cross sections for 30, 45, 60, and 90° confluences angles. The flowmeter discharge and the actual mean discharge were also calculated for a specific length of the main channel and were compared to each other.
2. EXPERIMENTAL MODEL
The data measured by Weber et al. [5] were used in this study to verify the numerical model. The experimental studies were conducted on a channel that its geometry has been displayed in Figure 1. The channel’s bed is horizontal, and the walls of the channel are smooth. Perforated plates and 100 mm thick honeycomb were installed at the entrance of the main and branch channels in order to make sure that the input flows are developed. The mean flow velocity has been measured by a sontek three-component Acoustic Doppler Velocimeter (ADV). Flow velocity and water depth are considered constant as Ut = 0.628 m/s and Ht = 0.296 m
respectively in the tailwater of the main channel. The overall discharge is remained constant in all situations (Qt = 0.17 m3/s). The width of the channels, Wd = 0.914
m, has been used to normalize the coordinates of different points. The downstream velocity has been used to make the values of three-dimensional velocity indexes dimensionless. The hydraulic conditions governing the experiments have been listed in Table 1. q* is the result of dividing the discharge in the main channel upstream, Qm, by the overall discharge, Qt. Qb
is the branch channel discharge.
TABLE 1. Flow condition tested by Weber et al. [5]
Qm(m3/s) Qb (m3/s) q*
0.014 0.156 0.083
0.042 0.127 0.250
0.071 0.099 0.417
0.099 0.071 0.583
0.127 0.042 0.750
Figure 1. Laboratory model Weber et al. [5]
3. NUMERICAL MODEL
The key equations for fluid motion in incompressible turbulent fluid flow for steady flow condition in the whole domain are
The continuity equation:
0 i i x u (1)
The Reynolds’ time-averaged Navier-Stokes equations:
) u u x u ( x g x p x u u t u ' j ' i j i j i i j i j i 1 (2)
In the above equations, i and j are 1, 2 and 3, ui = the
mean velocity component along the Cartesian directions; ρ = water density; p = the piezometric pressure; gi = gravity acceleration; ν = kinematic
viscosity.
These equations are not closed, so it is necessary to use turbulence models to close the equation set and then iterate towards a solution. In this study, the k-ω model of Wilcox [21] is selected. This turbulence model has been used in numerous studies which have numerically evaluated the flow in combined open channel flow [6, 9, 22].
The two-equation model is given by the following: Turbulence kinetic energy, k, equation:
j k j * j j x k k x k P x k u t k (3)Specific dissipation rate, ω, equation:
j j j j x k x P k x u t 2 (4)Moreover, the turbulent eddy viscosity is computed from:
t k (5)
The constants used in the two-equations are: σk = 0.5, σω
= 0.5, β* = 0.09, β = 3/40, α = 5/9.
Ansys-cfx software has been used in this study to model Weber et al. [5] experiments. After validation of numerical model by this experimental result, the flow is modelled in 30, 45, 60 and 90° confluences for q* = 0.5 and w* = 1.0.
The used computational mesh has been presented in Figure 2. As it is obvious, the grids are refiner around the junction area so that the flow could be studied and analyzed more carefully in this area. The sizes of the elements have been changed gradually in different interface blocks of the meshing. Table 2 presents the details of the used grid for different numerical CFD models.
1013111 965735
θ = 90°
The boundary conditions of the entrances of the main and branch channels have been determined by entering the values of the input mean velocity and the water depth. Static pressure was applied as outlet boundary condition. Free surface has been modelled by VOF (volume of fluid) method proposed by Hirt and Nichols [23] which used by many researchers in numerical simulation of free surface in open channels [10, 24]. A varied function called α has been used in this method which is part of water volume in the calculative cell. If α is equal to 1.0, it indicates that the cell is full of water, and if α is equal to zero it means the cell is full of air. When 0<α<1, a percentage of the cell is filled with air and a percentage of it is filled with water. The free surface of the flow has been defined as equal to 0.5 in the water volume component in this study, α, the volume component in the entire domain of the solution, is determined by solving the continuity equation of the water volume component:
0
y v x u t
(6)
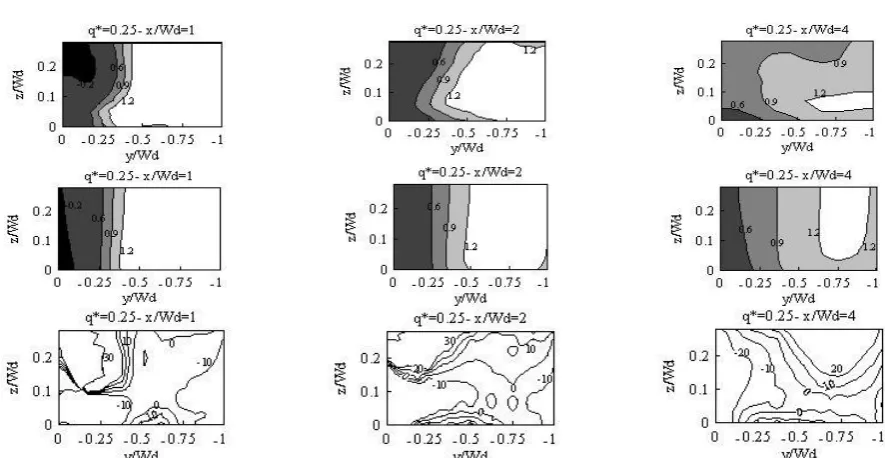
Numerical results have been investigated in two conditions, q* = 0.25 and q* = 0.75, and the performance of the numerical model in simulating the flow has been analyzed through comparing the numerical results with the experimental data. Figures 3 and 4 show the contours of the velocity, which has been made dimensionless, in q* = 0.25 and q* = 0.75 respectively and in x/Wd = 1, 2, and 4 cross sections. The negative
velocities can be seen in both numerical and experimental plots near the inner walls of the main channel downstream (y/Wd = 0) at q* = 0.25 and x/Wd =
1.0. Negative velocity indicates backflow towards the upstream, and this occurs in the separation zone. The flow becomes contracted and the velocity increases across from the separations zone [12, 25, 26]. The high velocity of the flow has been specified near the outer wall of x/Wd = 1.0 cross section, in the simulated and
experimental results. The negative velocities fade away in the x/Wd = 2 and four cross sections, and the positive
velocity becomes less near the outer wall. It could be seen concerning the errors graph which the error values are greater near the inner wall than the outer wall. This difference becomes smaller as the position of the cross section is moved away from the confluence zone. The error reaches zero in the middle points of the cross section.
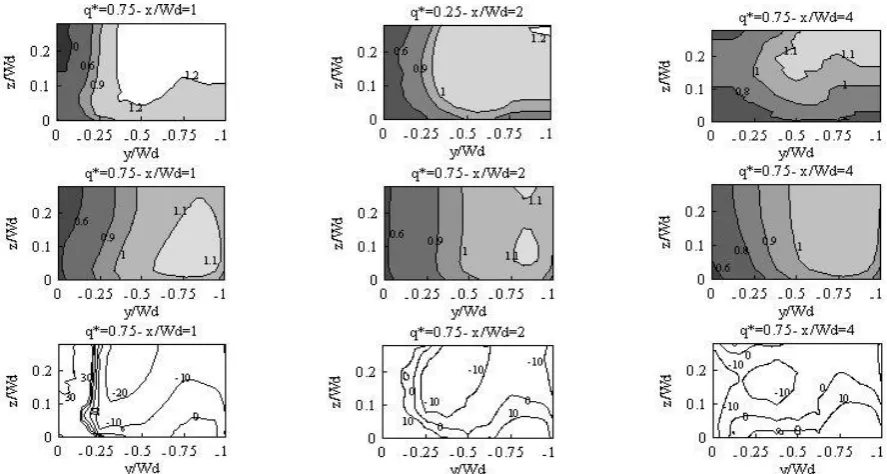
Figure 4. Experimental (first row), numerical (second row) and prediction error% (third row) contours of dimensionless velocity component along the flow direction for a discharge ratio of 0.75.
The results related to 0.75 discharge ratio (Figure 4) were closer to the experimental data in comparison with the 0.25 discharge ratio. It could be seen that the simulation error reduces by 10% near the inner wall at x/Wd = 1.0, and the error had decreased by 20% at x/Wd = 2.0. The velocity near the outer wall is smaller in the high discharge ratio in comparison with the low discharge ratio in both experimental and numerical states. Analyzing the experimental results and the numerical results brings us to the conclusion that since the major part of the flow enters the junction from the main channel at high discharge ratio, the alternative flow will not have sufficient momentum to deviate the main flow. Therefore, the main flow continues its path with a slighter deviation in comparison with low discharge ratio, the flow turbulence decrease, and the flow reaches a stable state faster after the junction. From Figures 3 and 4, it could be concluded that the utilized numerical model is capable of simulating the flow compare with the experimental results.
5. GENERAL FLOW PATTERN IN VARIOUS CONFLUENCE ANGLES
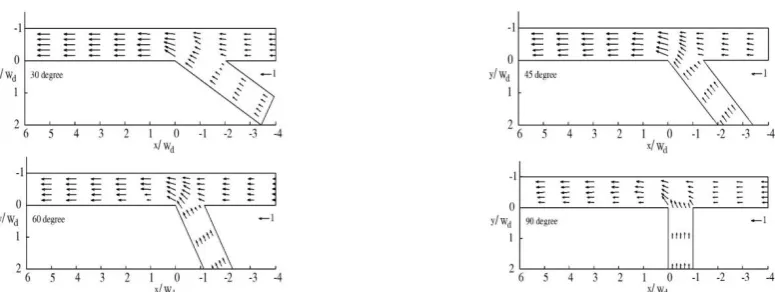
The manner of velocity changes has been compared in a plane near the water surface and at different confluence angles in Figure 5. It could be seen in all angles that the flow velocity decreases at the main and a branch upstream channel as it gets closer to the junction. Also,
the velocity vectors in the branch channel show that the velocity decreases in the corner of the branch channel upstream. All states clearly show that the main velocity deviates due to the alternative flow are entering. In the 30° confluence open channel junction, the downstream flow stabilizes quickly, and the flow velocity increases. In a 45°, the velocity vector of the alternative flow enters the junction with a larger angle in comparison with the 30° state. Also, a decrease in velocity can be seen near the inner walls of the downstream. The 60° clearly displays the effect on the confluence angle change has on the velocity vector. In such a manner, the angle of the alternative flow entering the junction increases as the confluence angle increases. Consequently, the alternative flow deviates the main flow from the straight path with more power. The velocity of the mixed flow dramatically drops near the inner wall as it enters the downstream, however, increases in the outer wall. The maximum and minimum velocities find their balance after traveling for a distance, and the flow gradually becomes stable. It takes more time for the flow to enter the stable phase in a 90° channel in comparison to the other angles since the flow is highly turbulent in a 90°.
Figure 5. Plan view of vectors fields in numerical models near surface (Z* = 0.22) with q* = 0.5 and W* = 1
6. THE EFFECT OF VARIOUS CONFLUENCE ANGLES ON FLOWMETER PRECISION
The flowmeters based on their characterizes eventually present the mean values of measured velocity in measuring area which is a limited zone of the cross section. Their measured area depends on the position of the sensor in the cross section. As in many practical cases, sensors shall be installed in the middle of the channel [12, 19], this study holds the assumption that the sensors have been installed on a line which is vertical to the channel bed and is located in the middle of the cross section. The mean discharge is obtained by multiplying the mean velocity by the wet area of the junction. The flow is unstable and highly turbulent in the post-junction. Therefore, numerous secondary currents and rotating flows are three-dimensionally formed in the channel [9, 27-29]. It can be seen that changing different confluence angles significantly affects the flow pattern. Increasing the confluence angle will make the main flow deviate from the straight path with more power. Therefore, the flow separating from the downstream inner wall creates a low-velocity area. The flow undergoes contraction exactly across from the separation zone, and the velocity increases dramatically. The limited volume of the flowmeter measurements and the complex flow manner in the open channel junctions indicate that the velocity which is measured by the flowmeter could not represent the real mean flow velocity. One of the important objectives of this study is to examine the difference between the discharge measured by the flowmeter (Qf) and the actual mean
discharge (Qm) through considering different confluence
angles. Figure 6 shows the flowmeter-discharge and the mean discharge calculated at 30, 45, 60, and 90°. The discharge ratio and width ratio are constant in these numerical models and are equal to 0.5 and 1.0, respectively. This figure includes two series of graphs
which have been separated from each other by the schematic position of the branch channel. The graphs on the right are related to the junction’s upstream in the main channel and the graphs on the left are related to the junction’s downstream. In the small-angle junctions, because of the close direction of the upstream branch and main channel flow, the flows collide together less strongly. As the confluence angle increases and approaches 90 degrees, the alternative flow affects the main flow more. The alternative flow enters the junction and causes the main flow to deviate from its straight path. Therefore, it destabilizes the mixed flow and creates transverse rotating flows.
The flowmeters located in the upstream of the main channel, measure the velocity degree more precisely in the 30° junction in comparison with the 45, 60, and 90° junctions. In such a manner, that the 30° junction’s greatest error was equal to 2%, this error has occurred precisely at the upstream end of the main channel. The difference between the values measured by the flowmeter and the mean discharge is maximum in the upstream of the 90°. In such a manner which the maximum measurement error is equal to 6% and like other angles (30, 45, and 60°), the flowmeter is at its minimum precision level exactly at the upstream end of the main channel (Figure 6). The flowmeter-discharge and the mean discharge are very close to each other in the junction upstream and changing the confluence angle has not affected them significantly. However, greater differences could be seen as we approach the junction. This is due to the effect of the mixed flow regime on the flow in the main channel upstream.
Figure 6. Comparison of mean and flowmeter discharge for various confluence angles obtained using CFD simulation
TABLE 3. Locations and value of maximum error according to the different confluence angle
MAPE x/Wd
θ
6.45 8.0
30°
7.51 0.89
45°
14.66 0.78
60°
38.65 0.66
90°
The difference between Qf and Qm significantly
increases in the junction downstream. This difference reaches its peak in a 90° confluence 0.6 m away from the beginning of the main channel downstream. The discharge measured by the flowmeter gets gradually closer to the mean discharge after this distance and the difference between these two values decreases. As the confluence angle decreases, the flowmeter error dramatically drops in such a manner that the maximum flowmeter error reduces to 14.66% in a 60° confluence from 38.65% in the 90° confluence. The flowmeter is most precise in the 30° in such a manner that the greatest difference between the discharge measured by the flowmeter and the mean discharge reaches 6.45%. It could be seen that the discharge measured by the flowmeter at the beginning of the branch channel downstream (x = 0.0 m), is smaller than the mean discharge in angles smaller than 90 degrees in such a manner that the difference between these two values is approximately -1%. However, the flowmeter error is almost 5% in the 90° at x = 0.0m. The difference between the mean values and the values measured by the flowmeter is nearly 7% in all under-examination angles at the x/Wd = 8 distance which indicates that the flow has developed.
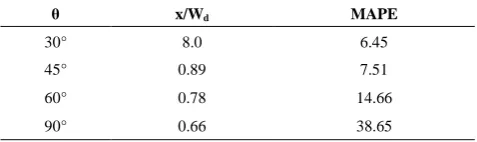
The maximum flowmeter errors and the location which they occur in different confluence angles have been compared in Table 3. The highest Mean Absolute Percentage Error (MAPE) belongs to the largest angle which is the 90° and minimum value belongs to the 30°. MAPE has been calculated through Equation (7).
n
i
Q Q
n MAPE
1
i, i,flo wmetery mean
1
100 (7)
It could be seen in this table that the maximum flowmeter error in the 30° has occurred in x/Wd = 8.0
while it occurs in less than x/Wd = 1.0 in 45, 60, and 90°
confluences. The location of the maximum flowmeter error concerning the junction downstream is influenced by the value of the confluence angle. In such a manner, that as the confluence angle increases, the flowmeter precision drops when it is closer to the junction.
6. CONCLUSION
gradually and slowly stabilizes along the channel. The effects of different confluence angles on the measurement accuracy of the flowmeter have also been evaluated. This was done by comparing the discharge measured by the flowmeter with the actual mean discharge. The flowmeter located in the junction upstream was more precise than the flowmeter located at the downstream junction. However, this accuracy decreases as the flowmeter approaches the junction. The mean discharge and the discharge measured by the flowmeter are very close to each other in the junction upstream in all the angles in such a manner that the maximum error had occurred at the upstream end of the main channel which was approximately 2% in the 30° and 6% in the 90° confluence. The flowmeter error is completely affected by the size of the confluence angle in the downstream. In such a manner, as the confluence angle becomes larger the difference between the mean discharge and the discharge measured by the flowmeter increases. The maximum flowmeter error was related to the 90° (38.65%) and the minimum error has occurred in the 30° (6.455%). The flow has developed in all angles at x/Wd = 8.0, and the difference between the
discharge measured by the flowmeter and the real discharge is almost the same.
7. REFERENCES
1. Taylor, E.H., "Flow characteristics at rectangular open-channel junctions", Transactions of the American Society of Civil Engineers, Vol. 109, No. 1, (1944), 893-902.
2. Best, J.L. and Reid, I., "Separation zone at open-channel junctions", Journal ofHydraulic Engineering, Vol. 110, No. 11, (1984), 1588-1594.
3. Gurram, S.K., Karki, K.S. and Hager, W.H., "Subcritical junction flow", Journal of Hydraulic Engineering, (1997). 4. Hsu, C.-C., Lee, W.-J. and Chang, C.-H., "Subcritical
open-channel junction flow", Journal of Hydraulic Engineering, Vol. 124, No. 8, (1998), 847-855.
5. Weber, L.J., Schumate, E.D. and Mawer, N., "Experiments on flow at a 90 open-channel junction", Journal of Hydraulic Engineering, Vol. 127, No. 5, (2001), 340-35 0.
6. Huang, J., Weber, L.J. and Lai, Y.G., "Three-dimensional numerical study of flows in open-channel junctions", Journal of Hydraulic Engineering, Vol. 128, No. 3, (2002), 268-280. 7. Baghlani, A. and Talebbeydokhti, N., "Hydrodynamics of
right-angled channel confluences by a 2d numerical model", Iranian Journal of Science and Technology. Transactions of Civil Engineering, Vol. 37, No. C2, (2013), 271-290.
of confluence flow in open channel with dynamic meshes techniques", Advances in Mechanical Engineering, Vol. 5, (2013).
11. Zaji, A.H. and Bonakdari, H., "Application of artificial neural network and genetic programming models for estimating the longitudinal velocity field in open channel junctions", Flow Measurement and Instrumentation, Vol. 41, (2015), 81-89. 12. Bonakdari, H. and Zinatizadeh, A.A., "Influence of position and
type of doppler flow meters on flow-rate measurement in sewers using computational fluid dynamic", Flow Measurement and Instrumentation, Vol. 22, No. 3, (2011), 225-234.
13. Bertrand-Krajewski, J.-L., Laplace, D., Joannis, C. and Chebbo, G., "Mesures en hydrologie urbaine et assainissement", Ed. Tec & Doc, (2000).
14. Bonakdari, H., "Modelisation des ecoulements en collecteurs d'assainissement: Application a la conception de points de mesures", (2011).
15. Koelling, C., "Simk—a new finite element model significantly improves the accuracy of flow measurements in sewers", in 7th international conference on urban sorm drainage, (1996), 665-670.
16. Hughes, A., Longair, I., Ashley, R. and Kirby, K., "Using an array of ultrasonic velocity transducers to improve the accuracy of large sewer mean velocity measurements", Water Science and Technology, Vol. 33, No. 1, (1996), 1-12.
17. Hilgenstock, A. and Ernst, R., "Analysis of installation effects by means of computational fluid dynamics—cfd vs experiments?", Flow Measurement and Instrumentation, Vol. 7, No. 3, (1996), 161-171.
18. Pollert, J. and Bares, V., "Determination of velocity fields in a circular sewer", in international conference on sewer operation and maintenance, (2002).
19. Mignot, E., Bonakdari, H., Knothe, P., Lipeme Kouyi, G., Bessette, A., Rivire, N. and Bertrand-Krajewski, J., "Experiments and 3d simulations of flow structures in junctions and their influence on location of flowmeters ,"Water Science and Technology, Vol. 66, No. 6, (2012), 1325-1332.
20. Sharifipour, M., Bonakdari, H., Zaji, A.H. and Shamshirband, S., "Numerical investigation of flow field and flowmeter accuracy in open-channel junctions", Engineering Applications of Computational Fluid Mechanics, (2015), 1-11.
21. Wilcox, D.C., "Turbulence modeling for cfd, DCW industries La Canada, CA, Vol. 2, (1998).
22. Zhang, T., XU, W.-l. and Chao, W., "Effect of discharge ratio on flow characteristics in °00equal-width open-channel junction",
Journal of Hydrodynamics, Ser. B, Vol. 21, No. 4, (2009), 541-549.
23. Hirt, C.W. and Nichols, B.D., "Volume of fluid (vof) method for the dynamics of free boundaries", Journal of Computational Physics, Vol. 39, No. 1, (1981), 201-225.
24. Biron, P.M. and Lane, S.N., "Modelling hydraulics and sediment transport at river confluences", River Confluences, Tributaries and the Fluvial Network, (2008), 17-43.
26. Bradbrook, K., Biron, P., Lane, S., Richards, K. and Roy, A., "Investigation of controls on secondary circulation in a simple confluence geometry using a three‐dimensional numerical model", Hydrological Processes, Vol. 12, No. 8, (1998), 1371-1396.
27. Ashmore, P., "Anabranch confluence kinetics and sedimentation processes in gravel-braided streams", Geological Society, London, Special Publications, Vol. 75, No. 1, (1993), 129-146.
28. Lane, S.N. and Richards, K.S., "High resolution, two‐dimensional spatial modelling of flow processes in a multi‐thread channel", Hydrological Processes, Vol. 12, No. 8, (1998), 1279-8901.
29. Mosley, M.P., "An experimental study of channel confluences",
The Journal of Geology, (1976), 535-562.
Impact of the Confluence Angle on Flow Field and Flowmeter Accuracy in Open
Channel Junctions
M. Sharifipour, H. Bonakdari, A. H. Zaji
Department of Civil Engineering, Razi University, Kermanshah, Iran
P A P E R I N F O
Paper history:
Received 09 June 2015
Received in revised form 26 July 2015 Accepted 30 July 2015
Keywords: CFD
Confluence Angle Flow Field Flowmeter
Open Channel Junction
هديكچ
و یشک هز ،وربلاضاف یراجم ریظن یتوافتم یدربراک طیارش یارب هک دنتسه یکیلوردیه یاه هزاس نیرت مهم زا یکی اه عطاقت
لاناک رد اه عطاقت یحارط رد لیاسم نیرت مهم زا یکی لایس نایرج راتفر تخانش .دنور یم راکب بلایس لرتنک یاه متسیس
ه هیحان نآ رد هک نایرج یریگ هزادنا لیاسو درکراک ،اه عطاقت کیدزن هیحان رد نایرج فارحنا و یگدیچیپ .دشاب یم زابزور یا
نادیم هعلاطم روظنم هب هعلاطم نیا رد .دوش یم یریگ هزادنا ریداقم رد گرزب یاه اطخ داجیا بجوم و هدرک لتخم ار دنراد رارق
ریگ هزادنا تقد یسررب و تعرس ،توافتم یایاوز و یکیلوردیه فلتخم طیارش رد اه عطاقت رد نایرج یریگ هزادنا لیاسو ی
شیازفا اب هک دهد یم ناشن هدمآ تسدب جیاتن .تسا هدش یحارط یتوافتم یتابساحم تلاایس کیمانید یدعب هس یاه لدم
تن رد و دوش یم رت هدیچیپ تسد نییاپ رد نایرج یکیلوردیه راتفر ،عطاقت هیواز هدش یریگ هزادنا یبد ریداقم نیب فلاتخا هجی
هیواز اب عطاقت یارب .دوش یم رتشیب یروبع یبد یعقاو رادقم و
00
یعقاو و هدش یریگ هزادنا یبد یبسن یاطخ رادقم ،هجرد
یواسم
9
و
5.6
هیواز یارب .دشاب یم تسد نییاپ و تسدلااب رد بیترت هب دصرد
00
هب ریداقم نیا هجرد
5
و
01.56
دصرد
.دسر یم عطاقت تسد نییاپ و تسدلااب رد
![TABLE 1. Flow condition tested by Weber et al. [5]](https://thumb-us.123doks.com/thumbv2/123dok_us/224578.2017005/2.595.307.545.633.748/table-flow-condition-tested-weber-et-al.webp)
![Figure 1. Laboratory model Weber et al. [5]](https://thumb-us.123doks.com/thumbv2/123dok_us/224578.2017005/3.595.140.460.110.381/figure-laboratory-model-weber-et-al.webp)