Correlation of air pollutants with land use and traffic
measures in Tehran, Iran: A preliminary statistical analysis
for land use regression modeling
Hassan Amini
Hassan Amini
Hassan Amini
Hassan Amini
1111, Seyed
, Seyed
, Seyed
, Seyed----Mahmood Taghavi
Mahmood Taghavi
Mahmood Taghavi
Mahmood Taghavi----Shahri
Shahri
Shahri
Shahri
2222, Kazem Naddafi
, Kazem Naddafi
, Kazem Naddafi
, Kazem Naddafi
3333,,,,
Ramin Nabizadeh
Ramin Nabizadeh
Ramin Nabizadeh
Ramin Nabizadeh
4444,
, Masud Yunesian
,
,
Masud Yunesian
Masud Yunesian
Masud Yunesian
33331 Kurdistan Environmental Health Research Center, Kurdistan University of Medical Sciences, Sanandaj AND Department of Environmental Health Engineering, School of Public Health, Tehran University of Medical Sciences, Tehran, Iran
2 Research Center for Environmental Pollutants, Qom University of Medical Sciences, Qom AND Department of Epidemiology and Biostatistics, School of Public Health, Isfahan University of Medical Sciences, Isfahan, Iran
3 Center for Air Pollution Research (CAPR), Institute for Environmental Research (IER), Department of Environmental Health Engineering, School of Public Health, Tehran University of Medical Sciences, Tehran, Iran 4 Department of Environmental Health Engineering, School of Public Health, Tehran University of Medical Sciences, Tehran, Iran
Abstract
Abstract
Abstract
Abstract
Land use regression (LUR) models have been globally used to estimate long-term air pollution exposures. The present study aimed to analyze the association of different land use types and traffic measures with air pollutants in Tehran, Iran, as part of the future development of LUR models. Data of the particulate matter (PM10), sulfur dioxide (SO2), and
nitrogen dioxide (NO2) were extracted from 23 Tehran’s air quality monitors for 2010. The data of different land use
types and traffic measures within the circular buffer radii 100 to 1000 meters and distances to them were calculated using Geographic Information System (GIS). Thereafter, the association of the mentioned air pollutants was evaluated with land use types and traffic measures. The annual average concentrations of PM10, SO2 and NO2 were
100.8 µg/m3, 38 parts per billion (ppb), and 53.2 ppb, respectively. The PM10 was associated with transportation
area, other areas, and with distance to the other nearest land use (P < 0.05). The SO2 concentration was associated
with official or commercial land use, and with other area land use (P < 0.05). Noteworthy, the NO2 concentration was
associated with official or commercial land use, and with other areas (P < 0.05). The air pollutant concentrations was analyzed with different land use types and traffic measures as a preliminary work for development of LUR models in Tehran. It is hoped these analyses lead to successful development of LUR models in the near future.
KEYWORDS: KEYWORDS: KEYWORDS:
KEYWORDS: Land Use Regression, Land Use Types, Traffic Measures, Particulate Matter, Sulfur Dioxide, Nitrogen Dioxide
Date of submission: Date of submission: Date of submission:
Date of submission: 18 Mar 2013, Date of acceptance:Date of acceptance: Date of acceptance:Date of acceptance:20 May 2013
Citation:
Amini H, Taghavi-Shahri SM, Naddafi K, Nabizadeh R, Yunesian M. Correlation of air pollutants
with land use and traffic measures in Tehran, Iran: A preliminary statistical analysis for land use
regression modeling. J Adv Environ Health Res 2013; 1(1): 1-8.
Introduction
1Recently, extensive epidemiological studies have
Corresponding Author
Corresponding AuthorCorresponding Author Corresponding Author::::
Masud Yunesian
Email: [email protected]
linked the indoor and outdoor short and
long-term air pollution exposures to the considerably
significant acute and chronic adverse health
effects,
1,2particularly studies on development of
asthma,
3respiratory and cardiovascular diseases,
4birth outcomes and developmental effects,
5leukemia,
6mortality,
7,8and even neighborhood
walkability.
9Generally, albeit these studies
collected a very large datasets on health
outcomes, air pollution exposure assessment has
been a challenge in the majority of the
epidemiological studies.
10-12Though personal
monitoring through several consecutive days in
studies with less than hundreds of subjects has
assessed short-term exposures, it has still been a
serious challenge as the study population
increases. However, since epidemiological studies
on long-term air pollution exposures need only
annual (or any other long-term average) exposure
concentrations, and ideally as close to the
individual-level as possible, and even more
because their study population mainly comprises
several hundreds to thousands of subjects, the
mere monitoring will not be feasible.
12-15Initial
epidemiological surveys have assigned only one
average exposure to all the participants in a large
geographical area, and assumed that the
concentration of the pollutant of interest is
homogeneous throughout the whole such an area.
However, various investigations have now
demonstrated that there is a considerable
difference on a very small-scale in the ambient air
pollution
concentrations.
16-18Consequently,
individual-scale
exposure
assessment
is
warranted to minimize exposure misclassification
in epidemiological studies.
19Hence, various
approaches have been used in recent years to
capture small-scale spatial variations of outdoor
air pollution, which are described elsewhere.
20-22More recently, land use regression (LUR)
modeling -which is classified as geospatial
modeling techniques- has been developed and
emerged as a successful approach to predict
neighborhood-scale air pollution exposures, even
better than kriging and dispersion models.
21,23,24Initially, this technique was applied in Europe,
25but recently several applications have been
reported in North America,
26-28China,
29and
Japan.
19As part of the future LUR models
development, this study aimed to analyze the
association of different land use and traffic
measures with air pollutant concentrations in
Tehran, Iran.
Materials and Methods
The study area encompassed Tehran, Iran, with
approximately 613 square kilometers study area
(Figure 1). Tehran is the largest city in Iran and
suffers
from
extreme
air
pollution
concentrations. The population of the city is
about 9 million people, albeit it would be much
higher during daily time hours.
30The data of air pollutant concentrations for
2010 were extracted from 23 air quality monitors
belong to Air Quality Control Company (AQCC)
and Department of Environment (DOE). These
included particulate matter with aerodynamic
diameter of 10 micrometer or smaller (PM
10),
sulfur dioxide (SO
2), and nitrogen dioxide (NO
2).
Data were purified in Microsoft Office Excel and
then were imported to the R statistical
software.
31The missing data were imputed using
AMELIA program.
32The data of land use and traffic measures
have been originated from a study on seismic
micro-zoning of Greater Tehran area.
33The land
use was in ten categories including: 1.
residential, 2. green space, 3. urban facilities, 4.
industrial
or
workshop,
5.
official
or
commercial, 6. transportation, 7. military, 8.
arable, 9. arid or undeveloped and finally 10.
other land use areas. The total length of the
land use types were considered for analyses
within circular buffer radii 100 to 500 meters
and distances of the air quality monitors toward
them. The traffic measure variables were
surrogates of traffic including length of the
streets, highways, bridges, and all roads within
the circular buffer radii 100 to 1000 meters
around the air quality monitoring stations and
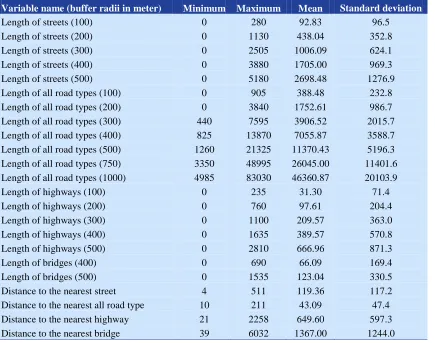
distances away (Figure 2) (Table 1). All these
variables were calculated and analyzed in
Geographic Information System (GIS) using
ArcGIS® 9.3 (ESRI®, Redlands, CA, USA).
Figure 1. Study area of Tehran, Iran
Table 1. Summary of the traffic measures variables
Variable name Buffer radii (m) around monitors
Length of streets 100, 200, 300, 400, 500
Length of highways 100, 200, 300, 400, 500
Length of bridges 400, 500
Length of all road types 100, 200, 300, 400, 500, 750, 1000
Distance to streets -
Distance to highways -
Distance to bridges -
Distance to all road types -
maximum, minimum and median of which
were plotted by the box plots. Descriptive
statistics were also calculated for all the traffic
measures and land use type variables.
Thereafter, the correlations of the measured air
pollutant concentrations were calculated with
all the land use types and traffic surrogate
measures. The p-value less than 0.05 set as a
significant level in all the statistical analyses.
All the statistical analyses were performed by
Stata Statistical Software, Release 12.0 (Stata
Corporation, College Station, TX, USA) and R
statistical software.
Results and Discussion
In this study, it was tried to analyze the
associations of different land use and traffic
measures with air pollutant concentrations as
part of the future land use regression models
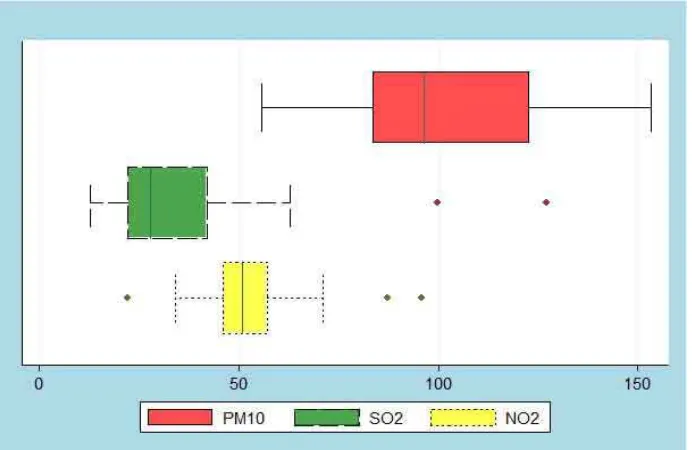
development in Tehran, Iran. The annual
average concentrations of PM
10, SO
2and NO
2were 100.8 µg/m
3, 38 parts per billion (ppb),
and
53.2
ppb,
respectively.
Meanwhile,
descriptive statistics of the air pollutants
concentrations are shown in figure 3. Moreover,
descriptive statistics of all traffic measures are
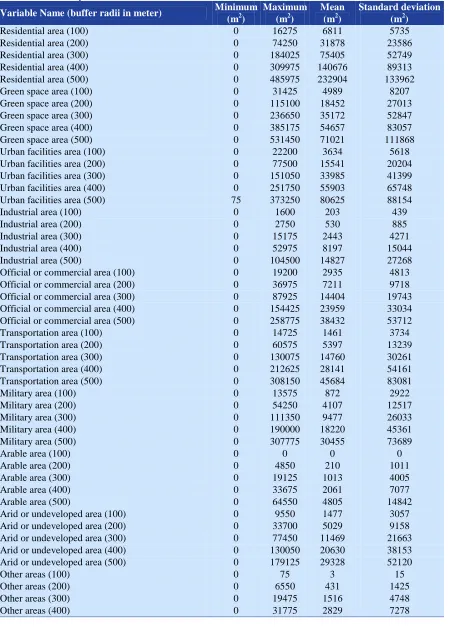
tabulated in table 2. In addition, descriptive
statistics of all the land use variables are
tabulated in table 3.
The air pollutant concentration in Tehran is
much higher than other contexts of the world
where land use regression models have been
Table 2. Summary of the traffic surrogates variables
Variable name (buffer radii in meter) Minimum Maximum Mean Standard deviation
Length of streets (100) 0 280 92.83 96.5
Length of streets (200) 0 1130 438.04 352.8
Length of streets (300) 0 2505 1006.09 624.1
Length of streets (400) 0 3880 1705.00 969.3
Length of streets (500) 0 5180 2698.48 1276.9
Length of all road types (100) 0 905 388.48 232.8
Length of all road types (200) 0 3840 1752.61 986.7
Length of all road types (300) 440 7595 3906.52 2015.7
Length of all road types (400) 825 13870 7055.87 3588.7
Length of all road types (500) 1260 21325 11370.43 5196.3
Length of all road types (750) 3350 48995 26045.00 11401.6
Length of all road types (1000) 4985 83030 46360.87 20103.9
Length of highways (100) 0 235 31.30 71.4
Length of highways (200) 0 760 97.61 204.4
Length of highways (300) 0 1100 209.57 363.0
Length of highways (400) 0 1635 389.57 570.8
Length of highways (500) 0 2810 666.96 871.3
Length of bridges (400) 0 690 66.09 169.4
Length of bridges (500) 0 1535 123.04 330.5
Distance to the nearest street 4 511 119.36 117.2
Distance to the nearest all road type 10 211 43.09 47.4
Distance to the nearest highway 21 2258 649.60 597.3
Distance to the nearest bridge 39 6032 1367.00 1244.0
reported.
10,27,34-36In Tehran, the PM
10pollutant
was associated with transportation area within
buffer radii 100, 200, 300, 400 and 500 meters;
with other area land use within buffer of 500
meters; and with distance to the other nearest
land use (P < 0.05). The SO
2concentration was
associated with official or commercial land use
area within buffer radii 300, 400, and 500 meters;
and with other area land use within buffer of
100, 200, 300, 400 and 500 meters (P < 0.05).
Noteworthy,
the
NO
2concentration
was
associated with official or commercial land use
area within buffer radii 200, 300, 400, and 500
meters; and with other area land use within
buffer of 100 meters (P < 0.05).
These variables have been studied in other
cities of the world. In other parts of the world,
these pollutants have been associated mainly
with traffic counts or surrogates of the traffic.
12As shown in figure 2, the official or commercial
land use areas are mainly located close to streets,
roads, and highways where they are highly
correlated with traffic counts. Thus, the
significant associations of SO
2and NO
2with
official
or
commercial
land
use
areas
demonstrated that traffic, indirectly, is the origin
of these pollutants. This is in line with the results
of other studies around the globe.
12,21Table 3. Summary of all the land use variables
Variable Name (buffer radii in meter) Minimum
(m2)
Maximum (m2)
Mean (m2)
Standard deviation (m2)
Residential area (100) 0 16275 6811 5735
Residential area (200) 0 74250 31878 23586
Residential area (300) 0 184025 75405 52749
Residential area (400) 0 309975 140676 89313
Residential area (500) 0 485975 232904 133962
Green space area (100) 0 31425 4989 8207
Green space area (200) 0 115100 18452 27013
Green space area (300) 0 236650 35172 52847
Green space area (400) 0 385175 54657 83057
Green space area (500) 0 531450 71021 111868
Urban facilities area (100) 0 22200 3634 5618
Urban facilities area (200) 0 77500 15541 20204
Urban facilities area (300) 0 151050 33985 41399
Urban facilities area (400) 0 251750 55903 65748
Urban facilities area (500) 75 373250 80625 88154
Industrial area (100) 0 1600 203 439
Industrial area (200) 0 2750 530 885
Industrial area (300) 0 15175 2443 4271
Industrial area (400) 0 52975 8197 15044
Industrial area (500) 0 104500 14827 27268
Official or commercial area (100) 0 19200 2935 4813
Official or commercial area (200) 0 36975 7211 9718
Official or commercial area (300) 0 87925 14404 19743
Official or commercial area (400) 0 154425 23959 33034
Official or commercial area (500) 0 258775 38432 53712
Transportation area (100) 0 14725 1461 3734
Transportation area (200) 0 60575 5397 13239
Transportation area (300) 0 130075 14760 30261
Transportation area (400) 0 212625 28141 54161
Transportation area (500) 0 308150 45684 83081
Military area (100) 0 13575 872 2922
Military area (200) 0 54250 4107 12517
Military area (300) 0 111350 9477 26033
Military area (400) 0 190000 18220 45361
Military area (500) 0 307775 30455 73689
Arable area (100) 0 0 0 0
Arable area (200) 0 4850 210 1011
Arable area (300) 0 19125 1013 4005
Arable area (400) 0 33675 2061 7077
Arable area (500) 0 64550 4805 14842
Arid or undeveloped area (100) 0 9550 1477 3057
Arid or undeveloped area (200) 0 33700 5029 9158
Arid or undeveloped area (300) 0 77450 11469 21663
Arid or undeveloped area (400) 0 130050 20630 38153
Arid or undeveloped area (500) 0 179125 29328 52120
Other areas (100) 0 75 3 15
Other areas (200) 0 6550 431 1425
Other areas (300) 0 19475 1516 4748
Table 3. Summary of all the land use variables (Continues)
Variable name (buffer radii in meter) Minimum
(m2)
Maximum (m2)
Mean (m2)
Standard deviation (m2)
Other areas (500) 0 45100 5108 10681
Distance to nearest residential land use 0 622 96 153
Distance to nearest green space land use 0 1351 161 299
Distance to nearest urban facilities land use 0 482 95 107
Distance to nearest industrial or workhouse land use 36 990 345 277
Distance to nearest commercial or official land use 0 710 124 178
Distance to nearest transportation land use 0 1716 435 460
Distance to nearest military land use 7 3934 984 1041
Distance to nearest arable land use 130 4235 1478 1184
Distance to nearest arid or undeveloped land use 0 1906 335 433
Distance to nearest other land use 47 6831 1719 2022
Conflict of Interests
Authors have no conflict of interests.
Acknowledgements
This study was part of the MSPH thesis
completed by Hassan Amini in Environmental
Health Engineering, and has been supported by
Tehran University of Medical Sciences (grant
number 89-10-18-240.3646) and Tehran Urban
Planning and Research Center. The authors
acknowledged the following for assistance in
various parts of the project: Majid Ramezani
Mehrian, Mohammad Sadegh Hassanvand,
Meinolf Drueeke, Ali Hosseini, Hossein Nasiri,
Mohammad Ali Najafi, Arash Atri, Mohammad
Hossein
Sowlat,
and
numerous
other
contributors. Hereby, many thanks go to the Air
Quality Control Company and Department of
Environment for providing air pollution data.
Noteworthy, we extend our sincerest gratitude to
Drs. Gerard Hoek, Michael Brauer, and Sarah B.
Henderson for their extensive help and guidance
during the work and comments on previous
versions of the paper. The authors acknowledged
reviewers for their valuable feedback.
References
1. Brunekreef B, Holgate ST. Air pollution and health. Lancet 2002; 360(9341): 1233-42.
2. Yunesian M, Asghari F, Vash JH, Forouzanfar MH, Farhud D. Acute symptoms related to air pollution in
urban areas: a study protocol. BMC Public Health 2006; 6: 218.
3. Clark NA, Demers PA, Karr CJ, Koehoorn M, Lencar C, Tamburic L, et al. Effect of early life exposure to air pollution on development of childhood asthma. Environ Health Perspect 2010; 118(2): 284-90.
4. Hosseinpoor AR, Forouzanfar MH, Yunesian M, Asghari F, Naieni KH, Farhood D. Air pollution and hospitalization due to angina pectoris in Tehran, Iran: a time-series study. Environ Res 2005; 99(1): 126-31. 5. Malmqvist E, Rignell-Hydbom A, Tinnerberg H, Bjork
J, Stroh E, Jakobsson K, et al. Maternal exposure to air pollution and birth outcomes. Environ Health Perspect 2011; 119(4): 553-8.
6. Amigou A, Sermage-Faure C, Orsi L, Leverger G, Baruchel A, Bertrand Y, et al. Road traffic and childhood leukemia: the ESCALE study (SFCE). Environ Health Perspect 2011; 119(4): 566-72.
7. Hoek G, Fischer P, Van Den Brandt P, Goldbohm S, Brunekreef B. Estimation of long-term average exposure to outdoor air pollution for a cohort study on mortality. J Expo Anal Environ Epidemiol 2001; 11(6): 459-69.
8. Hoek G, Brunekreef B, Goldbohm S, Fischer P, van den Brandt PA. Association between mortality and indicators of traffic-related air pollution in the Netherlands: a cohort study. Lancet 2002; 360(9341): 1203-9.
9. Marshall JD, Brauer M, Frank LD. Healthy neighborhoods: walk ability and air pollution. Environ Health Perspect 2009; 117(11): 1752-9.
10.Molter A, Lindley S, de Vocht F, Simpson A, Agius R. Modeling air pollution for epidemiologic research--Part I: A novel approach combining land use regression and air dispersion. Sci Total Environ 2010; 408(23): 5862-9. 11.Marshall JD, Nethery E, Brauer M. Within-urban
42(6): 1359-69.
12.Hoek G, Beelen R, de Hoogh K, Vienneau D, Gulliver J, Fischer P, et al. A review of land-use regression models to assess spatial variation of outdoor air pollution. Atmospheric Environment 2008; 42(33): 7561-78.
13.Brook RD, Shin HH, Bard RL, Burnett RT, Vette A, Croghan C, et al. Exploration of the rapid effects of personal fine particulate matter exposure on arterial hemodynamics and vascular function during the same day. Environ Health Perspect 2011; 119(5): 688-94. 14.Liao D, Peuquet DJ, Duan Y, Whitsel EA, Dou J,
Smith RL, et al. GIS approaches for the estimation of residential-level ambient PM concentrations. Environ Health Perspect 2006; 114(9): 1374-80.
15.Naghizadeh A, Mahvi AH, Jabbari H, Derakhshani E, Amini H. Exposure assessment to dust and free silica for workers of Sangan iron ore mine in Khaf, Iran. Bull Environ Contam Toxicol 2011; 87(5): 531-8.
16.Beelen R, Voogt M, Duyzer J, Zandveld P, Hoek G. Comparison of the performances of land use regression modelling and dispersion modelling in estimating small-scale variations in long-term air pollution concentrations in a Dutch urban area. Atmospheric Environment 2010; 44(36): 4614-21.
17.Kingham S, Briggs D, Elliott P, Fischer P, Erik L. Spatial variations in the concentrations of traffic-related pollutants in indoor and outdoor air in Huddersfield, England. Atmospheric Environment 2000; 34(6): 905-16.
18.Lebret E, Briggs D, van Reeuwijk H, Fischer P, Smallbone K, Harssema H, et al. Small area variations in ambient NO2 concentrations in four European areas. Atmospheric Environment 2000; 34(2): 177-85. 19.Kashima S, Yorifuji T, Tsuda T, Doi H. Application of
land use regression to regulatory air quality data in Japan. Sci Total Environ 2009; 407(8): 3055-62. 20.Vienneau D, de Hoogh K, Beelen R, Fischer P, Hoek
G, Briggs D. Comparison of land-use regression models between Great Britain and the Netherlands. Atmospheric Environment 2010; 44(5): 688-96. 21.Jerrett M, Arain A, Kanaroglou P, Beckerman B,
Potoglou D, Sahsuvaroglu T, et al. A review and evaluation of intraurban air pollution exposure models. J Expo Anal Environ Epidemiol 2005; 15(2): 185-204. 22.Dijkema MB, Gehring U, van Strien RT, van der Zee
SC, Fischer P, Hoek G, et al. A comparison of different approaches to estimate small-scale spatial variation in outdoor NO(2) concentrations. Environ Health Perspect 2011; 119(5): 670-5.
23.Su JG, Jerrett M, Beckerman B, Wilhelm M, Ghosh JK, Ritz B. Predicting traffic-related air pollution in Los Angeles using a distance decay regression selection strategy. Environ Res 2009; 109(6): 657-70.
24.Clougherty JE, Wright RJ, Baxter LK, Levy JI. Land use regression modeling of intra-urban residential variability in multiple traffic-related air pollutants. Environ Health 2008; 7: 17.
25.Briggs DJ, Collins S, Elliott P, Fischer P, Kingham S, Lebret E, et al. Mapping urban air pollution using GIS: a regression-based approach. International Journal of Geographical Information Science 1997; 11(7): 699-718. 26.Ryan PH, Lemasters GK, Levin L, Burkle J, Biswas P, Hu S, et al. A land-use regression model for estimating microenvironmental diesel exposure given multiple addresses from birth through childhood. Sci Total Environ 2008; 404(1): 139-47.
27.Ross Z, Jerrett M, Ito K, Tempalski B, Thurston GD. A land use regression for predicting fine particulate matter concentrations in the New York City region. Atmospheric Environment 2007; 41(11): 2255-69. 28.Novotny EV, Bechle MJ, Millet DB, Marshall JD.
National satellite-based land-use regression: NO2 in the United States. Environ Sci Technol 2011; 45(10): 4407-14.
29.Chen L, Baili Z, Kong S, Han B, You Y, Ding X, et al. A land use regression for predicting NO2 and PM10 concentrations in different seasons in Tianjin region, China. J Environ Sci (China) 2010; 22(9): 1364-73. 30.Statistical Centre of Iran. Estimated Population of
Country Cities for 2010 [Online]. 2012 [cited 2012
Aug 1]; Available from: URL:
http://www.amar.org.ir/Default.aspx?tabid=339&agent Type=View&PropertyID=1130 [In Persian].
31.R Development Core Team. R: A Language and Environment for Statistical Computing. Vienna, Austria: R Foundation for Statistical Computing; 2009. 32.Honaker J, King G, Blackwell M. Amelia II: A
Program for Missing Data. Journal of Statistical Software 2011; 45(7): 1-47.
33.JICA and CEST. The study on seismic micro-zoning of the greater Tehran area in the Islamic Republic of Iran [Online]. 2001; Available from: URL: http://www.vojoudi.com/earthquake/jica [In Persian]. 34.Henderson SB, Beckerman B, Jerrett M, Brauer M.
Application of land use regression to estimate long-term concentrations of traffic-related nitrogen oxides and fine particulate matter. Environ Sci Technol 2007; 41(7): 2422-8.
35.Sangrador JL, Nuñez MC, Villarreal A B, Cadena LH, Jerrett M, Romieu I. A Land Use Regression Model for Predicting PM2.5 in Mexico City. Epidemiology 2008; 19(6): 259.