Contrasted effects of biochar on maize growth and N use efficiency depending
on soil conditions**
Qiaohong Zhu1,2, Xinhua Peng1*, and Taiqing Huang3
1State Key Laboratory of Soil and Sustainable Agriculture, Institute of Soil Science, Chinese Academy of Sciences, Nanjing 210008, China
2University of Chinese Academy of Sciences, Beijing 100049, China
3Agricultural Resource and Environment Research, Guangxi Academy of Agricultural Sciences, 530007, China
Received November 5, 2014; accepted February 26, 2015
*Corresponding author e-mail: [email protected]
**This work was supported by the National Key Technology Research and Development Program of China (2011BAD31B04) and Natural Science Foundation of China (41371235).
A b s t r a c t.Biochar amendment may improve crop growth through its nutrients and indirect fertility. However, this improve-ment varies in a wide range of biochars, crops, and soils. Our objectives were to determine the response of crop growth to bio- char amendment and to assess the N use efficiency relative to the biochar and the soil types. In this pot experiment, we investi- gated five typical agricultural soils in China amended with two biochars. Four treatments were designed: the soil itself as a con-trol, the soil amended with 1% biochar, the soil with fertilizer NPK, and the soil with added biochar and fertilizer. Biochar amendment increased the maize biomass and the N use efficiency in the red soil (p<0.05) but not in the other four soils (p>0.05). In the red soil, the biomass under biochar+NPK was 2.67-3.49 times higher than that of only NPK, and 1.48-1.62 times higher than that of only biochar amendment, 21-36 and 35-42% of which were contributed from biochar fertility and indirect fertility, respective-ly. This study indicates that biochar amendment is very plausible for the red soil but has a minor or even negative effect on the other four soils in China.
K e y w o r d s: biochar, maize, N use efficiency, soil fertility
INTRODUCTION
Biochar is produced by incomplete combustion of biomass in the absence of oxygen and is predominantly composed of aromatic compounds that are largely resistant to biological degradation. Recently, biochar has received increasing attention because it is believed to increase soil carbon sequestration (Lehmann, 2007; Lu et al., 2014; Luo
et al., 2014) and to improve soil fertility (Glaser et al., 2002; Steiner et al., 2007). In other words, biochar may offer a win-win technology to mitigate global warming and food security.
The varied effects of biochar on agronomic performan- ce are very strongly influenced by the specific chemical and physical characteristics of the material as well as the site-specific soil biochar interactions. Thus, it is a challenge to predict the exact effect of particular biochars on soil physico- chemical properties and crop yield. Generally, favourable effects of biochar applications on soil quality and crop pro- ductivity have been certified on highly weathered, nutri-ent-poor tropical soil, eg Oxisol, Ultisol, ferrosol (Clough
et al., 2010; Glaser et al., 2002). For example, a positive response as a result of biochar amendment has been report-ed for upland rice in northern Laos (Asai et al., 2009),
Hordeum sativum (Karer et al., 2013), rice and sorghum in central Amazonia (Steiner et al., 2007), soybean and radish in eastern Australia (Van Zwieten et al., 2009). On the other hand, many negative responses have also been found for wheat and radish in calcarosol (Van Zwieten et al., 2009) and soybean in volcano ash soil. In addition, field studies have indicated that biochar addition to temperate region soils causes small and transient changes in agroecosystems where native soil fertility is sufficiently high (Gueerena et al., 2013; Karer et al,. 2013), which implies that the key is to solve the inherent problem of productivity constrains by biochar application.
The positive effect of biochar on crop yield is mainly attributed to biochar own nutrients and indirect fertility. The direct and indirect fertility functions were referred to soil fertilizer and soil conditioner, respectively (Glaser et al., 2002; Peng et al., 2011). As a soil fertilizer, biochar itself may contain valuable nutrients, particularly K, Ca, Mg, and so on. Peng et al. (2011) reported that the effect
of 1% biochar amendment contributed to up 30% of maize biomass increase in the Ultisol (2011). Many researchers agree that the indirect effect plays a critical role in improv-ing soil fertility. The biochar alkalinity may improve the soil pH (Oguntunde et al. 2008) and the high surface area enhancing CEC (Liang et al., 2006; Oguntunde et al., 2004). A highly porous internal structure can also act as a soil con-ditioning agent that can increase soil water holding capacity, lower bulk density, change the pore size distribution, and potentially enhance the availability to plants on medium by reducing soil strength and nutrient leaching (Asai et al., 2009; Chan et al., 2007; Oguntunde et al., 2008). These benefits eventually improve the nutrient use efficiency as well as crop growth; however, very few data are available to give solid evidence that biochar amendment into soil improves the N use efficiency through the direct and/or indirect fertility. We hypothesize that the two effects of bio-char (a direct effect as a soil fertilizer and an indirect effect as a soil conditioner) on crops further depend not only on its characteristics but also on specific soil properties.
In this study, we selected five typical soils across a wide range of climate conditions that are used for main agricul-tural production in China. These soils also present a wide range of soil properties. Two different biochars were ap- plied into soils to investigate maize growth and the N use efficiency in a 40 day pot experiment. Our aims were to determine the response of crop growth to biochar amend-ment, to evaluate the direct and indirect effects of biochar on crop growth, and to assess the N use efficiency relative to the biochar type and the soil type. This study is the first to test five typical Chinese agricultural soils, so that our results may clearly provide some useful information for biochar application.
MATERIALS AND METHODS
In this study, five soils typically used for agriculture production in China were investigated. They are red soil, chaotu soil, black soil, loess, and purple soil in the tradi-tional Chinese pedogenesis classification (Gong et al., 2007), corresponding to Phinthosols, Gleyic Cambisols, Chernozems, Calcic Cambisols, and Regosols (FAO, 2006),
respectively. Their sites covering the main climatic regions in China are listed in Table 1, where the annual rainfall is from 550 to 1 795 mm and the average temperature is from 1.5 to 17.6oC.
None of the soils has been fertilized before sampling. The samples were collected from the 0-20 mm horizon in late spring 2011. The soil sample was ground to pass through a 2 mm sieve for determining soil properties and for the pot experiment. Soil properties were determined using routine methods (Soil Survey Laboratory Methods Manual, 2004). Soil pH was measured at a soil:water ratio of 1:2.5 (weight/weight). Soil organic carbon was determined by oxidation with potassium dichromate; cation exchange capacity (CEC) was measured by the ammonium acetate method. Total soil C and N concentrations were determined using an elemental analyser (vario MAX CN, elementar, Germany). Particle size distribution was determined by the pipette method.
Two biochars were prepared with different procedures. Biochar 1 (BC1) was produced from rice straw (Oryza sati-va) using a muffle furnace. The rice straw was dried at 60oC
for 24 h and milled to <2 mm. The <2 mm fraction was placed in a sealed ceramic crucible and underwent pyroly-sis in the muffle furnace with peak temperatures of 400oC
for 4 h. Biochar 2 (BC2) was produced from rice straw after charring in the BC reactor at the peak temperature of 400oC for 4 h under limited oxygen (China patent No.
ZL200920232191.9). Before being moved into the reactor, the rice straw was oven-dried at 80oC for 12 h. The reactor
was heated in a step-wise procedure and finally to the target 400oC. The characteristics of the two biochars were
exam-ined chemically and physically with a number of methods. The pH, C, N, P, and K contents of the biochars were deter-mined by the methods used for soil properties as mentioned above but the ratio of water to the biochar was 1:5 for the pH measurement. Volatile matter and ash content were deter-mined by a modified ASTM method (D-1762-84) involving measurement of weight loss following combustion of about 10 g of biochar in a ceramic crucible at 900oC for 6 min
and 750oC for 6 h, respectively. Specific surface area (SSA)
was measured by N2 gas adsorption with a V-Sorb 2800P T a b l e 1. Locations of soils and their climate conditions
Soils Sites FAO Annual rainfall (mm) Average temperature (oC)
Red soil Yingtan (28o15'N, 116o55'E) Plinthosols 1 795 17.6
Chaotu soil Fengqiu (35o00'N, 114o24'E) Gleyic Cambisols 605 13.9
Black soil Hailun (47o26'N, 126o38'E) Chernozems 550 1.5
Loess Changwu (35o12'N, 107o40'E) Calcic Cambisols 584 9.1
instrument (Gold App Instrument, China). The SSA was calculated according to the BET equation from at least 13 measurements recorded in the relative pressure range of 0.05-0.30. Prior to the measurement, water was removed from the sample surface by outgassing for 16 h in vacuum under helium flow at 40oC.
The two biochars were thoroughly mixed with 2 kg soil at an incorporation rate of 1% by dry weight and packed to a bulk density of 1.2 g cm-3, which was equivalent to a
bio-char amendment of 24 t ha-1 into a 20 cm plough layer. Due
to limitation of soils, only Red soils, chaotu soil, and black soil were amended with the two biochars, BC1 and BC2, and loess and purple soil with only BC1 (Table 2). For each soil amended with one biochar, there were four treatments: the soil without the biochar and the fertilizer as a control (CK), the soil amended with 1% biochar (BC1, BC2), the soil fertilized with 0.15 g kg-1 15N, 0.1 g kg-1 P
2O5, and
0.15 g kg-1 K
2O (NPK), and the soil added with biochar
and the fertilizer (BC1NPK, BC2NPK). Each treatment was performed in triplicate. The 15N, P, and K fertilizers
used were (15NH
4)2SO4, Ca(H2PO4)2, and KCl, respectively.
A total of 78 pots (210 mm in diameter, 135 mm in height) were prepared in this study. Three maize (Zea mays) seeds were sown at a depth of approximately 5 cm per pot on July 24, 2011, and thinned to the most vigorous following ger-mination. During the growth period, the soil water contents were kept at 60% of field capacity and were corrected daily by weight. After 40 days post-germination, plant materials above and below ground were harvested and placed into an oven at 105oC for 30 min for enzyme deactivation. Then
they were oven-dried to a constant weight at 70oC (about
48 h) for biomass analysis and 15N determination. Soils
were also collected for further analysis.
Total N and 15N enrichment were determined with a
sta-ble isotope ratio mass spectrometer (Flash-2000 DELTA V Advantage, Thermo Fisher). The N use efficiency (NUE) was calculated as follows (Eq. (1)):
, 100 % 1155
excess f f excess p p N N N N NUE − − = (1)
where: Np is the total N uptake in the plant in fertilizer application treatments (ie NPK and BC+NPK), 15N
p-excess is
the 15N abundance excess in the plant, 15N
f-excess is the 15N
abundance excess in the applied fertilizer (9.636 atom-excess%), and Nf is the dose of applied fertilizer in each pot, eg 0.3 g per plot in this study.
The N retained in the soil (NRS) was calculated as fol-lows (Eq. (2)):
, 100 % 1155
excess f f excess s s N N N N NRS − − = (2)
where: Ns is the total N remaining in the soil under ferti-lizer application (ie NPK and BC+NPK), 15N
s-excess is the 15N
abundance excess in the soil.
The 15N loss (%) via gaseous emission and/or water
lea-chate was calculated as follows (Eq. (3)):
15N loss (%) = 100 – 15N use efficiency (%)
– 15N retained in soil (%). (3)
Taking the BC+NPK treatment as an example, the contri- butions of the biochar and the fertilizer to biomass (includ-ing shoot and roots) was calculated as follows (Peng et al., 2011).
The contribution of the soil to the biomass is (Eq. (4)):
. 100 (%) NPK C B K C soil Biomass Biomass n o Contributi + = (4)
The contribution of the fertilizer to the biomass is (Eq. (5)): . 100 (%) NPK C B K C NPK fertilizer Biomass Biomass Biomass n o Contributi + − = (5)
The contribution of the biochar as a fertilizer is (Eq. (6))
. 100 (%) NPK C B K C C B fertilizer biochar Biomass Biomass Biomass n o Contributi + − −
= (6)
The contribution of the biochar as a conditioner is (Eq. (7)): . 100 (%) NPK C B K C C B fertilizer biochar Biomass Biomass Biomass n o Contributi + − − = (7)
Analysis of variance (ANOVA) was used to test the effect of biochars on soil properties (eg pH, CEC) and agro-nomic performance (eg biomass, 15N excess abundance,
and N use efficiency). The least significant difference (LSD at p < 0.05) test was applied to assess the differences among the means of three replications (n=3).
T a b l e 2. Treatments of soils amended with biochars and/or NPK fertilizer. CK is control without biochar and NPK fertilizer
Treatments Red soil Chaotu soil Black soil Loess Purple soil
CK
BC1
BC2
NPK
BC1NPK
RESULTS
Five soils investigated in this study represent the most important soil types used for agriculture production in China. Some basic soil properties are listed in Table 3. SOC and total N are the highest in the black soil but nearly simi-lar for the other four soils. The red soil and black soil are acidic and the other three soils are slightly alkaline. CEC is the lowest for the red soil but is the highest for the black soil. Briefly, these soil properties indicate that the red soil is the most infertile, and the black soil is the most fertile.
The physical and chemical properties of the two bio-chars are presented in Table 4. Rice straw derived biobio-chars (BC1 and BC2) present similar properties, while BC2 is richer in total C, total K, ash, and volatile compounds.
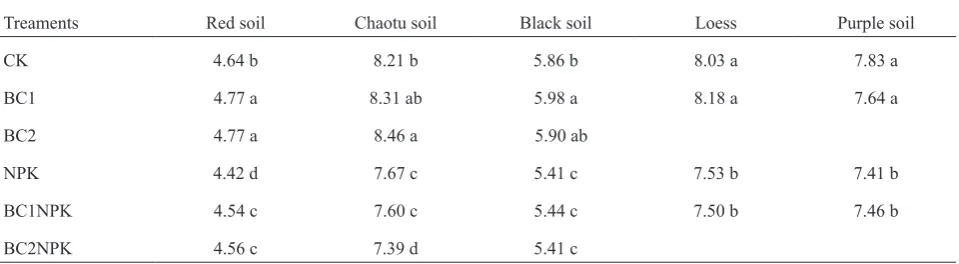
Table 5 shows the effect of biochar on soil pH after incubation. Both the biochars improved the red soil pH sig-nificantly (p<0.05), which was not observed in the other four soils. The pH values of chaotu soil were improved sig-nificantly only by BC2 and black soil only by BC1 (p<0.05). The BC1 did not significantly change the pH of the loess and purple soil (p>0.05). The NPK application decreased pH significantly for all the soils (p<0.05). Under NPK applica- tion, only the red soil exhibited improvement of its pH by biochar amendment (p<0.05), while the other four soils did not show any changes. Table 6 shows that the biochar amendment did not increase soil CEC significantly except the BC1 amendment of the red soil and chaotu soil (p>0.05).
T a b l e 3. Chemical and physical properties of soils
Soils SOC
Total
N C/N pH Total (g kg-1) Available (mg kg-1) (cmol CEC kg-1)
Sand Silt Clay
(g kg-1) P K N P K (%)
Red soil 7.54 0.70 10.80 4.10 0.30 12.20 64.4 24.0 190 7.64 40.1 27.5 32.40 Chaotu soil 10.2 0.88 11.50 8.35 0.79 16.81 80.5 15.1 187 7.68 67.0 26.3 6.70 Black soil 27.8 2.10 13.20 5.58 0.94 18.90 189 46.8 140. 31.20 9.70 52.9 37.40
Loess 7.41 0.75 9.88 8.36 0.81 18.40 52.5 16.1 112 9.26 12.1 77.6 10.30
Purple soil 10.10 0.98 10.30 8.16 0.96 18.20 84.0 13.3 122 18.30 29.1 59.2 11.70 SOC – soil organic carbon, CEC – cation exchange capacity.
T a b l e 4. Chemical and physical characteristics of biochars
Biochar
types pH (H2O) Ash (%) matter (%)Volatile (mSSA 2 g-1) (cmol kgCEC -1) Total (%) Total (g kg -1)
C N P K
BC1 9.98 38.8 20.9 4.75 12.1 43.5 1.10 2.10 59.6
BC2 9.85 48.6 30.7 4.19 13.3 49.4 1.31 2.11 63.2
SSA – specific surface area. Other explanation as in Table 3.
T a b l e 5. Soil pH in response to 1% biochar applied
Treaments Red soil Chaotu soil Black soil Loess Purple soil
CK 4.64 b 8.21 b 5.86 b 8.03 a 7.83 a
BC1 4.77 a 8.31 ab 5.98 a 8.18 a 7.64 a
BC2 4.77 a 8.46 a 5.90 ab
NPK 4.42 d 7.67 c 5.41 c 7.53 b 7.41 b
BC1NPK 4.54 c 7.60 c 5.44 c 7.50 b 7.46 b
BC2NPK 4.56 c 7.39 d 5.41 c
The biomass of maize in soils affected by the biochar types is shown in Fig. 1. For the control treatment (no bio-char and no NPK), the biomass followed this order: red soil < loess < purple soil < chaotu soil < black soil. The bio-char amendment improved biomass significantly in the red soil (p<0.05) for both the biochars. However, the biochar amendment did not improve the biomass for the other four soils (p>0.05), and even reduced it by 15-18% in the chaotu soil and by 11-14% in the black soil. The NPK application increased the biomass significantly for the black soil and purple soil (p<0.05) but this benefit was not observed in the red, chaotu, and loess soils. Only the red soil under biochar and NPK application showed a positive effect of biochar amendment on maize biomass, whereas this was not true
for the other four soils, as the biomass was even reduced significantly in the black soil (p<0.05). In the red soil, the biomass under biochar and NPK application was 2.67-3.49 times higher than that of single NPK application and 1.48-1.62 times higher than that of only biochar amendment. Table 7 shows that the above-ground biomass and total bio-mass of maize were both significantly positively related to SOC, total N, and available N.
The contribution of each source to maize growth was based on soil fertility, NPK fertilizer, biochar as a fertilizer, and biochar as a conditioner (Table 8). Taking BC1+NPK treatment as an example, the red soil contributed to only a 32% increase in the biomass, much lower than the other four soils (72-92%). The NPK application contributed to a 20-39%
T a b l e 6. Soil cation exchange capacity (CEC) (cmol kg-1) in response to 1% biochar applied in the soils
Treatments Red soil Chaotu soil Black soil Loess Purple soil
CK 8.42 b 8.19 a 32.5 a 9.26 a 18.9 a
BC1 9.20 a 8.61 a 31.2 b 9.95 a 19.1 a
BC2 8.48 b 8.52 a 31.6 ab
NPK 8.71 ab 8.13 a 32.9 ab 9.69 a 19.0 a
BC1NPK 8.94 ab 8.45 a 31.8 ab 10.0 a 19.0 a
BC2NPK 8.52 ab 8.03 a 31.9 ab
Explanations as in Table 5.
Fig. 1. Maize biomass in response to 1% biochar amendment of soils: a – without and b – with NPK application. Different letters above the columns indicate a significant difference between the treatments at p<0.05.
Total biomass (g pot
-1)
increase in the biomass with the exception of the red soil, in which it even played a slightly negative role (-3%). For the red soil, biochar as a fertilizer made a contribution of a 36% increase, close to the biochar function as a con-ditioner, contributing to a 35% increase in the biomass. Biochar plus NPK made a contribution of a 68% biomass increase. However, biochar as a fertilizer even had a detri-mental effect on maize growth in the chaotu soil, black soil, and purple soil (-3.18 to -17.2%). This negative effect of biochar as a conditioner was also observed in the black soil and purple soil. From these five soils, a remarkably positive effect was only observed in the red soil, there was a nearly null effect for loess, while a negative effect was observed in chaotu soil (-11.6 to -13.2%), black soil (-15.5 to -16.1%), and purple soil (-11.4%). These contrasting effects of bio-char amendment on maize biomass were similar between BC1 and BC2.
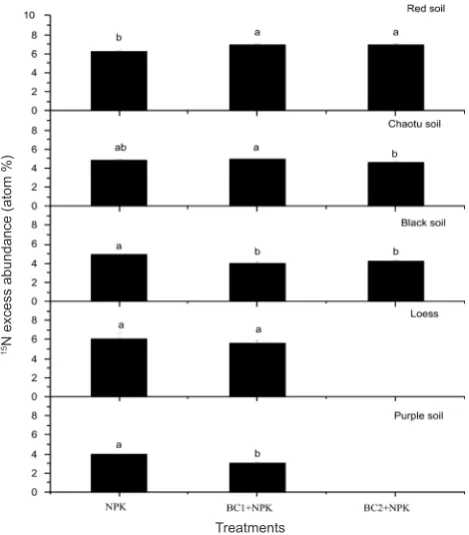
Figure 2 presents 15N excess abundance in the maize
plants. The highest 15N excess abundance was observed in
the red soil (6.16 atom %), followed by loess (6.05 atom %) and black soil (4.86 atom %), and then by chaotu soil (4.80 atom %) and purple soil (3.98 atom %). The biochar amendment increased the 15N excess abundance
signifi-cantly in the red soil (p<0.05), but not in the chaotu soil and loess; it was even decreased significantly in the black soil and the purple soil (p<0.05). For the two biochars, there was no significant difference in the 15N excess abundance. T a b l e 7. Correlation coefficients between maize biomass and soil properties before the incubation experiment (n=5)
Biomass SOC pH CEC Total Available
N P K N P K
Above-ground 0.90* 0.10 0.80 0.90* 0.70 0.67 0.89* 0.67 -0.16
Below-ground 0.84 0.16 0.68 0.83 0.66 0.65 0.83 0.61 -0.08
Total 0.89* 0.11 0.77 0.88* 0.69 0.67 0.89* 0.65 -0.14
Indicate the significant level at: *p<0.05, **p<0.01.
T a b l e 8. Contributions of each source to maize biomass
Sources Calculations between treatments Red soil Chaotu soil Black soil Loess Purple soil
Soil CK 31.4 92.0 85.6 72.3 72.3
NPK NPK-CK -2.64 19.7 30.6 23.8 39.0
BC1 fertilizer BC1-CK 36.1 -13.5 -11.6 -3.18 19.2
BC2 fertilizer BC2-CK 20.9 -17.2 -9.26
BC1 conditioner BC1NPK-NPK-(BC1-CK) 35.1 1.92 -4.49 7.07 -30.6
BC2 conditioner BC2NPK-NPK-(BC2-CK) 41.6 4.01 -6.25
Explanations as in Table 2.
Fig. 2. 15N excess abundance in maize plant from the five soils amended with 1% biochar. BC1 and BC2 are two different bio-chars. Different letters above the columns indicate a significant difference between the treatments at p<0.05.
15N excess abundance (atom %)
The total nitrogen content of the maize treatment increased in the order: black soil <loess<chaotu<red soil<purple soil, which may be the result of crop growth and soil original properties, as plants can only use nutrients from the soil and dilute their concentration at bigger biomass (Table 9). The application of biochar increased the nitrogen content only in the red soil but did not reach a significant level (p>0.05), which may imply a possibility of utilization of the biochar nutrients. Except for the red soil, NPK treat-ment resulted in the biggest content up to 17.7-27.2 g kg-1.
The BC1 addition significantly decreased the nitrogen con-tent of maize in the black soil, loess, and purple soil, while there was no effect in the red and chaotu soils under the BC1NPK treatment. Compared to the total nitrogen con-tent in maize, that in the control treatment soil was quite different following this rule: red soil<loess<chaotu<purple soil< black soil, which is the same as in the original soil (Table 10). There were no differences among the different treatments among the chaotu soil, loess, and purple soil. However, there was a decline in the nitrogen content in the chaotu and black soil with fertilization for the reason of maize utilization and the comparatively low input of
N (0.15g kg-1). The biochar amendment exerted an effect
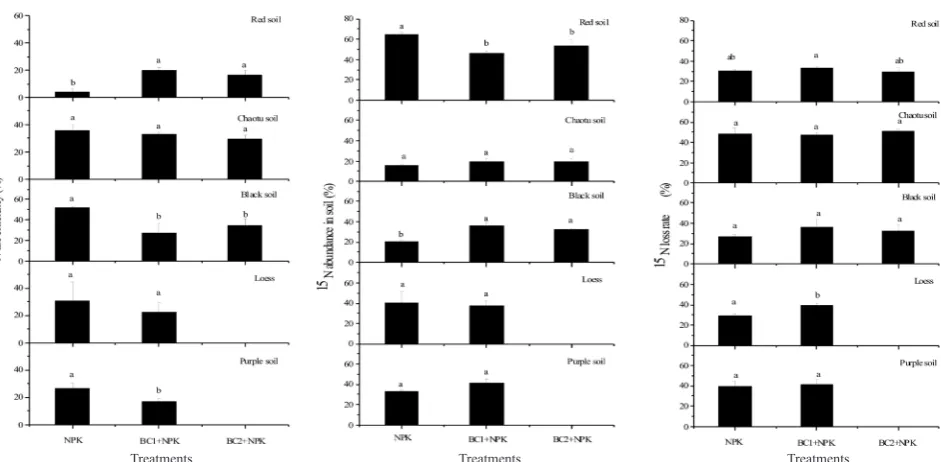
only in the red soil with and without fertilization. The N use efficiency is shown in Fig. 3. In the NPK treatment, the N use efficiency followed the order of red soil (4.5%) < purple soil (27%) < loess (31%) < chaotu soil (36%) < black soil (52%). The amendments with the biochars improved the N use efficiency up to 17-20% in the red soil. However, for the other four soils, their additions reduced it down to 30-33% in the chaotu soil, 27-35% in the black soil (p<0.05), 23% in the loess, and 17% in the purple soil (p<0.05). The N use efficiency was not significantly different between the biochar types. Compared with this trend, the 15N abundance in the five soils with the different
treatments shows an opposite trend. Consequently, the 15N
loss, which was mostly caused by nitrogen volatilization, did not vary with the biochar amendment. The correlation analysis allowed a conclusion that the N use efficiency has a significant positive relationship with maize biomass but
15N abundance in soil is significantly negatively related to
pH and biomass together with the 15N loss rate positively
related to pH (Table 11).
T a b l e 9. Nitrogen content (g kg-1) in plants after incubation for 40 days
Treatment Red soil Chaotu soil Black soil Loess Purple soil
CK 18.2cd 14.3b 9.30c 12.4c 22.0ab
BC1 14.6d 13.4b 8.37c 12.6c 19.2b
BC2 16.4d 12.7b 8.59c
NPK 21.9bc 21.8a 17.7a 27.2a 24.2a
BC1NPK 25.9ab 22.0a 12.8b 21.7b 23.2b
BC2NPK 27.6a 21.6a 15.6ab
Explanations as in Table 2.
T a b l e 10. Nitrogen content (g kg-1) in soil after incubation for 40 days
Treatment Red soil Chaotu soil Black soil Loess Purple soil
CK 0.49c 0.80a 1.85a 0.66a 0.86a
BC1 0.53bc 0.69a 1.88a 0.73a 0.93a
BC2 0.52c 0.84a 1.87a
NPK 0.57ab 0.76a 1.77b 0.73a 0.92a
BC1NPK 0.60a 0.78a 1.71b 0.73a 0.94a
BC2NPK 0.60a 0.79a 1.73b
DISCUSSION
This study presented similar effects of biochars on maize growth (Fig. 1), 15N excess abundance (Fig. 2), and
N use efficiency (Fig. 3) although their physical and chemi-cal properties were a little different (Table 4). However, the responses of maize growth in the five soils to biochar amendment were quite varied. The positive response of crop growth to biochar amendment was only observed in the acidic and highly weathered red soil but not in the other four soils (Fig. 1). These results are consistent with many previous reports (Lehmann et al., 2003; Steiner et al., 2007; van Zwieten et al., 2010), in which the application of bio-char increased crop production and fertility in acidic and highly weathered tropical soils. However, the agronomic effect of biochar in the other four typical Chinese soils (eg
chaotu soil, black soil, loess, and purple soil) was negli-gible, or even negative (Fig. 1). This paper demonstrates that the agronomic benefit of biochar largely depends on specific soil characteristics. The underlying mechanisms of biochar amendment on maize growth are discussed below.
Many researches (Glaser 2002; Steiner 2007; Van Zwieten 2010; Zhu et al., 2014) have reported that biochar amendment can improve crop growth due to changes in soil features induced by the physical and chemical properties of biochar. The major causes are the reduction of soil acidity and improvement of CEC (Blackwell, 2009). In this study, the amendment with biochar at the rate of 1% (equivalent to 24 ton ha-1) increased soil pH in the acidic soils, which
is consistent with previous studies (Cheng, 2006; Glaser, 2002; Steiner, 2007; Van Zwieten, 2010). However, this dose did not increase soil CEC significantly except the BC1 application in the red soil. The liming effect depends on soil acidity and biochar alkalinity, and it is more obvious for strongly acidic soils (Yuan and Xu, 2011). The liming effect of biochar was also proved to alleviate Al toxicity in Ferrosol and Oxisol (Steiner, 2007; Van Zwieten, 2010). The Al toxicity is generally regarded as a main limiting factor for crop plants in sub- and tropical soil, eg red soil (Fageria and Baligar, 2008), but it is not for the black soil. This is perhaps the main reason why the positive response of maize growth was observed in the red soil but not in the
Fig. 3. N use efficiency, 15N abundance in soil, and 15N loss rate in response to 1% biochar amendment in the soils. Different letters above the columns indicate a significant difference between the treatments at p<0.05.
T a b l e 11. Correlation coefficients between the N use efficiency, 15N abundance in soil, 15N loss rate, and some soil properties after the incubation experiment (n=7)
Properties pH CEC Above biomass Below biomass Total biomass
N use efficiency 0.28 0.48 0.75** 0.83** 0.82**
15N abundance in soil -0.60* -0.19 -0.68** -0.67* -0.68*
15N loss rate 0.69** -0.35 0.16 0.02 0.05
Indicate the significant level at: *p<0.05, **p<0.01.
black soil although they both are acidic. The biochars did not increase the pH of three alkaline soils due to a small dose of biochar added and the buffer of soil pH. Liang (2006) reported that the increase in CEC could be ascribed to the high surface area and charge density of the biochar itself. In addition, oxidation of aromatic C on the biochar surface to form carboxylic groups also results in an increase in CEC (Mikutta, 2005). In this study, the two biochars did not improve soil CEC significantly except the red soil amended with BC1, as the surface area of the biochar was quite low in this experiment (Table 4). Improvements of soil physical properties, such as an increase in the water-holding capa- city (Kammann, 2011) and reduction of soil strength (Chan
et al., 2007) were also provided as explanations for yield
increases with biochars. Whether the biomass increases or not depends on nutrient availability. We found that the N use efficiency had a significant positive relationship with maize biomass (Table 11). The improved N use efficiency due to the biochar amendment in the red soil significantly sup-ported the positive effect on biomass, while it was reduced in the other four soils, indicating limited N use efficiency (Fig. 3). Taghizadeh-Toosi et al. (2012) concluded that bio-char adsorbed ammonia is a bioavailable source of plant N. This improvement is ascribed to the high surface area and porous structure of biochar retaining more nutrients and reducing NO3- leaching (Glaser, 2002; Kookana, 2011;
Laird, 2010; Prendergast-Miller, 2011). Unfortunately, in this experiment, no leaching was found and nitrogen was mainly lost in the gaseous form. But in the red soil, the bio-char application increased significantly the nitrogen content in maize when combined with the fertilizer input together with high nitrogen use efficiency (Table 9, Fig. 3), proving that the high availability of the fertilizer to plant brought by the biochar was the real cause of the improvement of biomass yield. For the other four soils, the null or even negative effect of biochar on maize growth was caused by the limited N availability, as evidenced by the reduced N use efficiency and by the minor liming effect as mentioned above. The result of our study can provide direct evidence for the effect of biochar on crop growth, which depends on the N use efficiency. (Haefele, 2011) demonstrated that the beneficial effect of biochar from rice residues on grain yield depended on site-specific conditions, in which the yield decreased in fertile soils but increased in infertile soils. The result that biochar amendment can improve plant biomass in red soil (acid and infertile soil) is consistent with others results including pot and field experiments. Zhang et al. (2010) found that the rice yield was increased by 12 and 14% when fertilized by biochar at 0 and 40 t ha-1, separately.
Application of cow manure biochar at 15 and 20 t ha-1 can
significantly increase maize grain yield by 150 and 98% (Uzoma et al., 2011). The negative or positive effect of bio- char on crop growth depends on the rate of biochar addi-tion. For example, (Chan et al., 2007) reported that the dry
matter of radish was decreased at the rate of 10 t ha-1, but
was increased at 50-100 t ha-1 in Alfisol. A positive effect
of biochar application on crop growth and yield has been reported by several researchers. However, the biochar effect on the other four soil types is limited. There is no pre-vious study to compare with our results. Our results were limited to the rate of 1% biochar (equivalent to 24 t ha-1).
In the next step, the range of biochar doses and the range of biochar precursors need to be extended in further studies.
In this study, the two biochars had a similar effect on maize growth, although their characteristics were slightly dif- ferent. Compared to BC2, the technology of BC1 production can meet the needs of mass production. Since the red soil is widely distributed in southern China over ca. 113 million km2
porous and alkaline biochar can improve the fertility of the typical red soil with acidic, infertile, clayey, and dense structure. In this pot experiment, we have confirmed the feasibility of application of biochar in red soil.
CONCLUSIONS
1. Five typical Chinese agricultural soils (red soil, cha-otu soil, black soil, loess, and purple soil) amended with two different biochars were investigated. The response of maize biomass to biochar was different among the soil types but similar among the biochars. The positive effect of the biochar amendment was only observed in the red soil while the null or even negative effect was found for the other four soils. The improvement of biomass was contribu- ted by biochar fertility as well as indirect fertility as a soil conditioner.
2. Using labelled 15N technology, biochar amendment
improved the N use efficiency significantly in the red soil, but decreased it in the black soil and purple soil. We con-cluded that this positive effect of biochar was ascribed to its liming effect and the acidity of the red soil. However, the mechanisms of the negative effect are unclear although the black soil is slightly acidic.
3. This research is limited to a pot experiment but the application of biochar in the red soil is promising. More field experiments are required in the future to make a com-prehensive assessment of agronomic and environmental effects of biochar application.
REFERENCES
Asai H., Samson B.K., Stephan H.M., Songyikhangsuthor K., Homma K., Kiyono Y., Inoue Y., Shiraiwa T., and Horie T., 2009. Biochar amendment techniques for upland rice production in Northern Laos. Field Crops Res., 111(1-2), 81-84.
Blackwell P., Riethmuller G., and Collins M., 2009. Biochar application to soil. In: Biochar for Environmental Management: Science and Technology (Eds J. Lehmann, S. Joseph). Earthscan, London, UK.
Cheng C.H., Lehmann J., Thies J.E., Burton S.D., and Engelhard M.H., 2006. Oxidation of black carbon by bio- tic and abiotic processes. Organic Geochemistry, 37, 1477-1488.
Clough T.J., Bertram J.E., Ray J.L., Condron L.M., O’Callaghan M., Sherlock R.R., and Wells N.S., 2010.
Unweathered wood biochar impact on nitrous oxide emis-sions from a bovine-urine-amended pasture soil soil. Sci. Soc. Am. J., 74, 852, doi:10.2136/sssaj2009.0185
Glaser B., Lehmann J., and Zech W., 2002. Ameliorating physi-cal and chemiphysi-cal properties of highly weathered soils in the tropics with charcoal - a review. Biol. Fert. Soils, 35, 219-230, doi:10.1007/s00374-002-0466-4
Gong Z.T., Zhang G.L., and Chen Z.C., 2007. Pedogenesis and Soil Taxonomy (in Chinese). Science Press, Nanjing, China.
Gueerena D., Lehmann J., Hanley K., Enders A., and Hyland CandRiha S., 2013. Nitrogen dynamics following field application of biochar in a temperate North American maize-based production system Plant Soil, 365, 239-254, doi:10.1007/s11104-012-1383-4
Haefele S.M., Konboon Y., Wongboon W., Amarante S., Maarifat A.A., Pfeiffer E.M., and Knoblauch C., 2011.
Effects and fate of biochar from rice residues in rice-based systems. Field Crops Res., 121, 430-440.
Kammann C.I., Linsel S., Goessling J.W., and Koyro H.W., 2011. Influence of biochar on drought tolerance of Chenopodium quinoa Willd and on soil-plant relations. Plant Soil, 345, 195-210.
Karer J., Wimmer B., Zehetner F., Kloss S., and Soja G., 2013.
Biochar application to temperate soils: effects on nutrient uptake and crop yield under field conditions Agric. Food Sci., 22, 390-403.
Kookana R.S., Sarmah A.K., Van Zwieten L., Krull E., and Singh B., 2011. Biochar application to soil: agronomic and environmental benefits and unintended consequences. Advances Agronomy, 112, 103-143.
Laird D., Fleming P., Wang B., Horton R., and Karlen D., 2010.
Biochar impact on nutrient leaching from a Midwestern agricultural soil. Geoderma, 158, 436-442.
Lehmann J., 2007. Nature a handful of carbon. Nature, 447, 143-144.
Lehmann J., Pereira da Silva J., Steiner C., Nehls T., Zech W., and Glaser B., 2003. Nutrient availability and leaching in an archaeological Anthrosol and a Ferralsol of the Central Amazon basin: fertilizer, manure and charcoal amend-ments. Plant Soil, 249, 343-357.
Liang B., Lehmann J., Solomon D., Kinyangi J., Grossman J., O’Neill B., Skjemstad J.O., Thies J., Luizão F.J., Petersen J., and Neves E.G., 2006. Black carbon increases cation exchange capacity in soils. Soil Sci. Soc. Am. J., 70, 1719-1730, doi:10.2136/sssaj2005.0383
Lu W.W., Ding W.X., Zhang J.H., Li Y., Luo J.F., Bolan N., and Xie Z.B., 2014. Biochar suppressed the decomposition of organic carbon in a cultivated sandy loam soil: A nega-tive priming effect. Soil Biol. Biochem., 76, 12-21, doi:10.1016/j.soilbio.2014.04.029
Luo F., Song J., Xia W.X., Dong M.G., Chen M.F., and Soudek P., 2014. Characterization of contaminants and evaluation of the suitability for land application of maize and sludge bio-chars. Environ. Sci. Pollut. Res. Int., 21, 8707-8717, doi:10.1007/s11356-014-2797-8
Mikutta R., Kleber M., Kaiser K., and John R., 2005. Review: Organic matter removal from soils using hydrogen pero- xide, sodium hypochloride, and disodium perodisulfate. Soil Sci. Soc. Am. J., 69, 120-135.
Oguntunde P.G., Abiodun B.J., Ajayi A.E., and van de Giesen N., 2008. Effects of charcoal production on soil physical properties in Ghana. J. Plant Nutrition Soil Sci., 171, 591-596, doi:10.1002/jpln.200625185
Oguntunde P.G., Fosu M., Ajayi A.E., and van de Giesen N., 2004. Effects of charcoal production on maize yield, chemi-cal properties and texture of soil. Biol. Fert. Soils, 39, 295-299, doi:10.1007/s00374-003-0707-1
Peng X., Ye L.L., Wang C.H., Zhou H., and Sun B., 2011.
Temperature- and duration-dependent rice straw-derived biochar: Characteristics and its effects on soil properties of an Ultisol in southern China. Soil Till. Res., 112, 159-166, doi:10.1016/j.still.2011.01.002
Prendergast-Miller M., Duvall M., and Sohi S.P., 2011.
Localisation of nitrate in the rhizosphere of biochar-amend-ed soils. Soil Biol. Biochem., 43, 2243-2246.
Steiner C., Teixeira W.G., Lehmann J., Nehls T., Macêdo J.L.V., Blum W.E.H., and Zech W., 2007. Long term effects of manure, charcoal and mineral fertilization on crop produc-tion and fertility on a highly weathered Central Amazonian upland soil. Plant Soil, 291, 275-290, doi:10.1007/ s11104-007-9193-9
Taghizadeh-Toosi A., Clough T.J., Sherlock R.R., and Condron L.M., 2012. Biochar adsorbed ammonia is bioavailable Plant Soil, 350, 57-69.
Uzoma K., Inoue M., Andry H., Fujimaki H., Zahoor A., and Nishihara E., 2011. Effect of cow manure biochar on maize productivity under sandy soil condition Soil Use Manag., 27, 205-212.
Van Zwieten L., Kimber S., Morris S., Chan K.Y., Downie A., Rust J., Joseph S., and Cowie A., 2009. Effects of biochar from slow pyrolysis of papermill waste on agronomic per-formance and soil fertility. Plant Soil, 327, 235-246, doi:10.1007/s11104-009-0050-x
Yuan J.H. and Xu R.K., 2011. The amelioration effects of low temperature biochar generated from nine crop residues on an acidic Ultisol Soil Use Manag., 27, 110-115.
Zhang A., Cui L., Pan G., Li L., Hussain Q., Zhang X., Zheng J., and Crowley D., 2010. Effect of biochar amendment on yield and methane and nitrous oxide emissions from a rice paddy from Tai Lake plain. China Agric. Ecosystems Environ., 139, 469-475, doi:10.1016/j.agee.2010.09.003