tumor cells by flow cytometry
Alexia Lopresti, … , Claire Acquaviva, Emilie Mamessier
JCI Insight.
2019;
4(14)
:e128180.
https://doi.org/10.1172/jci.insight.128180
.
Circulating tumor cells (CTCs) provide easy, repeatable, and representative access to
information regarding solid tumors. However, their detection remains difficult because of
their paucity, their short half-life, and the lack of reliable surface biomarkers. Flow cytometry
(FC) is a fast, sensitive, and affordable technique, ideal for rare-cell detection. Adapted to
CTC detection (i.e., extremely rare cells), most FC-based techniques require a
time-consuming pre-enrichment step, followed by a 2-hour staining procedure, impeding the
efficiency of CTC detection. We overcame these caveats and reduced the procedure to less
than 1 hour, with minimal manipulation. First, cells were simultaneously fixed,
permeabilized, and then stained. Second, using low-speed FC acquisition conditions and 2
discriminators (cell size and pan-cytokeratin expression), we suppressed the
pre-enrichment step. Applied to blood from donors with or without known malignant diseases,
this protocol ensures a high recovery of the cells of interest independently of their
epithelial-mesenchymal plasticity and can predict which samples are derived from cancer donors.
This proof-of-concept study lays the bases of a sensitive tool to detect CTCs from a small
amount of blood upstream of in-depth analyses.
Technical Advance
Oncology
Find the latest version:
Conflict of interest: Beckman Coulter and the Beckman Coulter product and service marks mentioned herein are trademarks or registered trademarks of Beckman Coulter, Inc. in the United States and other countries. All other trademarks are the property of their respective owners.
Copyright: © 2019 American Society for Clinical Investigation
Submitted: February 14, 2019 Accepted: June 5, 2019 Published: July 25, 2019. Reference information:JCI Insight. 2019;4(14):e128180. https://doi. org/10.1172/jci.insight.128180.
Sensitive and easy screening for
circulating tumor cells by flow cytometry
Alexia Lopresti,1 Fabrice Malergue,2 François Bertucci,1,3 Maria Lucia Liberatoscioli,1Severine Garnier,1 Quentin DaCosta,1 Pascal Finetti,1 Marine Gilabert,3 Jean Luc Raoul,3
Daniel Birnbaum,1 Claire Acquaviva,1 and Emilie Mamessier1
1Predictive Oncology Laboratory, Cancer Research Center of Marseille (CRCM), Inserm U1068, CNRS UMR7258, Institut
Paoli-Calmettes, Aix Marseille Université, Marseille, France. 2Research, Beckman Coulter Life Sciences, Marseille,
Marseille, France. 3Service d’Oncologie Médicale, Institut Paoli-Calmettes, Marseille, France.
Introduction
In patients with malignant disease, epithelial cells can be found in the bloodstream after they have detached from the tumor mass (1, 2). The malignant nature of these cells is not always fully demon-strated, but their detection in cancer patients drastically differs from persons without malignant disease where epithelial cells are rarely found in the blood circulation. The rare cases where circulating epi-thelial cells are observed in the circulation outside malignant situations are specific situations, such as inflammatory, benign, or premalignant lesions (3–5). In these cases, the malignant characteristics of the cells are not proven and the numbers of epithelial cells observed are lower than in cancer samples. This is why epithelial cells found in the blood circulation in cancer patients are commonly termed circulat-ing tumor cells (CTCs). A test on a few milliliters of blood is sufficient to detect their presence and is predictive of disease stage and clinical outcome in patients with a malignant disease (6). CTCs can be used as a biomarker of early cancer (7) or of cancer evolution (8), including response to treatment (9). The main interest of CTCs over other blood biomarkers is that they are representative of “active” tumor sites (actively releasing cells that could potentially initiate metastases; ref. 10). They allow access in one sample to information from distant tumor site(s) (11) that can be obtained over time through easy recurrent blood sample analyses. The information they provide is limited to live tumor material, in con-trast to circulating DNA, for example, that can be released both from live and dying cells (in response to immune recognition, therapy, etc.). However, early studies have shown that CTCs are rare and with a half-life of a few hours ex vivo (10, 12, 13). Another limitation that hampers CTC detection using exist-ing technologies is the lack of specific or accurate markers to identify them. So far, these reasons have limited the characterization and the use of CTCs in clinical practice, despite their potential scientific and medical usefulness for real-time monitoring of disease evolution and therapeutic response.
Microscopic cell imaging is the current gold-standard technique to detect CTCs, but the number of mark-ers simultaneously analyzed remains low in routine use and requires very specific equipment and logistics (if
automatized); it is time-consuming to analyze (if not automatized), and requires expertise of a pathologist to analyze the data (14, 15). Reverse-transcription PCR is a simple and very sensitive tool that has been widely used for the detection of CTCs in patients with solid tumors, but its specificity is limited and information extracted from this analysis is limited and poorly quantitative (16, 17). Attempts to enumerate CTCs with fast, sensitive, and specific technologies have relied on a pre-enrichment step based on immunomagnetic detection of the epithelial cell adhesion molecule EPCAM (CD326) followed by flow cytometric analysis (18–23).
In all initial approaches, EPCAM has been at the center of attention to identify potential CTCs in subjects with malignant disease because of its accessibility at the surface of cells of interest. However, EPCAM is specific for well-differentiated epithelial cells and is one of the first epithelial markers lost on CTCs during the epithelial-to-mesenchymal transition (EMT) process (24), before other epithelial markers. The gold-standard marker to detect CTCs is cytokeratin. Cytokeratin is exclusive of epithelial cells, and is less versatile than EPCAM during EMT stages, but with the major inconvenience of being intracellular. Cytokeratin detection thus requires a classical 3-step staining procedure (surface staining, fixation/perme-abilization, and intracellular staining), increasing the processing time and manipulation steps that most certainly contribute to poor CTC detection sensitivity.
Here, we provide a simple, fast, sensitive, and specific tool to detect potential CTCs that can be comple-mented, when needed, by other in-depth analyses. We surmised that improving the rapidity of the test will
in fine impact the sensitivity of CTC recovery. For this, we used (i) flow cytometric acquisition restricted to
specific thresholds to avoid pre-enrichment steps, and (ii) a new prototype for research reagents and stain-ing procedure to simultaneously stain for surface and intracellular markers, thus decreasstain-ing the classical 3-step staining procedure (>2 hours) to a 2-step staining procedure (>45 minutes), compatible with regular
doses of antibodies (i.e., titrated for 100 μL). Our method is convenient and specific, allowing a quick but
exhaustive enumeration of potential CTCs by using gold-standard markers of epithelial cells in a direct intracellular flow cytometric assay. This method was validated in 2 series of metastatic cancers.
Results
Antibody selection to detect rare cells from epithelial origin in the blood by immunofluorescence and flow cytometry.
We chose to use a combination of markers to detect rare cells from epithelial origin in the blood. Based on data from literature, we used pan-cytokeratin, EPCAM, and VIM as the main markers to identify potential CTCs. This combination was complemented with DAPI, to select nucleated cells, and CD45 to exclude cells from the hematopoietic lineage.
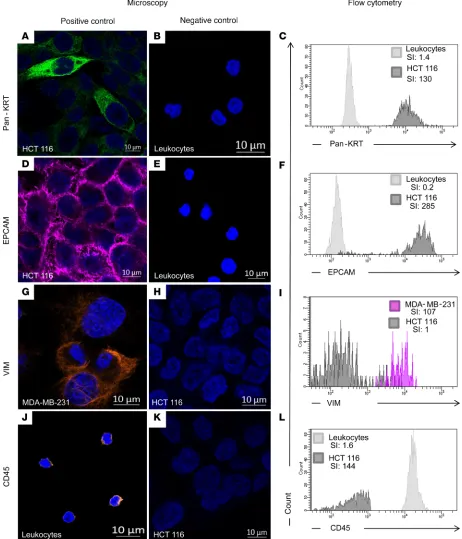
All antibodies used in the combination were first validated on cell lines with known expression for these markers by immunofluorescence and FACS to show their specificity and their compatibility with the new FACS preparation procedure (as described in the Material and Methods section). Epithelial markers (pan-cytokeratin and EPCAM) were validated on HCT 116 colon cancer epithelial cells (positive control) and leukocytes (negative control) (Figure 1, A–F). As expected, cytokeratin showed a diffuse and cytoplas-mic expression, while EPCAM was bright at the cell membrane of epithelial cells by immunofluorescence. Similarly, VIM was validated on MDA-MB-231 breast cancer mesenchymal-like cells (positive control; ref. 25)and HCT 116 cells (negative control) (Figure 1, G–I). Immunofluorescence showed that VIM had a dif-fuse, sometimes fiber-like staining, within the cytoplasm of MDA-MB-231 cells. The staining was negative in strictly epithelial cells, such as HCT 116, but slightly positive in leukocytes both in immunofluorescence and FACS. CD45 was validated on leukocytes (positive control) and HCT 116 cells (negative control) (Figure 1, J–L). CD45 labeling was indeed restricted to the cell surface of leukocytes with both techniques.
In conclusion, all required antibodies were specific and compatible with the new FACS preparation procedure.
Gating strategy to detect cells of epithelial origin irrespectively of their EMT status. The gating strategy is another
key tool for maximizing assay specificity. Indeed, for optimal detection of rare events, at least one fluores-cence marker should be negative for the rare event (exclusion gating), which would be CD45 here. More than one fluorescence marker should be used to positively identify the cells of interest (compounds gating). The FSC (forward-scattered light) and the pan-cytokeratin discriminators allowed the simultaneous enrichment and identification of our cells of interest. We also added DAPI to select for nucleated cells and to remove most of the potential contamination with debris. Using the threshold strategy described above to eliminate
most conventional white blood cells, potential CTCs were first identified as DAPI+pan-cytokeratinlo-to-hiCD45–
from the analysis any nonspecific fluorescence that would be detected in this channel (commonly referred
to as a “dump channel”). The DAPI+pan-cytokeratinlo-to-hiCD45– cells were then plotted on the APC AF750
dump channel against the phycoerythrin (PE) channel, corresponding to the VIM staining (Figure 2). Because the APC AF750 channel was free from conjugate and no compensations were required between the APC AF750 and the PE channels, all events showing a signal in the APC AF750 channel were considered nonspe-cific events. Events strictly negative for APC AF750 were selected as being potential CTCs. Events typically excluded from analysis were dead and dying cells, cell aggregates and debris, and cells with unwanted markers or characteristics. Finally, EPCAM and VIM expression was evaluated on the selected cells. In summary, the
cells of interest were selected based on DAPI+pan-cytokeratinlo-to-hi and VIM+EPCAM±.
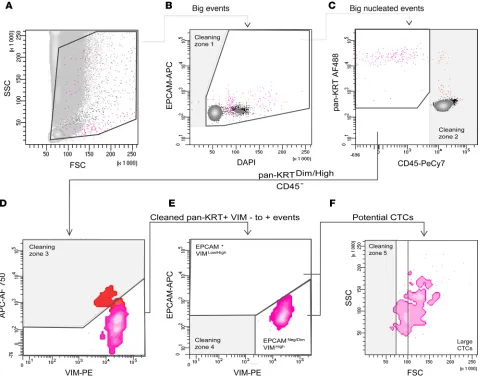
To confirm that our strategy allowed the identification of epithelial cells irrespectively from their EMT status we tested epithelial cell lines at various stages of epithelial or mesenchymal differentiation, including epithelial cells (HCT 116, SK-BR-3, and SUM-190) and mesenchymal-like cells (MDA-MB-231 Figure 2. Principle of our gating strategy to select rare cells of epithelial origin from blood. The strategy was applied using the MDA-MB-231 cell line that expresses both epithelial and mesenchymal markers. This experiment was reproduced 3 times. After applying a double threshold based on cell size and pan-cytokeratin (pan-KRT) staining, gates were defined to progressively refine the selection. (A)A first gate was used to select for events with a size larger than most monocytes and granulocytes. These events were plotted against DAPI to select for nucleated cells only. Debris was removed with the “Cleaning zone 1.” (B) As cells can form small clusters, including with CTCs, a wide range of DAPI intensities was used. (C) Remaining contaminating CD45+
cells were excluded (Cleaning zone 2). The pan-KRT+ population of interest was then plotted according to VIM-PE and APC Alexa 750 (APC AF750) values.
(D) All events that fluoresce in this empty channel should be considered contamination (Cleaning zone 3), as these events displayed nonspecific staining. (E) Cells negative to positive for VIM were selected, then analyzed for their respective expression of VIM and EPCAM (EPCAM+VIMlo/dim and EPCAM–/lo VIM-dim/hi). Double-negative residual events were excluded as potential false-positive events (Cleaning zone 4). We have indicated the potential CTCs in 2 gates
which allow the identification of EPCAM+VIMlo/hi population and EPCAM–/dimVIMhi. (F) Finally, a last readjustment based on the FSC parameter, which was
and Hs-578T). These cells were spiked in 1 mL of blood (~1000 cells). We then checked the specificity of epithelial cell detection. Both epithelial cells and mesenchymal-like cells were clearly detectable in the conditions and gating strategy described above (Supplemental Data 1; supplemental material available online with this article; https://doi.org/10.1172/jci.insight.128180DS1).
Lastly, EPCAM and VIM expression were evaluated on the selected cells, whether they were EPCAMlo
or EPCAMhi cells (Figure 2).
Sensitive and specific detection of rare cells of epithelial origin from the blood with a 2-threshold strategy applied to cell sorting. Rare event analysis requires acquisition of millions of events to obtain a sufficient number of
cells for statistically significant detection. Acquiring these numerous cells is challenging. To physically ana-lyze millions of events without saturating the system, we used an enrichment method involving a 2-thresh-old-restricted strategy by FACS, hereafter called “real-time enrichment.”
With the intensity of FSC of 320 and SSC (side-scattered light) of 380, the real-time enrichment of rare epithelial cells was done using the combination of 2 discriminators. The first discriminator used a threshold of 40,000 for the FSC signal. This limited the analysis to large-size events (i.e., excluding most lymphocytes, and some polynuclear cells and macrophages). The second discriminator was set to 300 on the AF488 channel to select cells with faint-to-strong fluorescence for the pan-cytokeratin epithelial marker. Once the discriminators are fixed, the number of events should remain below 200 events per second during the acquisition; if not, the speed should be adjusted accordingly, a low acquisition speed being required to ensure strong sensitivity of CTC detection (Supplemental Data 2).
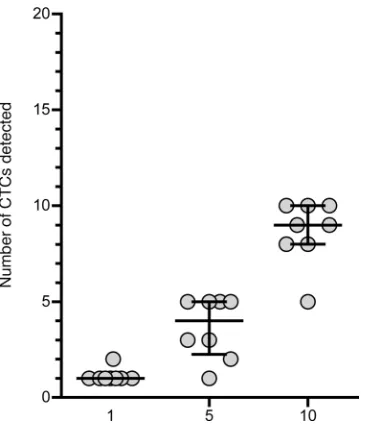
We then assessed the sensitivity of our approach by spiking very small numbers of epithelial cells into peripheral blood samples (Figure 3). Using a micromanipulator, we spiked 1, 5, and 10 MDA-MB-231 cells in blood samples of 8 different healthy donors. These cells were highly relevant to CTC study, as cells of epithelial origin detected in the blood express high levels of VIM, a mesenchymal marker (26). When 1 cell was spiked in 1 mL of blood, it was always detected in our conditions and gating strategy. In one case, 2 MDA-MB-231 cells were identified by FACS. This was not a false positive identification of a blood cell because the phenotype of MDA-MB-231 was easily identifiable among the background, being strong for pan-cytokeratin and VIM, and low for EPCAM (Supplemental Data 1); this result was likely due to micropipetting error or to the division of the picked cell. When 5 cells and 10 cells were spiked in 1 mL of blood, 72.5% (min 20% to max 100%) and 86.25% (min 50% to max 100%) of them, respectively, were identified in the gate. It was surprising that the recovery was better with 1 cell than with a higher number of cells. The cell line phenotype was, however, very characteristic (pan-cytokeratin very high, EPCAM low, and VIM high). It was thus very easy to distinguish those cells among the rest of events. Our hypothesis for this unexpected result is that the manipulation time to pick and spike a single cell was shorter, which limited cell death and facilitated cell recovery. The recovery of spiked cells using our protocol was nonetheless highly linear, with a correlation coefficient of R2 equal to 0.899.
Many studies have used cancer cell lines as CTC surrogates to validate CTC detection (20). Epithelial cells from all subtypes of breast cancer were usually recovered, except for the claudin-low/mesenchymal-like
subtype including MDA-MB-231 and Hs578T (20). As a supplemental proof of concept of our gating strat-egy, we spiked Hs578T cells (~100 cells) in 1 mL of blood of a healthy donor. We stained the sample as
pre-viously described and sorted the DAPI+pan-cytokeratinloCD45– cells. We extracted and amplified the DNA
from those cells (supplemental materials and methods). Hs578T cells are known to harbor gene mutations such as damaging mutations in TP53, HNF1A, and FLT1 present in 100% of the tumor cells. These 3 muta-tions were found with a similar proportion in sorted cells (Supplemental Table1). This confirmed that we can efficiently and specifically detect sparse epithelial cells with a wide range of EMT phenotypes.
The same strategy was then applied to 3 donors with metastatic disease to demonstrate that cells detected with our gating strategy were indeed of malignant origin and true CTCs. For this, we looked at mutations harbored by cells identified as potential CTCs using our gating strategy, in comparison with mutations in the corresponding solid tumor found by sequencing. Because it is not possible to use our discriminators’ approach in FACS, we used a pre-enrichment strategy to mimic the real-time enrichment. We enriched our samples using the RosetteSep Human CD45 Depletion cocktail. Enriched CTCs were then stained following our
protocol and used immediately for FACS. We sorted the cells displaying a DAPI+pan-cytokeratinlo-to-hiCD45–
phenotype from 3 donors with advanced breast cancer. The recovered CTCs of the 3 donors harbored at least 1 mutation, which was also present in the respective matching tumor, after correcting for variants using genomic material from normal cells (supplemental materials and methods and Supplemental Table 1).
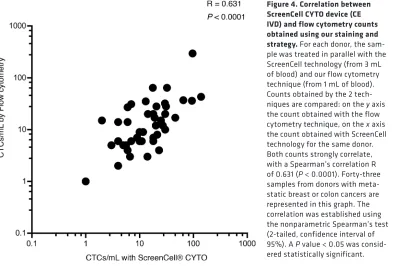
Comparison of the flow cytometry–based prototype to an existing method to enumerate potential CTCs in clinical samples. To validate counts obtained by our flow cytometry–based (FC-based) prototype, we
established the number of cells of epithelial origin per milliliter of blood using ScreenCell CYTO devices on the same clinical samples. ScreenCell CYTO devices are devoted to histological/phenotyp-ical characterization of potential CTCs. This technology enriches cells of epithelial origin, based on their size and deformability, and is thus not restricted to the marker EPCAM (Supplemental Data 3, A and B). This technology is among the most rapid, easy, and exhaustive technologies currently
avail-able. We identified potential CTCs based on the size of the nuclei (>20 μm), a high nucleocytoplasmic
ratio, irregularities of the nuclear membrane, and density of the nucleus. The epithelial nature of the cells was further confirmed by immunofluorescence with the detection of cytokeratin and EPCAM expression and the absence of CD45 staining. Vimentin was almost always strongly expressed on these CTCs (Supplemental Data 3C) as we already noticed by FC.
Blood from 43 donors with breast or colon cancer was tested with FACS and ScreenCell CYTO tech-nologies. The correlation between potential CTC counts established by FACS and ScreenCell CYTO was strong (P < 0.0001, Spearman’s R = 0.631; Figure 4).
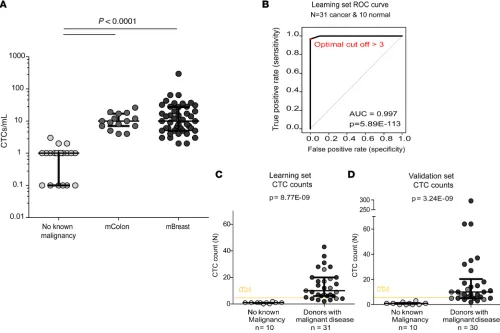
FC-based detection of potential CTCs in a cohort of metastatic patients. We tested our strategy using control
donors without known cancer at the time of collection (n = 20) and donors with metastatic cancer (n = 15 metastatic colon [mColon], and n = 46 metastatic breast [mBreast] cancers; Figure 5A and Table 1).
Using our research FACS prototype, all donors without known malignant disease had less than 3 cells of epithelial origin per milliliter of blood (mean value 0.93 ± 0.75 cells/mL). Representative plots obtained from donors without known malignant disease are shown in Supplemental Data 4. By contrast, the mean number of potential CTCs per mL of blood from donors with malignant disease was 18.8 (±38.77). Representative plots obtained from the latter are shown in Supplemental Data 5. The median was 9.5 CTCs/mL, ranging from 2 to 295 CTCs/mL. More specifically, in donors with mColon cancer, the mean value was 11.20 (±6.3) potential CTCs/mL, ranging from 4 to 26 CTCs/ mL. In donors with mBreast cancer, it was 21.93 (±43.83) potential CTCs/mL, ranging from 2 to 295 CTCs/mL. Thus, the difference in epithelial cell counts measured with our approach between healthy donors and individuals with cancer was strongly significant. Donors without known cancer had far fewer cells from epithelial origin detected than donors with untreated mColon cancer (P < 0.0001) or with treatment-refractory mBreast cancer (P < 0.0001). The number of potential CTCs was not differ-ent between subjects with mColon cancer and those with mBreast cancer.
To determine the trade-off between sensitivity and specificity of CTC detection from donors with can-cer and donors without known cancan-cer, we used receiver operating characteristic (ROC) curves. We ran-domly split the mBreast and mColon cancer samples into a learning set (n = 31) and a verification set (n
= 30). The learning set established an optimal cut-off value of >3 CTCs/mL (P = 8.77 × 10⁻⁹), which was
confirmed in the other set (P = 3.24 × 10⁻⁹; Figure 5B). Of note, the same cut-off (3 CTCs/mL) was found
Finally, we applied our protocol and strategy in a “blind” test on 14 samples from donors with (n = 9) or without (n = 6) known malignant disease and did not identify any false-positive samples (i.e., donors without known malignant disease that would have more than 3 CTCs/mL of blood; Supplemental Table 2).
For some patients with mColon cancer (n = 7), we had the opportunity to study 1 blood sample before and after 4 months of primary chemotherapy with FOLFOX (folinic acid, fluorouracil, and oxaliplatin). All includ-ed subjects presentinclud-ed at least a partial response to treatment as assessinclud-ed by clinicians according to the Response Evaluation Criteria in Solid Tumors (RECIST: 27237360). Despite the small size of the cohort, we observed a decrease in the number of CTCs per mL of blood from 17 (±7.528) before receiving the treatment to 6 (±4.46) after receiving the treatment (P = 0.02; Figure 6A).
Finally, we looked at the survival of mBreast patients based on CTC (large cells, CD45–
cytokerat-inmed-to-hiVIM+EPCAM±) detection. Compared with the mColon cohort, this cohort was larger and has a
lon-ger clinical follow-up (first inclusion: Nov. 2016 to last inclusion: Dec. 2017, follow up until Jan 2019). The inclusion criteria for our study were presentation of breast cancer metastases not responding to treatment and an ECOG performance status ≤2. Consequently, this cohort was heterogeneous regarding the elapsed time between the initial diagnosis of metastasis and the inclusion in the study (0.3 to 19 years). We thus excluded all data from patients whose initial diagnosis of metastases was older than 4 years before inclusion in the study (n = 10) as well as patients who were not followed in our Institute (and for which we do not have a proper follow-up, n = 8). The resulting population of 28 patients separated based on the threshold of 10 CTCs/mL had different median survival times of 12.5 months for patients with less than 10 CTCs/mL versus 2.7 months for patients with more than 10 CTCs/mL (log-rank test, P < 0.0089; Figure 6B). Finally, we wanted to see if the more “epithelial” or more “mesenchymal” phenotype of CTCs had an impact on the survival of these patients. This result was not significant, but there was a tendency suggesting that more mesenchymal CTCs might be of worse prognosis than CTCs with a more epithelial phenotype (Figure 6C).
Discussion
Evolution of cancer is hard to appreciate at the cellular level in the case of solid tumors because obtaining solid-tumor biopsies can be difficult, dangerous, or unfeasible and, in any case, results in locally and timely restricted information on cancer composition. This results in a lack of access to molecular and phenotypic information on cancer evolution that could be crucial for treatment success. The ability, through liquid biopsy, to easily and repeatedly access data from malignant events occurring in tissues provides a strong opportunity for adapting cancer treatment. CTCs in the bloodstream represent an interesting window on
the evolution of cancers, especially on the metastatic process and therapeutic response. Therefore, the abil-ity to accurately detect and analyze CTCs in peripheral blood of donors is of importance. Here we have demonstrated that we can detect “potential” CTCs (“potential” because there is no molecular proof of malignancy at this stage) with high sensitivity from as little as 1 mL of blood within only 1 hour and with-out any time-consuming and error-prone pre-enrichment step. Moreover, the procedure reduces the volume
of sample to be stained down to approximately 100 μL, which allows using regular doses of antibodies.
For this, the use of a new research prototype of permeabilization buffers for protein intracellular stain-ing considerably shortened the stainstain-ing. To our knowledge, this is the fastest method to simultaneously detect surface and intracellular molecules. The total procedure required at most 40 minutes, with minimal in-hand manipulation and wash steps, as compared with the classical method requiring 2 hours.
acquire millions of events. This usually takes time if the sample is not pre-enriched before the run on the flow cytometer. To deal with the scarcity of CTCs in blood samples, we opted for a real-time enrichment step, i.e., done simultaneously with the analysis, in contrast to the classical approaches that rely on a pre-enrichment step (magnetic or gradient). For this, we used an appropriate combination of thresholds that were able to mimic pre-enrichment methods without having to physically perform them. Here again, our approach strongly shortens the process, which is crucial to detect potential CTCs that have a short half-life, especially ex vivo (29).
Altogether, the combination of the new permeabilization buffers, research reagents, and the real-time “enrichment” strategy was the first key step to allow enrichment of the sample in cells of epithelial origin in a very short time (less than 1 hour).
It is optimal to perform the real-time “enrichment” based on a double-threshold strategy, i.e., cell size and positivity for pan-cytokeratin staining. Cytokeratins are intermediate filament proteins characteristic of epithelially derived cells and remain prevalent in transformed epithelial cells (30), such as CTCs. Cytoker-atin expression is less versatile than EPCAM expression. Elements that did not meet the above-mentioned double-threshold criteria were discarded and not analyzed, lightening the electronic/informatic processing of the data. Others have already successfully used the double-threshold strategy in advanced squamous cell carcinomas of the head and neck, using FSC and EPCAM as discriminators. They obtained good sensitiv-ity of detection and discrimination between donors without and donors with malignant disease (31, 32). However, in addition to a longer manipulation time of the sample before analysis, it is possible that using EPCAM as a discriminator might have contributed to underestimating the number of potential CTCs.
Restricting the detected population of CTCs to EPCAM+ CTCs makes the technique more comparable
to the population analyzed when using the Cellsearch approach. It is now believed that EPCAM alone is not sufficient to identify CTCs. EPCAM can be downregulated or lost in tumor cells undergoing EMT, a cellular dedifferentiation process encountered in invasive tumors. Taking those issues into consideration led us to develop 3 essential original modifications in our detection strategy. First, we did not use EPCAM as an exclusion marker; it was included in our staining panel but analyzed as a descriptive informative marker. The criteria for potential CTC detection were based on FSC (physical properties of the cells) and pan-cy-tokeratin (intracellular epithelial marker). Second, we also used DAPI as a marker to select nucleated cells and FSC and SSC to remove all possible contamination by debris as suggested by previous studies (32, 33), thus improving the sensitivity and specificity of CTC detection. Last, we added VIM to the panel for CTC detection. VIM upregulation in cells of epithelial origin is a feature of EMT. It is of paramount importance to be able to detect CTCs with mesenchymal-like phenotype because EMT transition or plasticity capacity of a cell characterizes a gain in invasiveness, cancer stem–like phenotype, and drug-resistance phenotype (34–37). The circulating cells that will be able to initiate metastasis (metastasis-initiating cells, MICs) thus likely arise from circulating cells with an EMT phenotype (38). We hypothesized that the combination of pan-cytokeratin, VIM, and ±EPCAM would be the closest and probably the most sensitive one to detect “bona fide” CTCs, including cells with invasive, stem-like, and drug-resistance capacities.
The second key step in our strategy was to maintain the number of events below 200 events per second during the acquisition; if not, the speed should be adjusted accordingly. Otherwise, the number of aborted events increases and the sensitivity of detection decreases accordingly. For flow cytometers allowing only 1 discriminator instead of 2, it is important to set the only threshold on the pan-cytokeratin–AF488 marker for the real-time enrichment. Then, to achieve the same sensitivity as with 2 discriminators, when only one
Table 1. Patient characteristics
Groups mColon
Mean (± SD) Mean (± SD)mBreast
Number of patients 15 46
Mean age at diagnosis (year) 63.3 (±9.62) 48.9 (±8.2)
Mean age at inclusion (year) 63.7 (±9.08) 57.9 (9.2)
Time between diagnosis of metastasis and inclusion (year) 0.06 (±3.75) 3.5(±4.2)
Time between diagnosis and inclusion (year) 0.36 (±6.94) 9.0 (±7.9)
is used, the number of events analyzed should not exceed 100 events per second. We believe that this leads to a higher sensitivity of detection. The drawback of this high sensitivity is that it occasionally detects cells of epithelial origin in the blood of healthy donors (we do not exclude false-positive signals). This required us to set a baseline appropriate for our technique. We thus did a ROC curve analysis to establish a threshold value above which we clearly differentiated the controls from subjects with malignant disease. With this study being based on a relatively small number of subjects, the threshold of 3 CTCs/mL that we identified should not be considered as a gold standard yet. We cannot exclude the possibility that, by increasing the number of controls and subjects with malignant disease, this threshold might slightly vary.
Figure 6. CTC detection in regard to clinical evolution of the malignant disease. (A) Impact of treatment on the amount of CTCs detected. Detection of CTCs in 7 donors with malignant disease (metastatic colon cancer, mColon) responding to treatment, before and after chemotherapy. The number of CTCs, on the y axis, is per milliliter of blood; it decreases when subjects are responding to treatment, from 14.4 to 3.2 CTCs/mL. Comparison of the numbers of CTCs before and after treatment was done using the nonparametric Wilcoxon’s matched-pairs signed-rank test (2-tailed, confidence interval of 95%). (B) Survival curve based on CTC counts of advanced metastatic breast cancer (mBC) patients (patients included in the study less than 4 years after the initial diagnosis of metastases). A threshold of 10 CTCs/mL was set (median value of CTC counts in the mBC cohort). The survival curves from the entire cohort (blue line, n = 28), from patients with >10 CTCs/mL (purple line, n = 11) or from patients with less than 10 CTCs/mL (gray line, n = 17) were calculated using the Kaplan-Meier method and were compared using the log-rank test. (C) Survival curve based on CTC’s epithelial or mesenchymal status of advanced mBC patients (patients included in the study less than 4 years after the initial diagnosis of metastases). The epithelial or mesenchymal status of CTCs was determined based on the expression of EPCAM+VIMlo/dim (epithelial CTCs, green line, n = 10) or mesenchymal EPCAM–VIM+ (mesenchymal CTCs, magenta
Altogether, these technological adaptations allowed us to meet our primary objective, which was to be as fast and as simple as possible without significant loss of cells to optimize sample prescreening for poten-tial CTCs. We ensured that detected cells are of epithelial origin and, as a proof of concept, we demon-strated in 3 cases that cells identified with our FACS strategy harbored malignant mutations and thus were “true” CTCs. Moreover, our results on a cohort of colon cancer and breast cancer patients revealed a good correlation between the clinical evolution (response to treatment, survival time) and the numeration of “potential” CTCs with our technique. This shows that our technique detects cells that are relevant to the clinical evaluation of patients. Our FACS-based technique, however, is not designed to provide live (cells are fixed and permeabilized) or exhaustive characterization of circulating cells, which can be achieved with other techniques. The high practicability of this test makes it very suitable for rapid screening of samples before using more onerous techniques. This screen can be helpful to decide the downstream fate of the sam-ple. For example, single-cell molecular analyses remain technically tricky and expensive, and it might be justified to first optimize sample usage based on a rapid prescreen of available cell number and phenotype.
One great advantage of our technique is that FACS is very well implemented in most clinical centers. It is interesting to mention that the chosen combination of antibodies required minimal fluorochrome compensa-tions. If the gating strategy described above is properly followed, highly trained personnel are not required to obtain reliable results. Compared with other existing techniques that also provide a rapid numeration of CTCs, like the filtration-base ScreenCell that we have used in our experiments, our FACS approach is the fastest to simultaneously provide an “automatic” count and the phenotype of the CTCs with a classical set of markers.
Another advantage of FC-based tools over the other ones is that the panel can easily be incremented with more than 8 simultaneous markers, enhancing the level of CTC characterization. The panel used here can be considered as a “basic” panel to identify potential CTCs. The panel definition can thus be extended or custom-ized for research studies of certain cancer types (breast, colon, etc.) or to answer specific biological questions (drug resistance, metastatic properties, tumor biomarker, etc.). Considering the wide heterogeneity of CTC sub-sets that can be found in the blood (39, 40), the addition of specific markers such as EGFR (41–43), KLK3 (PSA, prostate-specific antigen; ref. 10), ERBB2 (44, 45), or CD133 (33) could help address those specific questions. But the refinement to specific subsets of an already rare population might require analyzing larger volumes. If required, our method can easily accommodate larger volumes of blood (up to a few milliliters). This could increase the reliability of the test as well as the sensitivity of detection, and at the same time, decrease potential variation. But of course, as a consequence, the acquisition time would be increased accordingly (46).
Lastly, the whole process is affordable (cost of fixation/permeabilization buffers and antibodies) and thus fully compatible with routine screening. One downside of our technique is that blood samples should be processed rapidly after sampling for better results, like for most CTC-isolation techniques. Once in the laboratory, the cells must be rapidly fixed/stained for 45 minutes (less than 5 minutes in-hand time). Once this is done, the sample can be run on the FACS machine at a later time (within 24 hours). The upside of this is that the result can be obtained within less than 1 hour, which is compatible with a prescreening process.
Unlike the characterization of primary tumors, which provides a static view at the time of the sampling, analyzing CTCs may improve the understanding of the different steps involved in the metastatic cascade, from invasion of tumor cells into the bloodstream to the formation of clinically detectable metastases (1, 2). Here, we have pushed forward the limits of FACS to prescreen a sample for potential CTCs upstream of in-depth analyses. First, cells are simultaneously fixed, permeabilized, and stained within 45 minutes. Second, using low-speed FACS acquisition conditions and 2 discriminators (cell size and pan-cytokeratin expression), we suppressed the pre-enrichment step. Applied to blood from donors with or without known malignant disease, this protocol ensures a high recovery of the cells of interest.
This proof-of-concept study lays the bases of a sensitive tool to detect CTCs from a small amount of blood independently of the expression of the epithelial marker EPCAM. Results are obtained in less than 1 hour (total time until enumeration of CTC), which, to our knowledge, makes this approach one of the fastest available today. Our research study describes a “basic” set of markers to detect CTCs that can be customized to address specific needs or questions.
Methods
Donor sample collection. Peripheral blood samples from subjects with solid tumor (n = 61), mostly breast (n =
endothelial cell contamination during the puncture. All samples were shipped to the laboratory, treated, and analyzed within 4 hours.
Cell lines. Cell lines were purchased from the ATCC collection. We used Hs578T (ATCC HTB-126),
SK-BR-3 (ATCC HTB-30), SUM190PT (BioIVT), and MDA-MB-231 (ATCC CRM-HTB-26) breast can-cer cell lines, and the HCT 116 (ATCC CCL-247) colon cancan-cer cell line. Cell lines were regularly checked for mycoplasma contamination during their growth and discarded in case of positive results.
Cell picking: spiking. For numbers of spiked cells greater than 1000, cells were counted on a Malassez
slide and the appropriate number of cells was added to 1 mL of blood from a donor without malignant
disease. For small numbers of spiked cells, single cells were individually micromanipulated using a 15-μm
transfer tip on a TransferMan NK2 micromanipulator (Eppendorf). One, 5, or 10 cells were respectively spiked into 1 mL of blood. Eight replicates were done for each experiment. Blood was then stained accord-ing to the FACS protocol described below, then analyzed on a FACSCanto II (BD Biosciences).
FACS staining workflow. See also Supplemental Data 7. One milliliter of blood was treated in a conical
15-mL tube with 3 new research reagents (provided by Beckman Coulter): 100 μL fixation reagent (R1) for
15 minutes, then 6 mL RBC lysis + permeabilization reagent (R2) for 5 minutes at room temperature (RT). After a quick centrifugation step (500 g, 5 minutes), the supernatant was discarded by inversion and the
pel-let suspended by pipetting in the remaining liquid (approximately 100 μL). This was transferred to a 5-mL
standard FACS tube containing the appropriately calibrated antibody mix, diluted in R2 (final volume: 50
μL), consisting of at least 5 μL of DAPI (564907, BD Pharmingen), 5 μL of ant–pan-cytokeratin-AF488
(clone J1B3), 2 μL of anti-EPCAM-APC (clone VU1D9), and 2.5 μL of anti-CD45 PeCy7 (clone J33) (all
from Beckman Coulter, or dried in a ready-to-use tube, as a research reagent), and 2 μL of anti-VIM-PE
(liquid, clone 280618, Biotechne, R&D Systems). The sample was then incubated in the dark for 15 to 20
minutes at RT. Cells were finally diluted in 1 mL of a final reagent (R3), and then analyzed entirely on a BD FACSCanto II (BD Biosciences). A range of internal quality assurance procedures was employed, including daily calibration of the instrument’s optics, electronics, fluidics, and for adjusting fluorescence
compensation and detector voltages using the BD CS&T beads (BD Biosciences). Data were then analyzed
using the Diva Flow Cytometry Analysis Software (BD Biosciences).
Fluorescence quantification by FACS was established with the measure of the staining index (SI). The SI is calculated as follows: (mean fluorescence intensity of the positive signal – mean fluorescence intensity of the negative control)/(2 × standard deviation of the mean fluorescence intensity of the negative control).
CTC enumeration using ScreenCell CYTO column. Three milliliters of blood were used with a ScreenCell CYTO
column to establish the CTC count. First, the sample was diluted in 4 mL of ScreenCell FC filtration buffer to fix the cells. This allows the lysis of red blood cells before filtration while preserving other cells. An additional 1.6 mL of 1× PBS was filtered to remove debris from the filter. At the end of filtration, the nozzle/holder of the ScreenCell CYTO device was unclipped and removed from the filtration module. The filter was then released onto a standard microscopy glass slide by pushing down a rod located at the bottom part of the filtration device. Cytological stains such as May-Grünwald and Giemsa (Merck), and then immunofluorescent staining (using the same clones of antibodies as for the flow cytometric analysis) were done directly on the filter.
Statistics. All graphs and statistical analyses were done using GraphPad Prism software. Statistics, for
a given marker, were expressed as mean (± standard deviation, or median with interquartile range when stated). The number of CTCs in the different groups was evaluated using the nonparametric 1-way Krus-kall-Wallis test (and Dunn’s multiple-comparisons test, with a confidence interval of 95%). The compar-ison of the numbers of CTCs before and after treatment was done using the nonparametric Wilcoxon’s matched-pairs signed-rank test (2-tailed, confidence interval of 95%). Correlations were established using the nonparametric Spearman’s test (2-tailed, confidence interval of 95%).
Study approval. This work was approved by the Institutional Ethic Committee Review Board (Comité
d’orientation Stratégique [COS], Marseille, France) from the Institut Paoli-Calmettes and the Local Ethic Committee Review Board (Comité de Protection des Personnes [CPP], Marseille, France). All subjects provided written informed consent before study participation.
Clinical samples were collected from subjects enrolled in 2 institutional prospective clinical trials. Breast cancer samples were from the PERMED-01 trial (NCT02342158) and corresponded to pretreated metastatic diseases. Colon cancer samples were from the CTC-Colon-IPC 2015-20 trial (NCT03256084) and corresponded to untreated metastatic diseases.
Peripheral blood from donors with solid tumors was collected between November 2016 and July 2018. Peripheral blood from donors without known solid tumors was obtained from anonymous donors from the Etablissement Français du Sang (Marseille).
Author contributions
AL conducted most experiments. FM contributed to FACS experiment design, analysis, and provid-ed reagents. SG, QD, and PF contributprovid-ed to genomic sequencing and statistical analysis. MLL did the cell-picking experiments. MG, JLR, and FB were responsible for all the legal and clinical aspect of patients’ enrolment. DB, CA, and EM supervised the work and analyzed the results. AL, CA, and EM wrote the manuscript. FM and EM conceived the project. All authors proofread the manuscript.
Acknowledgments
This work has been supported by Inserm, Institut Paoli-Calmettes (SIRIC INCa-DGOS-Inserm 6038), and grants from the Ligue Nationale Contre Le Cancer (EL2016.LNCC/DaB), Association Ruban Rose, and Fondation Groupe EDF (Project Nano-S). AL was supported by the ARC foundation. We would like to thank all donors who have willingly contributed to the study (PERMED-cohort, CTC-colon Cohort, Donors without malignant diseases); the Direction de la Recherche Clinique; J. Pakradouni for the management of the PERMED cohort; F. Mallet and M. Richaud from the Flow Cytometry Platform for their outstanding expertise; as well as the OncoGenomic platform and the Microscopy and Scientific Imaging platform.
Address correspondence to: Emilie Mamessier, 27 Boulevard Lei Roure BP30059, 13273 Marseille Cedex 9, France. Phone: 33.04.91.22.33.33; Email: [email protected].
1. Micalizzi DS, Maheswaran S, Haber DA. A conduit to metastasis: circulating tumor cell biology. Genes Dev. 2017;31(18):1827–1840. 2. Dive C, Brady G. SnapShot: circulating tumor cells. Cell. 2017;168(4):742–742.e1.
3. Cauley CE, et al. Circulating epithelial cells in patients with pancreatic lesions: clinical and pathologic findings. J Am Coll Surg. 2015;221(3):699–707.
4. Hardingham JE, et al. Molecular detection of blood-borne epithelial cells in colorectal cancer patients and in patients with benign bowel disease. Int J Cancer. 2000;89(1):8–13.
5. Pantel K, et al. Circulating epithelial cells in patients with benign colon diseases. Clin Chem. 2012;58(5):936–940.
6. Werner ME, Hwang P, Huisman F, Taborek P, Yu CC, Mitchell BJ. Actin and microtubules drive differential aspects of planar cell polarity in multiciliated cells. J Cell Biol. 2011;195(1):19–26.
7. Ilie M, et al. “Sentinel” circulating tumor cells allow early diagnosis of lung cancer in patients with chronic obstructive pulmo-nary disease. PLoS One. 2014;9(10):e111597.
8. Cohen SJ, et al. Relationship of circulating tumor cells to tumor response, progression-free survival, and overall survival in patients with metastatic colorectal cancer. J Clin Oncol. 2008;26(19):3213–3221.
9. Carter L, et al. Molecular analysis of circulating tumor cells identifies distinct copy-number profiles in patients with chemosen-sitive and chemorefractory small-cell lung cancer. Nat Med. 2017;23(1):114–119.
10. Stott SL, et al. Isolation and characterization of circulating tumor cells from patients with localized and metastatic prostate can-cer. Sci Transl Med. 2010;2(25):25ra23.
11. Aceto N, et al. Circulating tumor cell clusters are oligoclonal precursors of breast cancer metastasis. Cell. 2014;158(5):1110–1122. 12. Haber DA, Velculescu VE. Blood-based analyses of cancer: circulating tumor cells and circulating tumor DNA. Cancer Discov.
2014;4(6):650–661.
13. Plaks V, Koopman CD, Werb Z. Cancer. Circulating tumor cells. Science. 2013;341(6151):1186–1188.
14. Chudasama D, et al. Detection of circulating tumour cells and survival of patients with non-small cell lung cancer. Anticancer Res. 2017;37(1):169–173.
15. Freydina DV, et al. Diagnostic utility of unbiased circulating tumour cell capture through negative depletion of peripheral blood cells. Oncology. 2015;89(6):360–364.
17. Kowalewska M, Chechlińska M, Markowicz S, Kober P, Nowak R. The relevance of RT-PCR detection of disseminated tumour cells is hampered by the expression of markers regarded as tumour-specific in activated lymphocytes. Eur J Cancer. 2006;42(16):2671–2674.
18. Li Y, Cheng X, Chen Z, Liu Y, Liu Z, Xu S. Circulating tumor cells in peripheral and pulmonary venous blood predict poor long-term survival in resected non-small cell lung cancer patients. Sci Rep. 2017;7(1):4971.
19. Takao M, Takeda K. Enumeration, characterization, and collection of intact circulating tumor cells by cross contamination-free flow cytometry. Cytometry A. 2011;79(2):107–117.
20. Ring A, et al. EpCAM based capture detects and recovers circulating tumor cells from all subtypes of breast cancer except clau-din-low. Oncotarget. 2015;6(42):44623–44634.
21. Magbanua MJ, Park JW. Isolation of circulating tumor cells by immunomagnetic enrichment and fluorescence-activated cell sorting (IE/FACS) for molecular profiling. Methods. 2013;64(2):114–118.
22. Yu M, et al. Circulating breast tumor cells exhibit dynamic changes in epithelial and mesenchymal composition. Science. 2013;339(6119):580–584.
23. Shibue T, Weinberg RA. EMT, CSCs, and drug resistance: the mechanistic link and clinical implications. Nat Rev Clin Oncol. 2017;14(10):611–629.
24. Hyun KA, et al. Epithelial-to-mesenchymal transition leads to loss of EpCAM and different physical properties in circulating tumor cells from metastatic breast cancer. Oncotarget. 2016;7(17):24677–24687.
25. Charafe-Jauffret E, et al. Gene expression profiling of breast cell lines identifies potential new basal markers. Oncogene. 2006;25(15):2273–2284.
26. Xu L, et al. The novel association of circulating tumor cells and circulating megakaryocytes with prostate cancer prognosis. Clin Cancer Res. 2017;23(17):5112–5122.
27. Goodale D, Phay C, Postenka CO, Keeney M, Allan AL. Characterization of tumor cell dissemination patterns in preclinical models of cancer metastasis using flow cytometry and laser scanning cytometry. Cytometry A. 2009;75(4):344–355.
28. Watanabe M, et al. Multicolor detection of rare tumor cells in blood using a novel flow cytometry-based system. Cytometry A. 2014;85(3):206–213.
29. Gratama JW, Menéndez P, Kraan J, Orfao A. Loss of CD34(+) hematopoietic progenitor cells due to washing can be reduced by the use of fixative-free erythrocyte lysing reagents. J Immunol Methods. 2000;239(1–2):13–23.
30. Barak V, Goike H, Panaretakis KW, Einarsson R. Clinical utility of cytokeratins as tumor markers. Clin Biochem. 2004;37(7):529–540.
31. Tinhofer I, Hristozova T, Stromberger C, Keilhoiz U, Budach V. Monitoring of circulating tumor cells and their expression of EGFR/phospho-EGFR during combined radiotherapy regimens in locally advanced squamous cell carcinoma of the head and neck. Int J Radiat Oncol Biol Phys. 2012;83(5):e685–e690.
32. Hristozova T, Konschak R, Budach V, Tinhofer I. A simple multicolor flow cytometry protocol for detection and molecular characterization of circulating tumor cells in epithelial cancers. Cytometry A. 2012;81(6):489–495.
33. Fang C, et al. Prognostic value of CD133. Cancer Med. 2017;6(12):2850–2857.
34. Mani SA, et al. The epithelial-mesenchymal transition generates cells with properties of stem cells. Cell. 2008;133(4):704–715. 35. Polyak K, Weinberg RA. Transitions between epithelial and mesenchymal states: acquisition of malignant and stem cell traits.
Nat Rev Cancer. 2009;9(4):265–273.
36. Saxena M, Stephens MA, Pathak H, Rangarajan A. Transcription factors that mediate epithelial-mesenchymal transition lead to multidrug resistance by upregulating ABC transporters. Cell Death Dis. 2011;2:e179.
37. Nieto MA, Huang RY, Jackson RA, Thiery JP. EMT: 2016. Cell. 2016;166(1):21–45.
38. Ruscetti M, Quach B, Dadashian EL, Mulholland DJ, Wu H. Tracking and functional characterization of epithelial-mesenchy-mal transition and mesenchyepithelial-mesenchy-mal tumor cells during prostate cancer metastasis. Cancer Res. 2015;75(13):2749–2759.
39. Gorges TM, et al. Accession of tumor heterogeneity by multiplex transcriptome profiling of single circulating tumor cells. Clin Chem. 2016;62(11):1504–1515.
40. Scher HI, et al. Phenotypic heterogeneity of circulating tumor cells informs clinical decisions between AR signaling inhibitors and taxanes in metastatic prostate cancer. Cancer Res. 2017;77(20):5687–5698.
41. Lankiewicz S, Rother E, Zimmermann S, Hollmann C, Korangy F, Greten TF. Tumour-associated transcripts and EGFR dele-tion variants in colorectal cancer in primary tumour, metastases and circulating tumour cells. Cell Oncol. 2008;30(6):463–471. 42. Payne RE, et al. Measurements of EGFR expression on circulating tumor cells are reproducible over time in metastatic breast
cancer patients. Pharmacogenomics. 2009;10(1):51–57.
43. Dragovich T, Campen C. Anti-EGFR-targeted therapy for esophageal and gastric cancers: an evolving concept. J Oncol. 2009;2009:804108.
44. Pestrin M, et al. Correlation of HER2 status between primary tumors and corresponding circulating tumor cells in advanced breast cancer patients. Breast Cancer Res Treat. 2009;118(3):523–530.
45. Galletti G, et al. Isolation of breast cancer and gastric cancer circulating tumor cells by use of an anti HER2-based microfluidic device. Lab Chip. 2014;14(1):147–156.