A b s t r a c t. Determination and calculating of the fractal dimension, thixotropy pasting and gelling temperature of cereal starches were performed. They were characterized with a fairly smooth surface because they were characterized with a fractal dimension of edge line slightly above 1. Potato starch differed from cereal starches by a higher fractal dimension of 1.029 which suggested that the edge line of the granules of that starch was more irregular. Decidedly the highest thixotropic properties were found in the case of the millet starch whose thixotropic coefficient amounted to 37.43, while the lowest was found in the rye starch with a coefficient of 3.83. Together with the increase in the size of the starch granules, the thixotropic properties of the starch gruel decreased.
K e y w o r d s: fractal dimension, cereal starch, thixotropy INTRODUCTION
Starch is a natural biopolymer and is stored in cereal grains, roots, tubers, stem-piths, leaves, seed, fruit and pol-len. Starch granules in storage tissues can vary in size, shape, composition, chemical and physical properties. The chemi-cal composition, structure and properties are essentially typical of the biological origin of the starch The shape and size of the granules also depend on the source (Jayakodya and Hoover, 2008; Mitrus and Moœcicki, 2009).
The irregular structure of natural materials as well as that of food products cannot be measured precisely by con-ventional methods and it is in such cases that fractal analysis can be applied. With its help one can characterize quanti-tatively the physical structure of products which are clusters of stable particles (instant milk, coffee), plants with florets (cauliflower, broccoli) or porous products (bread, soil, ger-minant grains and snacks) These products have a complex geometry with irregular structures such as pores, convexi-ties and visible structural bends existing in them (Calzetta-Resio, 1999; La Scalaet al., 2009).
The microstructural approach to food processing and engineering is based on the conviction that microstructural changes underlie product properties, and microstructural techniques are necessary to understand relationships bet-ween structure and properties (Aguilera, 2000). The deter-mination of the fractal dimension is intimately associated with structure. Therefore the self-similarity could be re-garded as a measure of geometrical complexity of an object under discussion (Pedrycz and Bargiela, 2003) Surface structure of food is complex, and its effect on functional pro-perties is that involve both physical and chemical chara-cteristics of the product. Biological materials, due to their com-plexity, can be analyzed by fractal analysis only to a limited extent (Morenoet al., 2010).
Fractal analysis in many cases can be an additional and useful instrument for providing the characteristics of tested preparations, in specifying the mechanism of reaction of aggregation or disintegration, in optimizing technological processes and in marking the correlation between the microstructure of the hydrocolloids described by means of fractal dimension and their functional properties (Genovese and Rao, 2003; Gonzales-Barron and Butler, 2008; Smo-czyñski, 1999).
The accuracy of fractal analysis depends on many factors. The most important of them are: the object selected to analysis and kind of process of fractal analysis. In case of the method of fractal analysis based on two-dimensional digital images there are some factors which may influence the analysis process, such as methods to obtain binary ima-ges, image magnification, image resolution, and threshold value (Tanget al., 2009).
Fractal dimension and rheological properties of cereal starches
J. Mazurkiewicz
Deptartment of Biotechnology, Human Nutrition and Science of Food Commodities, University of Life Sciences, Skromna 8, 20-950 Lublin, Poland
Received June 23, 2010; accepted December 2, 2010
© 2011 Institute of Agrophysics, Polish Academy of Sciences Corresponding author’s e-mail: jaroslaw.mazurkiewicz@up.lublin.pl
A A
Agggrrroooppphhyhyysssiiicccsss
The aim of this paper is:
– to calculate and specify the differences in the fractal dimension of cereal starches and potato starch as tested – to compare select rheological features and starch gelling, – to specify the thixotropic features of the solutions of the
starch tested.
MATERIALS AND TEST METHODS
Starches isolated by the modified Nara method (Naraet al., 1990) from seeds of grains available in domestic trade turn-over were used for testing. These were starches from rye, wheat, triticale, barley and millet. These starches were com-pared with the most commonly available potato starch made (potato flour ‘Superior’). The amount of general protein was marked using the Kjeldahl method in a Kjel-Foss automatic apparatus (AOAC 976.05). The fat content was marked using the Soxlet method in the Soxlet System Ht 1043 Extraction apparatus and the ash content using the AACC 08-17 method (AACC Standard Methods, Wierciñski, 1999).
In order to obtain starch, grains were milled in a ‘Qua-dramat Junior’ laboratory mill. The starch was then washed out of the flour three times with 0.1% solution of NaOH. After centrifuging the supernatant was poured off and re-moved while the residue was subjected to rewashing and con-tinuously mixed in a temperature of 45°C. The starch was then washed with distilled water and neutralized 2n HCl to pH=7. The starch milk thus obtained was dried in a tem-perature of 50°C for 2 days.
Determination and calculating the fractal dimension was carried out on the starch granules in water solution. These were then photographed with a PZO Warszawa optical microscope connected to an OSCAR television camera made by ELEMIS. The image, after being magnified 1 000 times, was downloaded into a computer where the areas and circumferences of 100 granules from each speci-men were marked using the special Multi Scan Base pro-gram for image analysis. The value of the surface area and circumference, a linear dependence was obtained in graph form. The fractal dimension was calculated from the pitch ratio of the straight line tgaobtained according to:
Area Circumference 2
DL
» , (1)
where DLis a fractal dimension of the edge line.
The rheological properties on 5% hydrous solutions of cereal starches and an 8% solution of potato starch were performed. The marking was carried out using a Brookfield Engineering Laboratories viscometer, model RV, spindle SC4-21. The pasting and the gelling temperature were car-ried out with constant turns of 50 r.p.m. (gradient of the velo-city of shearing 46.5 s-1). Measuring started at a temperature of 60°C with an increase of 1°C s-1up to the stabilization of viscosity, that is 97°C. The gelling process was marked after the starch had gelled. Determination of the thixotropy of the gelling was carried out according to Djakovicet al. (1990) in
starches subject to pasting. The measurement was carried out at a constant temperature of 70°C, changing the turns of the spindle from 0.5 to 100 r.p.m. (gradient of the velocity of shearing from 0.5 to 93 s-1) with an increase in velocity every three minutes, the velocity of the turning was subse-quently reduced after the viscosity had stabilized from 100 to 0.5 r.p.m. In order to calculate of the thixotropic loop area, S, the following formula was used:
S S S D
n i
n = - =' " max åDt
1
, (2)
where:S’ and S" are the areas below the upper and lower flow curve in the shear rate internal fromD= 0 toDmax, Dmaxis the highest value used for the shear rate (s-1),nis the number of differencesDti=ti-' ti" (Pa), upper (ti') and lower (ti") are flow curves for the given value ofDi. The thixotropy coefficient,Ktwas calculated on the basis of the following formula:
K S
D n
t i
n
= = å
max 1
1
Dt . (3)
Data were analyzed statistically using the Student t-test to determine significant differences between the mean values of examined samples at significance level of p£0.05.
RESULTS AND DISCUSSION
The lowest content of fat substances was observed in the case of potato starch - 0.06% (Table 1). While among cereal starches, wheat starch was characterized with the lowest content of fat – 0.11%. In the case of rye starch, triticale and barley, the lipid content was between 0.14 and 0.17 %. The highest value – 0.25% – was found for millet starch. The lowest ash content was found in potato starch – 0.15%, while the highest was found in the barley starch – 0.83%.
Starch
Moisture content
(w.w.)
Protein Lipid Ash
(%, mass) Rye 12.07d ( ±0.14) 0.22b ( ±0.025) 0.14c (±0.01) 0.58c ( ±0.012) Wheat 11.37b (±0.12) 0.26c ( ±0.012) 0.11b (±0.01) 0.43b ( ±0.042) Triticale 13.64e ( ±0.23) 0.24bc ( ±0.026) 0.15c (±0.03) 0.63d ( ±0.032) Barley 10.83a ( ±0.11) 0.35d ( ±0.016) 0.17cd ( ±0.05) 0.83f ( ±0.027) Millet 10.79a ( ±0.11) 0.98e ( ±0.021) 0.25d (±0.05) 0.74e ( ±0. 0.031) Potato 12.06d ( ±0.12) 0.11a ( ±0.022) 0.06a (±0.03) 0.15a ( ±0.065) ± Standard deviation; a, b, c – mean values with the same letter do not differ at p£0.05.
The logarithmic dependency of the particular granule starch area of on their circumference is shown in Fig. 1. It can be observed that the points of correlation of the area and the circumference are arranged in a straight line; this refers to all the starches tested. This linear dependability proves that in spite of the fact that granules of the same type of starch differ in size, they look similar in terms of the expansion of their areas and the appearance of the edge line. The fractal dimen-sion and the pitch ratio (the straight line tga) are presented in Table 2.
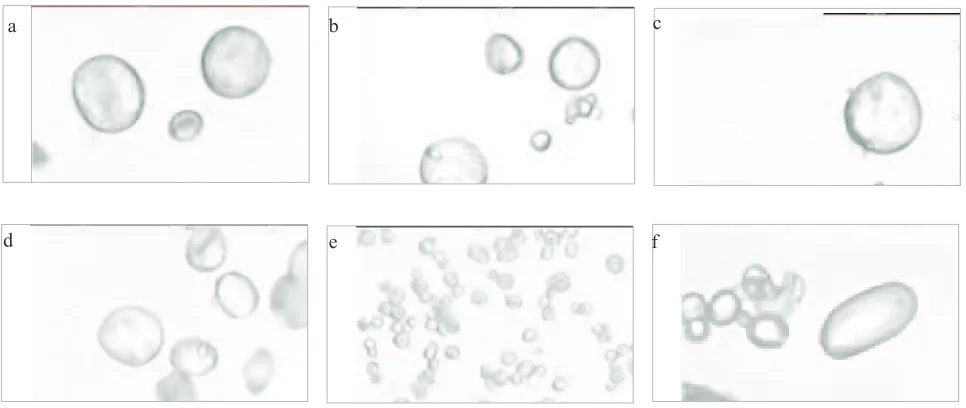
Fractal dimensions of particular cereal starches indicate that their granules may differ slightly as far as their surface appearance is concerned. The microscopic images of the ce-real starches and potato starch shown in Fig. 2. can illustra-ted this phenomenon. The fractal dimension of the materials
tested is located at an interval 0.996-1.029. The lowest value of the parameter discussed was found in the wheat and bar-ley starches, respectively 0.996 and 0.998. The fractal di-mension specifies the appearance of the edge line, hence the starches already mentioned had the smoothest surface and a quite regular edge line. As far as their fractal dimensions are concerned wheat and barley are very much alike. The fractal dimension for rye, triticale and millet amount to respecti-vely: 1.009; 1.012 and 1.015. This is closer to 1 which means that the edge line and, simultaneously, the surface of those granules, is almost smooth with only slight unevenness or roughness. The least evenness and hence the roughest sur-face and the least clear edge line, in comparison with the other starches, was found in the potato starch, whose fractal dimension amounted to 1.029.
Fig. 1.Logarithmic dependence of periphery on surface of native starch grains: a – rye, b – wheat, c – triticale, d – barley, e – millet, f – potato. y = 1.982x - 1.1257
1.0 1.5 2.0 2.5 3.0 3.5
1.2 1.4 1.6 1.8 2.0 2.2
Log Perimeter
L
o
g
A
re
a y = 1.9974x - 1.152
1.0 1.5 2.0 2.5 3.0 3.5
1.2 1.4 1.6 1.8 2.0 2.2
Log Perimeter
L
o
g
A
re
a
y = 1.9756x - 1.1219
1.0 1.5 2.0 2.5 3.0 3.5
1.2 1.4 1.6 1.8 2.0 2.2
Log Perimeter
L
o
g
A
re
a y = 1.9947x - 1.1465
1.0 1.5 2.0 2.5 3.0 3.5
1.2 1.4 1.6 1.8 2.0 2.2
Log Perimeter
L
o
g
A
re
a
y = 1.971x - 1.1237
1.0 1.5 2.0 2.5 3.0 3.5
1.2 1.4 1.6 1.8 2.0 2.2 Log Perimeter
L
o
g
A
re
a y = 1.9756x - 1.1219
1.0 1.5 2.0 2.5 3.0 3.5
1.2 1.4 1.6 1.8 2.0 2.2 Log Perimeter
L
o
g
A
re
a
a b
c d
e f
Log perimeter Log perimeter
Log
area
Log
area
Log
The initialTPand finalTktemperatures for pasting and gelling as well as the thixotropic features of the starch solutions tested are presented in Table 3. In the case of the pasting temperature, initial temperatures were taken into account. Of all the starches tested, potato starch was the first to start pasting. The temperature initiating this process in the case of the potato starch was 67°C. The remaining starches began pasting at temperatures above 80°C. Wheat and rye starches had a similar pasting temperature with only a 1°C difference. Millet starch melted at a temperature of 86.5°C. The highest temperature among the starches tested was found in the barley and triticale starches which was 89°C. The highest gelling temperature, 79°C, was found in the so-lution of rye starch. A 1°C lower temperature was noted in the case of the barley and millet starches. 70°C is the initial temperature for the gelling process of potato starch. Further cooling of the starch solutions tested caused an increase in viscosity. The cereal starches and potato starch tested showed abilities to create gels.
In order to specify the occurrence of thixotropy, a hyste-resis loop test was carried out on the starch gels. Increasing the velocity of the spindle of the viscometer thinned the gel, while simultaneously decreasing its viscosity. A repeated increase in viscosity was observed while reducing the velocity of the rotor. In all the starches tested, the measu-rement of the tangent stress, showed that as the speed of the shearing increased the viscosity decreased with the simul-taneous increase in shearing pressure. The dependency of the shear stress on the shear rate is shown in Fig. 3. The lowest maximal value of tangent pressure was noted in the case of the rye starch. This amounted to 11.21 MPa, while the highest (34.0 MPa) was found in the potato starch. 31 MPa was also found in the millet starch. The remaining starch gels were characterized with tangent pressures at intervals of 12.6-16.74 MPa.
Smoczyñski (1999) examined the fractal dimension of particles of starch preparations. He obtained a dimension of 1.0307 for native potato starch. The object of his examina-tions was also potato starch which had been extruded at a tem-perature of 110, 150 and 210°C. For this reason, the material gave the following results: 1.404; 1.200; 1.417. The modi-fied starch subjected to fractal analysis showed widely va-rying results. Fractal dimension for Adacorn CS amounted to 1.258, for the thickener SC 1.412, while for Adacorn HS, it was 1.552. The starch preparations tested showed a consi-derable difference in the level of surface expansion.
The fractal dimension can be directed through treating the tested material with external factors. Yano (1996) frac-tally analyzed potato starch subject to gelling which he then froze at a temperature of -10°C. He obtained a fractal dimen-sion of 2.2. Gelling and freezing starch in pure nitrogen leads to porosity the starch granules and hence to an increase of the Starch Pitch ratio of thestraight line tga Fractal dimensionD
L
Rye 1.982 1.009
Wheat 2.008 0.996
Triticale 1.976 1.012
Barley 2.004 0.998
Millet 1.971 1.015
Potato 1.943 1.029
T a b l e 2.The fractal dimension of native starches
Fig. 2.Starch granules in water solution from optical microscopy (magnification 1 000x): a – rye, b – wheat, c – triticale, d – barley, e – millet, f – potato.
a b c
DL to 3. Nagai et al. (1990) – using other methods – calculated the fractal dimension for lyophilizate and treated starches with ethanol at a level of 2.2 to 3.0. Such a highDL was found in ferrous oxide 2.59, carbon powder 2.33 and 2.59, soil from 2.19 to 2.99 or crushed rocks from 2.7 to 3.0. Herrera-Gómezet al. (2005) studied the mechanism of ag-gregates formation of maize starch granules. They measured the size distribution and its dependence on time by means of laser light scattering. They found a fractal-type geometry form of these aggregates.
Firoozmandet al. (2007) investigated the effect of the gelatin content on the storage and loss module, and fractal dimension of mixed solutions containing 7% starch quench-ed from 40 to 24°C. The mixquench-ed solutions were loadquench-ed into sample cells, sealed with a cover slip. Images were recorded at 24°C and processed. Fractal ‘box-counting’ analysis of 2-D images was carried out using the software fractal ana-lysis system, and the fractal dimension was determined from a double-logarithmic plots. Fractal dimension increased from 1.35 to 1.75 wt for gelatin content from 0.5 to 3% wt and the Starch
Pasting temperature (°C) Gelatinating temperature
(°C)
Thixotropy coefficient
Kt
Area of hysteresis loop (Pa s-1)
Tp Tk
Rye 89.1d
(±0.98)
95.9b (±0.98)
77.4bc (±0.85)
5.49b (±0.33)
510.66b (±35.3)
Wheat 82.0b
(±0.90)
95.2b (±0.91)
76.3b (±0.84)
9.84c (±0.53)
915.03c (±49.7)
Triticale 83.0b
(±0.91)
95.7b (±0.93)
78.8c (±0.97)
3.83a (±0.29)
356.28a (±27.8)
Barley 88.8d
(±0.98)
94.8ab (±0.97)
78.1c (±0.86)
10.87c (±0.56)
1011.1c (±52.6)
Millet 86.5c
(±0.95)
93.0a (±0.96)
78.3c (±0.88)
37.43e (±1.67)
3840.89e (±182.0)
Potato 67.1a
(±0.84)
93.0a (±0.87)
69.9a (±0.83)
13.68d (±0.68)
1272.15d (±63.6) Explanations as in Table 1.
T a b l e 3.The profile of the rheological features of starch solutions
Fig. 3.Thixotropic loops of 5% starch gels (at 70°C).
Shear stress (s-1)
Shear
rate
gel rigidity increased after 3-4 h at 24°C with protein content. The gelatinization rate also increased with gelatin concentration.
Amylose and lipids can create complexes between each other since they counteract the joining of the chains of amy-lose with the chains of amylopectins in a double spiral and in that way, the fat influences the spatial placement of the starch particle. The existence of the combination lipid-amylose makes it difficult for lipid-amylose to flow out during pasting .The relationship between starch fats and amylose has a large influence on the physical-chemical properties.
Fortuna and Juszczak (2000) compared the physico-chemical properties of natural cereal starches. They obtained results with differences in pasting temperatures of 2°C for respective starches. The potato starch tested had a pasting temperature of 61.5-71°C, while in the case of the barley starch, the interval amounted to 75-96°C. Oat and wheat starches were characterized with the highest pasting tempe-ratures. As with the other cereal starches, granules of barley starch contain fat substances proportional to the content of amylose. The results obtained referring to pasting tempe-ratures of cereal starches and potato starch are slightly higher than the data available in the literature.
On the basis of the analysis of the thixotropic features of the starches tested, it was found that the gel of the millet starch had, decidedly, the highest amount of the coefficient of thixotropyKt amounting to 37.43. Rye wheat had the lowest value of the coefficient discussed – at 3.831. In the case of the barley and wheat starches, the thixotropic coefficients were similar and amounted to 9.839 and 10.872. Triticale starch came second after the rye wheat with the lowest coefficient,Kt. A higher coefficient was accompa-nied with a larger hysteresis loop area. The lowest surface hysteresis loop area – at 356.29 – was found in the rye wheat while the largest – at 3 840.89 – was found in the millet starch. As far as the increase of the size of the hysteresis loop is concerned, starches can be arranged in the following man-ner: rye, triticale, wheat, barley, potato and millet starch.
Djakovicet al. (1990) examined the thixotropic beha-viour of corn-starch and gels of various kinds. They con-ducted measurements of thixotropic properties on 8% glued residues of homogenized starches and non-homogenized starches at temperatures of 72, 83 and 94°C. The thixotropy coefficient for non-homogenized starch gel at a temperature of 72°C amounted to 8.6. In higher temperatures,Kt was higher and amounted to 14.9 and 177.
Ferguson and Kemb³owski (1995) claims that the phe-nomenon of thixotropy could be explained by the changes in the microstructure of the arrangement tested. The gradual increase of the shearing forces, namely the movement of the spindle, caused an increase in tangent pressures in the spe-cimen tested. Viscosity decreased as a result of the destru-ction of the internal structure of the arrangement, that is, the tearing of the bonds between the particles. The change in the shearing velocity from the maximal value to zero caused, in
turn, a decrease in tangent pressure and an increase in the viscosity of any given arrangement. One can state that in the case of the same velocities, the values of the shearing forces are lower when compared to those already registered in the shearing process. Djakovicet al. (1990) claim that starch gels retrieve their structures after a span of 10-20 min.
According to Genovese and Rao (2003) starch gels can be considered to be granule-reinforced continuous networks. The elasticity of this network increases with the volume fraction of the granules according to a power-law relation-ship and according to the scaling theory, the exponential factor depends on the granule surface morphology, which can be quantitatively characterized by the fractal dimensions.
CONCLUSIONS
1. Cereal starches were characterized with a fairly smooth surface because they were characterized with a fractal dimension of edge line slightly above 1.
2. Potato starch differed from cereal starches by a higher fractal dimension of 1.029 which suggested that the edge line of the granules of that starch was more irregular.
3. Cereal starches had a similar pasting temperature falling between intervals of 82-89°C and a gelling tempe-rature of 76-79°C. Potato starch differed vastly from those starches as it started pasting at a temperature of 67°C and gelled at a temperature of 70°C.
4. Decidedly the highest thixotropic properties were found in the case of the millet starch whose thixotropic coefficient amounted to 37.43, while the lowest was found in the rye starch with a coefficient of 3.83.
5. Together with the increase in the size of the starch granules, the thixotropic properties of the starch gruel decreased.
6. Potato starch differed vastly from cereal starches in its chemical content, its higher fractal dimension as well as its lower pasting and gelling temperature.
REFERENCES
AACC Standard Methods: Method AACC 08 – 17. St. Joseph, MI, USA.
Aguilera J.M., Stanley D.W., and Baker K.W., 2000. New dimensions in microstructure of food products. Trends in Food Sci. Technol., 11, 3-9.
Calzetta-Resio A., Aguerre R.J., and Suarez C., 1999. Analysis of the sorptional characteristics of amaranth starch. J. Food Eng., 42, 51-57.
Djakowiæ L.J., Sovilii V., and Miloœeviæ S., 1990. Rheological behaviour of thixotropic starch and gelatin gels. Starch/ Stärke 42 , 10, 380-385.
Ferguson J. and Kemb³owski Z., 1995. Applied Rheology of Fluids (in Polish). MARCUS Press, £ódŸ, Poland. Firoozmand H., Murray B.S., and Dickinson E., 2007.
Genovese D.B. and Rao M.A., 2003. Role of starch granule characteristics (volume fraction, rigidity, and fractal dimen-sion) on rheology of starch dispersions with and without amylose. Cereal Chem., 80(3), 350-355.
Gonzales-Barron U. and Butler F., 2008. Fractal texture analysis of bread crumb digital images. Eur. Food Res. Technol, 226, 721-729.
Herrera-Gómez A., Canónico-Francob M., and Ramose G., 2005.Aggregate formation and segregation of maize starch granules cooked at reduced moisture conditions. Starch/ Stärke, 57, 301-309.
Jayakody L. and Hoover R., 2008.Effect of annealing on the mo-lecular structure and physicochemical properties of starches from different botanical origins – A review. Carbohydrate Polymers, 74, 691-703.
Juszczak L. and Fortuna T., 2000.Surface structure of starch
granules (in Polish).¯ywnoœæ, Technologia, Jakoœæ, 4(25), 36-44.
La Scala Jr N., Panosso A.R., Pereira G.T., Gonzalez A.P., and Miranda J.G.V., 2009. Fractal dimension and anisotropy of soil CO2emission in an agricultural field during fallow. Int. Agrophysics, 23, 353-358.
Mitrus M. and Moœcicki L., 2009.Physical properties of thermo-plastic starches. Int. Agrophysics, 23, 305-308
Moreno M.A., Bouchon P., and Brown C.A., 2010. Evaluating the ability of different characterization parameters to de-scribe the surface of fried foods. Scanning, 32, 212-218. Nagai T. and Yano T., 1990.Fractal structure of deformed potato
starch and its sorption characteristics. J. Food Sci., 55, 1334-1337.
Nara S., Mori A., and Komiya T., 1990. Study on deformed potato starch and its sorption characteristic. J. Food Sci., 5, 1334-1337.
Pedrycz W. and Bargiela A., 2003.Fuzzy fractal dimensions and fuzzy modeling. Information Sci., 153, 199-216.
Smoczyñski M., Dziuba Z., and Œmietana Z., 1999.Application of fractal analysis to the characterization of microstructure of different food products. Natural Sci., 3, 10-17.
Tang H.P., Zhu J. L., Xi Z.P., Di X.B., Wang J.Y., and Ao Q.B. ., 2010. Impact factors of fractal analysis of porous structure. Sci. China Tech Sci., 53, 348-351.
Wierciñski J., 1999.Guide to the exercise of instrumental chemi-cal analysis of food ingredients (in Polish). University of Agriculture Press, Lublin, Poland.