STUDY ON WICKING MEASUREMENT IN THIN LAYER
TEXTILES BY PROCESSING DIGITAL IMAGES
F. Memariyan* and E. Ekhtiyari
Department of Textile Engineering, Yazd University P.O. Box 89195-741, Yazd, Iran
[email protected] - [email protected]
*Corresponding Author
(Received: April 18, 2009 – Accepted in Revised Form: November 5, 2009)
Abstract The purpose of this work is to assess and develop experimental techniques that allow wicking measurement over a wide range of textiles. Various kinds of fabrics, nonwoven layers and an electro spinning nylon layer were used as the test materials. A syringe is used to drop a 0.02 g spot of distilled water on the sample and a digital camera to take pictures simultaneously. When the wicking process stops, the images are processed and the increase in wicking area is measured using Matlab 7.4 and a set of image processing tools. It is shown that the newly developed technique is able to test the wicking behavior of various kinds of textiles with different thickness.
Keywords Wicking Measurement, Image Processing, Textiles, Fabrics, Paper, Thin Layer
ﻜﭼ
ﻴ
هﺪ
افﺪﻫ ﻳ ﻘﺤﺗﻦ ﻴ ﺑ،ﻖ ﻪ ﮔرﺎﻛ ﻴ ﺮ ي شوردﻮﺒﻬﺑو ﺎﻫ ي ﺑﺮﺠﺗ ﻲ ﺋﻮﻣبﺬﺟ ﻴ ﮕﻨ ﻲ ﻪﺑ ﻮﺻ ﺗر ﻲ ﻣ ﻲ نﺎﻜﻣاﻪﻛﺪﺷﺎﺑ
ﻪﺑ ﮔرﺎﻛ ﻴ ﺮ ي ﺳوهدوﺪﺤﻣردنآ ﻴ
ﻌ ﻲ ﻣتﺎﺟﻮﺴﻨﻣزا ﻴ
ﺮﺴ ددﺮﮔ
.
ﻔﻠﺘﺨﻣعاﻮﻧا ﻞﻣﺎﺷهدﺎﻔﺘﺳادرﻮﻣداﻮﻣ ﻲ ،ﻪﭼرﺎﭘزا ﻻ ﻳ ﻪ ﺎﻫ ي ﺑ ﻲ ﻻوﺖﻓﺎﺑ ﻳ روﺮﺘﻜﻟاﻪ ﻳ ﺴ ﻲ ﺎﻧهﺪﺷ ﻳ ﻣنﻮﻠ ﻲ ﺪﺷﺎﺑ .
هﺮﻄﻗﮓﻧﺮﺳزاهدﺎﻔﺘﺳاﺎﺑ ا
ي ﻢﺠﺣﻪﺑﺮﻄﻘﻣبآزا
02 / 0
ور ﺮﺑ مﺮﮔ ي ر ﻪﻧﻮﻤﻧ ﻳ ﻣﻪﺘﺨ ﻲ ودﻮﺷ زا هدﺎﻔﺘﺳاﺎﺑ ﻳ ﺑرود ﻚ ﻴ دﻦ ﻳ ﺠ ﻴ ﻟﺎﺘ ﻲ ﻢﻫ ﻣﻪﺘﻓﺮﮔ ﺲﻜﻋﻪﻧﻮﻤﻧ زا نﺎﻣز ﻲ دﻮﺷ . ﻣﺎﮕﻨﻫ ﻲ اﺮﻓ ﻪﻛ ﻳ ﻣ ﻒﻗﻮﺘﻣبآبﺬﺟ ﺪﻨ ﻲ
وﺎﺼﺗ ،دﻮﺷ ﻳ
ﻣراﺮﻗ شزادﺮﭘدرﻮﻣ ﺮ ﻲ
ﮔ ﻴ اﺰﻓاو ﺪﻧﺮ ﻳ
ﺣﺎﻧ ﺖﺣﺎﺴﻣ ﺶ ﻴ
ﻪ
ﺐﻠﺘﻣﻪﻣﺎﻧﺮﺑزاهدﺎﻔﺘﺳا ﺎﺑبﺬﺟ
4 / 7 ﺎﻫراﺰﺑاو ي ﻮﺼﺗشزادﺮﭘ ﻳ
ﻣﺖﺳد ﻪﺑﺮ ﻲ
آﻳ ﺪ
.
اﻪﻛﺖﺳاهﺪﺷ هداد نﺎﺸﻧ ﻳ
ﻦ
ﻣشور ﻲ ﺳرﺮﺑردﺪﻧاﻮﺗ ﻲ
ﺋﻮﻣرﺎﺘﻓر ﻴ ﮕﻨ ﻲ ﺖﻣﺎﺨﺿﺎﺑتﺎﺟﻮﺴﻨﻣﻒﻠﺘﺨﻣعاﻮﻧا ﺎﻫ ي ﻪﺑتوﺎﻔﺘﻣ رﺎﻛ ﻪﺘﻓﺮﮔ دﻮﺷ . 1. INTRODUCTION
The movement of liquids in fabrics is of interest in a variety of applications, including fabric dyeing and finishing, liquid filtration, clothing comfort, highly absorbent materials, geotextiles, etc [1,2]. Due to the body activity, the wearer perspires and the cloth worn next to the skin will get wet. These moist fabrics can reduce the body heat. It can also make the wearer tired. So, cloth worn next to the skin should assist quick moisture release into the atmosphere. Therefore, wicking measurement in fabrics is a topic of interest [3].
Kissa [4] made a clear distinction between wetting and wicking. Fiber wettability is a prerequisite for wicking, since a liquid that does not wet fibers cannot wick into a fabric. Wicking can only occur when fibers with capillary spaces between them are wetted by a liquid. The resultant
capillary forces drive the liquid into the capillary spaces. Wetting is completely determined by the surface properties of the fibers and the wetting liquid, whereas wicking is also affected by the way the fibers or yarns are arranged into fabrics [5]. Attempts to obtain meaningful laboratory measurements of wicking have given rise to a multiplicity of test methods, and the diversity of the results has led to some confusion in their interpretation, especially as some of the methods do not adequately distinguish between wickability (the ability to sustain capillary flow), and wettability which describes the initial behavior of a fabric, yarn, or fiber when brought into contact with liquid (prior to any wicking taking place) [6].
spontaneous wicking occurs due to capillary forces. The absorption height is recorded as a function of time and the absorption rate is calculated [7,8]. In a Siphon test technique [6] a rectangular strip of the test fabric is used as a siphon, by immersing one end in a reservoir of water or saline solution and allowing the liquid to drain into a collecting beaker from the other end which is placed at a lower end. The amount of liquid transferred can be determined by weighing the collecting beaker [1]. In areal wicking tests, a drop of liquid is delivered from a height of approximately 6 mm onto a horizontal specimen of the test fabric. The region of the fabric on which the drop falls is illuminated by a beam of light to create a bright reflection from the liquid surface and the elapsed time between the drop reaching the fabric surface and the disappearance of the reflection from the liquid surface is measured. The disappearance of the reflection is assumed to indicate that the liquid has spread over and wetted the fabric surface. The elapsed time recorded is taken as a direct measure of the fabric wettability, the shorter is the time, the more wettable is the fabric [1,2]. DeBoer’s approach [9] is to measure the area of the wetted region of the fabric at the moment reflection ceases, or the mass of liquid absorbed as a percentage of the dry weight of an area of fabric equal to the area of the wetted region. The transverse wicking test consists of a horizontal sintered glass plate fed from below with water from a horizontal capillary tube, the level of which can be set so that the upper surface of the plate is kept damp. A disk of the test fabric is placed on the plate and held in contact with it under a defined pressure applied by placing weights on top of it. The position of the meniscus along the capillary tube is recorded at various time intervals as water is wicked through the fabric layer [5]. The mass transfer rate over the first few seconds or minutes after initial contact is recorded [10], this being taken to be the indicator of wickability relevant to perspiration transfers. This apparatus has also been used to measure liquid transport for periods of up to an hour after initial contact [11]. Until now, most of the efforts to determine the wicking behavior of textiles were based on studies of laboratory test methods mentioned above. Only recently have researchers attempted to apply a digital image analyzer to quantify the wicking rate of textiles. This method has been effective for
determining the wicking rate of woven and nonwoven fabrics [12]. However, in order to analyze wicking behavior of thin layer textiles quantitatively in the model, there is still work to be done. In this research work an areal test method has been developed using image processing. Applying the new method can be helpful for measuring the wicking in textiles with different thickness layers.
1.1. Experimental
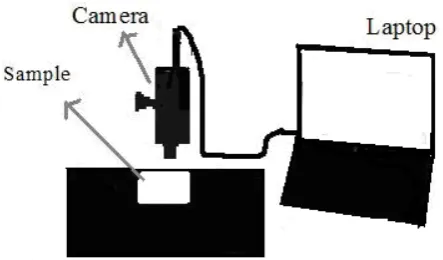
1.1.1. Method In this developed wicking experiment, samples are prepared to the dimension of 4×4.5cm². After putting them on a black surface, a syringe is used to drop a liquid of about 0.02 g from the height of 6 cm to the specimen. To measure the rate of area increase of the wicking spot, several pictures of each sample were taken, using a PC-CAM 600 digital camera mounted above the sample as shown in Figure 1. The distance between the camera and the sample was about 20cm. After different wicking times, the area of the wicking spot is measured using image processing tools. The rate of area increase of the wicking spot was used as a measure of the wicking rate of the material.
2. EXPERIMENTAL SET UP
Lightening is very important for image processing. Using any kind of lightening system to measure the area of the water spot on the sample would create
(a) (b) (c)
(d) (e) (f)
(g) (h)
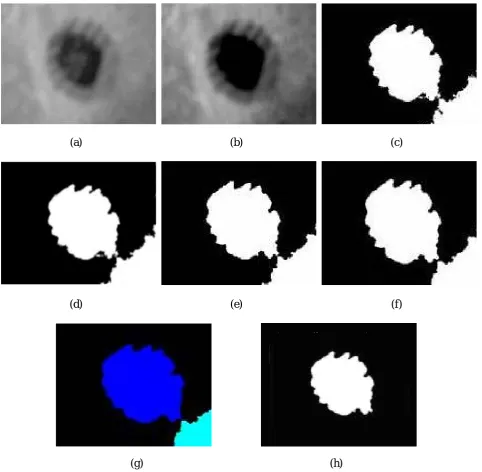
Figure 2. (a) The original image, (b) the improved image contrast, (c) the threshold operation, (d) the image after filling the holes, (e) separating image areas, (f) the image after opening, (g) the image after labeling
and (h) selecting the spot on the image. heat and so it causes the spot to disappear. Therefore
no special lightening system has been used to take the pictures. First the contrast of the image is increased about 10.5 % which results in the image of Figure 2b. This image is then thresholded, which leads to a binary image as shown in Figure 2c. To determine the threshold value, the average value of
all pixels is attained experimentally in each stage and the pixels smaller than the calculated value are omitted from the image and this operation continues for all the other remained pixels.
These techniques were applied to remove certain unwanted features (like noise).
processing binary images based on shapes. These operations take a binary image as input, and return a binary image as output. The value of each pixel in the output image is based on the corresponding input pixel and its neighbors. By choosing the neighborhood shape appropriately, it is possible to construct a morphological operation that is sensitive to specific shapes in the input image [13]. First it is used to fill holes on the outer edge of an image that are not connected to the background. A hole is defined as an area of dark pixels surrounded by lighter pixels. It can be calculated using an algorithm based on morphological reconstruction [14]. If the threshold image has no holes on it, the image is feedback without any changes to the next stage. Then an operation is used to set the pixels to 1 if five or more pixels in its 3-by-3 neighborhood are 1's; otherwise, it sets the pixels to 0. This operation will help to disconnect the neighboring regions to totally separate parts as indicated in Figure 2e. These morphological image processing operators can simplify image data by eliminating irrelevant objects (such as small spots caused by noise) while preserving the objects’ essential shape characteristics. They are defined in terms of a structuring element, which is a small window that scans the image and alters the pixels due to its window content. The choice of the proper structuring element is important, most commonly little rectangles, squares, disks, or crosses are used depending on the application and morphological properties of the images. Dilation and erosion are the two major operations. A dilation of image A with structuring element B blows up the object, erosion lets it shrink. Other operations, such as the opening (an erosion followed by a dilation) and the closing (a dilation followed by an erosion), are derived from the basic operators.
To overcome island forming due to the texture of the textile, a morphological “opening” is performed. To perform the opening, a structuring element is chosen. This structuring element should be large enough to remove the lines when the image is eroded, but not large enough to remove the rectangles. An opening operation using a disk with radius of 1 pixel as the structuring element is performed, as shown in Figure 2f. Then a number is allocated to each white region in the binary image. After labeling the whole image, the pixel area of the spot can be measured by selecting the
label allotted number and counting the number of pixels in the final segmentation. This number is transformed into an actual area through calibration to the measurement strip.
3. RESULTS AND DISCUSSION
The purpose of this work is to find a way of measuring wicking in textiles with thin layers. To do this, the image processing method is used to measure the wicking behavior in textiles. None of the other methods mentioned above are useful for measuring wicking in thin layers. During vertical upward wicking, the gravity influences the flow of liquid. Moreover, wicking goes on in a single dimension, causing differences in wicking behavior in warp and weft directions [2]. In the transverse wicking test, precautions should be taken to minimize the head of pressure in the supply and to ensure that the supply tube is readily capable of delivering liquid at the rate demanded by the test specimen. The effect of contact pressure between supply and test specimen should also be considered. The weight used on the sample to keep it straight can also influence the results.
In the siphon test the flow is aided by gravity and occurs through an already saturated fabric with a lower resistance to flow than an initially dry fabric [2].
The areal test method evaluates the wicking subjectively, so it has many errors. In the proposed method a 0.02 g spot of water was dropped on the samples and the increase in the area was measured using the analysis of the pictures which were taken continuously from the samples. The new method can be used over a wide range of textiles. To evaluate the efficiency of the described method, wicking behavior on different samples has been considered. To compare the wicking process on different materials, the same amount of water is used for all the samples. However, more mass of water can be used for measuring the wicking on samples with higher density. In this case, a bigger spot of water is created on the surface of the sample when the wicking starts and so measurement of the wicking process is more accurate.
TABLE 1. Material Characteristics used for the Experiment.
Sample Code Material Weight (g/m²)
1 Cotton Fabric 123.4
2 Nonwoven Layer (100 % Cotton) 34.6
3 Paper Cotton Fabric 29.84
4 Woolen-Polyester Fabric 206
TABLE 2. Characteristics of Electro Spun Nylon Layer used for the Experiment.
Sample Code Fiber Diameter Voltage Distance Solution Density
5 787 nm 25 Kv 8 cm 15 %
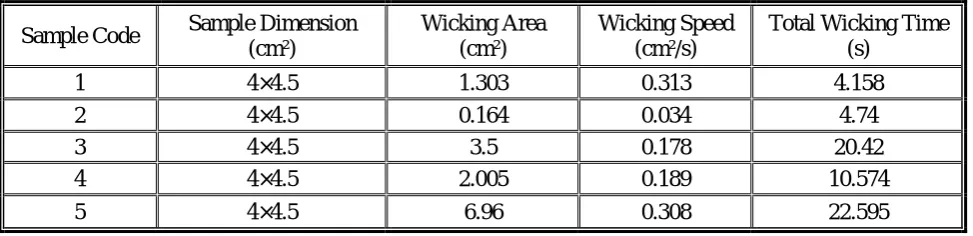
TABLE 3. Wicking Properties of the Tested Materials.
Sample Code Sample Dimension (cm²)
Wicking Area (cm²)
Wicking Speed (cm²/s)
Total Wicking Time (s)
1 4×4.5 1.303 0.313 4.158
2 4×4.5 0.164 0.034 4.74
3 4×4.5 3.5 0.178 20.42
4 4×4.5 2.005 0.189 10.574
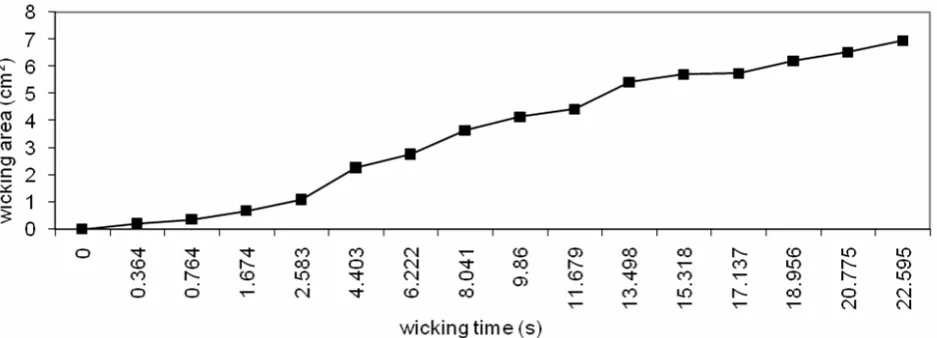
5 4×4.5 6.96 0.308 22.595
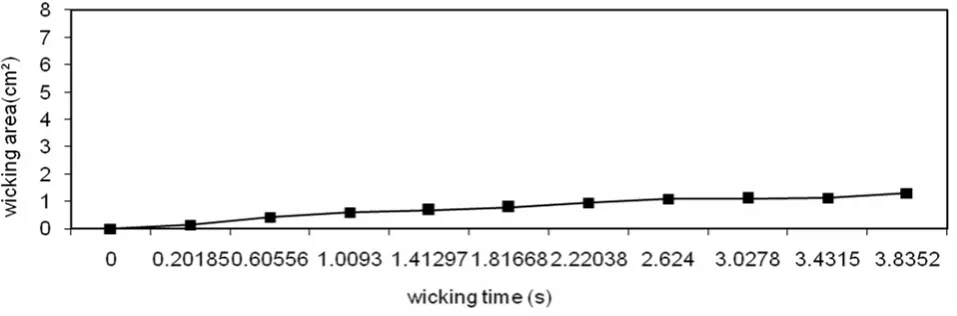
The electro spun layer was produced using nylon 6 as the polymer and formic acid as the solvent. The characteristic of the electro spun layer used for this experiment is shown in Table 2. Each sample is tested using 10 specimens and the average wicking area, wicking speed and total wicking time for each one is shown in Table 3. Wicking speed is calculated by dividing surface area by the time elapsed to distribute water on this area. The standard deviation on ten measurement of each sample is small and is determined due to small differences between the textures of the specimens. The image processing tools also result in a small standard deviation. The repeatability of the results for all the samples is about 97 %. Wicking area as a function of wicking time for each sample is plotted in Figures 3-7.
As it is shown in the figures, wicking time in fabrics or nonwoven layer is much less than the
Figure 3. The wicking area as a function of wicking time for a cotton fabric.
Figure 4. The wicking area as a function of wicking time for nonwoven layer.
Figure 6. The wicking area as a function of wicking time for woolen/polyester fabric.
Figure 7. The wicking area as a function of wicking time for electro spinning nylon layer.
to be distributed over a larger surface area, because it is thinner and the smaller volume of water remains in any layer surface and specific amount of water distributes over a larger surface area. In electro spun layers, the increase in ratio of area against volume results in more contact between the water and surface layer. So, the wicking process has a fast speed and a small amount of water on the extra thin layer distributes over a greater surface area. Therefore it is obvious that it would take more time.
The wicking speed in the paper is greater than in the nonwoven layer. Nonwoven layer has higher surface density and fewer pores in comparison to
the paper which results in less capillary spaces and less wicking speed.
4. CONCLUSIONS
all directions. Moreover, this method is a horizontal wicking experiment and therefore the influence of the gravity can be neglected.
The described method is proved to be effective for determining the wicking rate of the woven fabrics and nonwovens of different thickness. The proposed method is able to measure the amount, speed and time of the wicking, simultaneously. This method can be used to compare the wicking properties of similar or different materials.
For wicking comparison of materials with higher weights and increased thickness a bigger spot of water can be used.
5. REFERENCES
1. Ghali, K., Jones, B., and Tracy, J., “Experimental Techniques for Measuring Parameters Describing Wetting and Wicking in Fabrics”, Textile Res. J., Vol. 64, No. 2, (1994), 106-111.
2. Zhong, W., Ding, X. and Tang, Z.L., “Modeling and Analyzing Liquid Wetting in Fibrous Assemblies”,
Textile Res. J., Vol. 71, No. 9, (2001), 762-766.
3. Ramachandran, T., Kesavaraja, N., “A Study on Influencing Factors for Wetting and Wicking Behaviour”,
IE (I) Journal. TX, Vol. 84, (2004), 37-41.
4. Kissa, E., “Wetting and Wicking”, Textile. Res. J., Vol. 66, (1996), 660-668.
5. Van, P., Cocquyt, J., Flores, S., Demeyere, H. and
Declercq, M., “Quantifying Wetting and Wicking Phenomena in Cotton Terrys as Affected by Fabric Conditioner Treatment”, Textile. Res. J., Vol. 72, (2002), 423-428.
6. Harnett, P.R. and Mehta, P.N., “A Survey and Comparison of Laboratory Test Methods for Measuring Wiking”, Textile Res. J., Vol. 54, (1984), 471-478. 7. Ferrero, F., “Wettability Measurements on Plasma
Treated Synthetic Fabrics by Capillary Rise Method”,
Polymer Testing, Vol. 22, (2003), 571-578.
8. Miller, B., “Critical Evaluation of Upward Wicking Tests”, International Nonwovens Journal, Vol. 9, (2000), 35-40.
9. De Boer, J., “The Wettability of Scoured and Dried Cotton Fabrics”, Textile Res. J., Vol. 50, (1980), 624-631.
10. Buras, E.M., Goldthwaite, C.F. and Kraemer, R.M., “Measurement and Theory of Absorbency of Cotton Fabrics”, Textile Res. J., Vol. 20, (1950), 239-248. 11. Komer, W., “An Absorbent Synthetic Fiber for High
Wear Comfort”, Chemiefasern/Textilind, Vol. 29, (1979), 452-462.
12. Morent, R., Geyter, N.D., Leys, C., Vansteenkiste, E., Bock, J.D. and Philips, W., “Measuring the Wicking Behavior of Textiles by the Combination of a Horizontal Wicking Experiment and Image Processing”,
Review of Scientific Instruments, Vol. 77, No. 9, (2006),
093502.
13. Haralick, R.M., Sternberg, S.R. and Zhuang, X., “Image Analysis using Mathematical Morphology: Part I”,
IEEE Transactions on Pattern Analysis and Machine
Intelligence, Vol. 9, No. 4, (1987), 532-550.