R E S E A R C H
Open Access
DTrace: fine-grained and efficient data
integrity checking with hardware instruction
tracing
Xiayang Wang
*, Fuqian Huang and Haibo Chen
Abstract
Recently released Intel processors have been equipped with hardware instruction tracing facilities to securely and efficiently record the program execution path. In this paper, we study a case for data integrity checking based on Intel Processor Trace (Intel PT), the instruction tracing facility on x86 processors. We incorporate software instrumentation and hardware instruction tracing to guarantee fine-grained data integrity without frequently switching the processor mode. We incorporate the idea in a system named DTrace which provides primitives to instruct Intel PT to capture the data load and store events, even current Intel PT implementations only record control transfers. The trace is analyzed before the program makes security-sensitive operations. We apply DTrace in several case studies to show that the primitives that DTrace provides are easy to use and help to enhance data integrity in applications. We further evaluate DTrace with several microbenchmarks to show the time cost that DTrace’s data tracing operation incurs. We also evaluate DTrace on Nginx to show the performance impact when Nginx is enhanced in security to provide the integrity during the runtime execution for programmer-defined security sensitive data. We find the performance overhead that DTrace incurs for the data tracing is moderate.
Keywords: Data integrity checking, Hardware instruction tracing
Introduction
Hardware instruction tracing is a dedicated hardware facility to collect information on program execution for debugging. Examples are Intel Processor Trace (Intel PT)
(Reinders 2013) and ARM Embedded Trace Macrocells
(ETM) (ARM2016). They capture the information of
pro-gram execution path in real-time and record the trace in the form of data packets. The debugger analyzes the trace and infers program execution events such as what instructions the program has just executed.
Researchers have explored to leverage Intel PT to
enhance software debugger (Kasikci et al.2017; Cui et al.
2018) and enforce the security property of control flow
integrity (CFI) (Liu et al.2017; Ge et al.2017; Ding et al.
2017). These tools and systems benefit in terms of effi-ciency and accuracy by digging out the information about program control flow captured by Intel PT including timestamps and control transfers.
*Correspondence:[email protected] Shanghai Jiao Tong University, Shanghai Shi, China
In this paper, we introduce a case for data integrity checking, which defeats memory corruptions over security-critical data. We propose an incorporation of software instrumentation and hardware instruction trac-ing for auxiliary information about program execution captured at real-time to realize data protection. The pro-totype, named DTrace, is implemented based on Intel PT, while the idea of software-defined trace data is general to hardware instruction tracing.
Software-defined trace data enables DTrace to check the integrity of word-sized memory data even if the security-critical and non-security-critical data reside in the same page. DTrace instructs Intel PT to trace the software-specified memory store and load operations in an application. There is no restriction on where the accessed data resides in memory. DTrace prevents the traced application from making security-sensitive operations after a memory cor-ruption is detected. It remembers the stored value of each store event. Once a piece of corrupted data is loaded from memory, the tracing hardware will record the corrupted value as the load operation result. DTrace can detect the
corruption as it cannot match the remembered stored value and the loaded value at that memory address.
Previous data integrity enforcement techniques set up an isolated memory region which is free from the risk of memory corruptions. They need software-based
tech-niques (Akritidis et al.2008; Castro et al.2006; Oleksenko
et al. 2017; Erlingsson et al. 2006; Koning et al. 2017)
or hardware supports (Song et al.2016; Wang and Jiang
2010; Hunt et al.2016; Baumann et al.2014; Kim et al. 2017; Chen et al.2016; Azab et al.2014; Rubinov et al. 2016) to enforce the isolation, which restrict all memory write operations or require time-consuming operations of switching processor mode to access the isolated memory region. In comparison, DTrace’s data integrity
enforce-ment is bothfine-grainedand efficient.
We find that hardware instruction tracing simplifies the isolation enforcement as it records tracing data securely and efficiently. For example, Intel PT can be configured by the kernel driver to save the trace into a memory buffer which is inaccessible from the traced application. Thus the application is incapable of corrupting the trace. Addition-ally, the hardware facility addresses the memory buffer with physical memory address, which allows the trace to be written to the user-mode inaccessible memory buffer without a processor mode switching to the kernel mode.
Current Intel PT implementations record only control transfer instructions like conditional jumps and indi-rect function calls, and simply ignore all memory access events. Future Intel processor releases will reportedly
include a new instruction named PTWRITE to insert
software-defined value into the trace to enhance
debug-gers (Strong et al.2015). AsPTWRITEis still unavailable
on current processor releases yet (Hunter2017), DTrace
emulates PTWRITE by encoding the memory data load
and store events with control transfer instructions and synthesizes the events from the trace.
The prototype provides a few primitives for program-mers or program analyzer to mark the security-critical data load and store operations. We provide two case stud-ies on different applications that show DTrace’s primitives are easy to use and effective to enhance the data integrity property in applications.
Furthermore, we describe another two case studies on Nginx to demonstrate that DTrace can check the integrity of fine-grained security-critical data with a moderate per-formance overhead. The first case enhances Nginx’s access control implementation by marking certain in-memory variables that determine whether requests from certain hosts should be blocked. The second case provides a com-plete protection on Nginx’s function pointers to defeat control flow hijacking attacks. We evaluate the perfor-mance overhead that DTrace incurs in these two cases. We further evaluate Redis while enabling the protec-tion of DTrace. From all the case studies and real-world
application evaluations, we believe that the protection provided by DTrace would be practical on server and
var-ious cloud platforms (Amazon2018; Wang et al.2017) to
enforce data integrity checking on server applications.
We both evaluate the overhead with PTWRITE and
the emulated data recording operations. We find that
the overhead varies among the latency of PTWRITE
and the frequency that the data tracing operations are used. Overall, DTrace incurs moderate performance over-head in these two cases while the security is significantly enhanced by defeating memory corruption attacks.
We further model the latency of PTWRITE and
prospect the performance impact when we adopt it on
future Intel processor releases. We find that PTWRITE
would further reduce the overhead of data tracing oper-ations both in micro-benchmarks and Nginx evalautions
while DTrace’s emulation of PTWRITE provides an
in-stock solution that enhances the integrity of security-critical data.
Overall, this paper makes the following contributions:
– A novel design named DTrace that incorporates hardware instruction tracing mechanism into data integrity protection which realizes hardware data tracing and provides fine-grained and efficient data integrity guarantee.
– An emulation technique that makes hardware data tracing realizable on commodity Intel processors with moderate performance overhead.
– Evaluations in micro-benchmarks and a real-world application which show that DTrace incurs moderate performance overhead while enhances the data integrity property.
Intel processor trace
Starting from the fifth generation, Intel architecture pro-vides an extension named Intel Processor Trace (Intel PT) to help the software debugger reconstruct the pro-gram flow with low performance perturbation (Reinders 2013). Each core contains dedicated tracing hardware and
generatespacketsindicating events like branch-taken and
indirect function invocations along with program exe-cution. Packets are highly compressed and need to be decoded by the debugger. Intel PT is turned on by config-uring model specific registers which can only be accessed at OS-privileged level. It can also be configured to only trace the program execution within a range of virtual addresses which are specified by IP Filters.
As Intel PT is designed to record program execution, it only records control flow information like instruction pointers, indirect branch targets and directions of
con-ditional branches. Figure1shows a flow of packets
Fig. 1Packets generated by Intel PT
Intel PT is enabled, a Packet Generation Enable (PGE) packet leads the following packets. After executing a con-ditional branch, the Taken or Not Taken (TNT) decision is recorded in a TNT packet. On an indirect jump, a Target IP (TIP) packet records the destination address. A Packet Generation Disable (PGE) packet marks the end of the packet flow once the tracing facility is turned off.
Intel has proposed a new instruction PTWRITE on
future generation Intel processors. It makes Intel PT
generate a packet whose payload isPTWRITE’s
parame-ter. Intel suggests to use it to provide more information about the program execution for debuggers (Strong et al.
2015). ThoughPTWRITEis unavailable on any currently
released processor (Beeman 2017; Hunter 2017), Intel
mentions thatPTWRITEcan typically be executed a
sin-gle processor cycle (Strong et al.2015).
The tracing hardware writes packets into discontin-uous memory buffers. Intel PT uses Table of Phys-ical Addresses (ToPA) to address each piece of the
buffer. As Fig.2 illustrates, the address of each piece of
buffer is set in a ToPA entry. A model specific regis-ter IA32_RTIT_OUTPUT_BASE holds the base address of ToPA Each entry in the ToPA can be configured with an INT bit, which instructs Intel PT to trigger a Perfor-mance Monitoring Interrupt (PMI) when that piece of buffer becomes full.
Motivating example
Programmers enjoy the flexibility provided by memory unsafe languages like C and C++ to address arbitrary vir-tual memory locations via pointers, while taking the risk that memory error bugs, such as buffer overflow, would be exploited by malicious users to corrupt security-sensitive data. Attackers can construct a series of memory error exploits to be capable of writing any data to arbitrary
location (Hu et al.2015). Defense mechanisms like Data
Execution Prevention (DEP) (Microsoft 2018) and
con-trol flow integrity (CFI) enforcement (Zhang et al.2013;
Ding et al.2017) prevent the attacker from inserting code
and corrupting control data, like return addresses and function pointers, and further controlling the execution.
However, memory error exploits can change the appli-cation’s behavior without corrupting any control data, which does not violate control flow integrity (CFI)
pol-icy (Abadi et al. 2005) and thus bypasses CFI
enforce-ment. Recent studies have demonstrated the threat of
non-control-data attacks, such as corrupting configura-tion and decision-making variables and bypassing access
restrictions (Chen et al.2005; Song et al.2016; Hu et al.
2016).
Take the code snippet from Nginx in Listing 1 as an
example. Nginx can be configured to block requests for certain files from certain hosts. Such rule is represented
by an object of ngx_http_access_rule_t. During
initial-ization, Nginx reads the configuration file and creates ngx_http_access_rule_t objects. When Nginx receives an
HTTP request, it matches the incoming request’s addr
with records inrule.
1 typedef struct {
2 in_addr_t mask;
3 in_addr_t addr;
4 ngx_uint_t deny;
5 } ngx_http_access_rule_t;
6
7 char *ngx_http_access_rule(ngx_conf_t *cf) {
8 ngx_http_access_rule_t *rule = ...
9 rule->deny = is_deny(cf->args->elts[0].data[0]);
10 dtrace_store64(&rule->deny, rule->deny);
11 // similarly for rule->addr and rule->mask
12 ...
13 }
14
15 ngx_int_t ngx_http_access_inet(in_addr_t addr,
16 ngx_http_access_rule_t *rule) {
17 dtrace_load64(&rule->deny, rule->deny);
18 // similarly for rule->addr and rule->mask
19 if ((addr & rule->mask) == rule->addr
20 && rule->deny)
21 return NGX_HTTP_FORBIDDEN;
22 ...
23 }
Listing 1Simplified code snippet of Nginx. The access control of Nginx is determined by several in-memory variables. Function ngx_http_access_rule sets those variables and function ngx_http_access_inet reads them. Two instrumented primitives dtrace_store64 and dtrace_load64, help to check the value of deny. The instrumentations are underlined.
The rules are vulnerable to memory errors as they are stored in memory. A memory error exploit can
cor-rupt rule→deny before Nginx reads it. For example, if
rule→denyis reset to zero, the access restrictions in Line
20 will be bypassed. Thus the attacker becomes privileged of requesting for the files through HTTP requests, where the files should be forbidden to access otherwise.
By checking the data integrity of rule→deny before
Nginx making any security-sensitive operations, DTrace guarantees that the value loaded in Line 20 is the same
as the value stored in Line 9 in Listing 1. With the two
inserted primitives, dtrace_store64 and dtrace_load64,
DTrace stops Nginx from making security-sensitive
oper-ations after rule→deny is corrupted. dtrace_store64
makes the hardware tracing facility generate packets representing an event that the program has stored a
64-bit value rule→deny into memory at the address of
&rule→deny. Similarly, dtrace_load64 makes the hard-ware tracing facility record an event of loading a corrupted
value of rule→deny. Later, before Nginx invokes a
sys-tem call to send the file in response to the HTTP request, DTrace checks all records, detects that the loaded value mismatches the previously stored value and aborts the process. Thus, even the access rule is manipulated by the attacker, Nginx does not send the file out of the server.
Assumptions. We assume that the attacker is able to read and write to an arbitrary location in the user-mode memory address space. The code pages are immutable as they are protected by page permission. We trust the oper-ating system kernel to load the instrumented program binary securely, set page permissions and configure the hardware tracing facility correctly.
DTrace assumes the application has been equipped with control flow integrity (CFI) enforcement. Thus the attacker cannot manipulate the control data to insert hardware tracing events. In fact, researchers have
pro-posed solutions (Ge et al. 2017; Liu et al. 2017; Ding
et al. 2017) to enforce CFI with the help of Intel PT.
DTrace’s design is compatible with the Intel-PT-based CFI enforcement.
Design
DTrace is designed to reuse hardware instruction tracing facility to record data access events in applications. However, there are three challenges that the design must deal with:
– The hardware instruction tracing facility on released Intel processors does not provide data access tracing instructions.
– The recorded data trace must be kept secure from memory corruption exploits in user mode. – Decoding the packets generated by the hardware
instruction tracing facility is time-consuming.
To deal with the first challenge, DTrace incorporates hardware instruction tracing with software instrumen-tation. DTrace provides a serial of primitives that can be inserted in the application code to guide the hard-ware to record the data access events. The primitives are implemented with hardware instruction tracing so that DTrace can later analyze the tracing result and restore the information that the primitive invocation represents. We propose a reuse of PTWRITE instruction to record the instrumented data access events. Additionally, we also propose an emulation of PTWRITE that works on currently released platforms since PTWRITE is not sup-ported yet.
for trace analysis, we delay the analysis to the time that the application actively traps to the kernel for security sensitive operations.
In terms of the third challenge, DTrace sets up a back-ground worker thread responsible for packet decoding. It does not occupy any computation resource until the appli-cation thread wakes it up on the buffer of packets becomes full. In order to eliminate the contention between the application thread and the background worker, as the worker may well not finish decoding when the core for application starts to generate new packets, DTrace incor-porates a dual-buffer design which makes the applica-tion and worker threads work on separate buffers. The buffers are exchanged when the application thread’s buffer becomes full and the application thread will wait for the background worker thread only if the worker is busy.
DTrace workflow
Figure 3 illustrates the cooperation of software
instru-mentation and hardware instruction tracing. DTrace pro-vides program primitives that programmers can manually insert into the source program (Step 1a) to mark the security-critical data load and store events. Alterna-tively, the protected application can be automatically instrumented by LLVM passes (Step 1b) if the mem-ory access events can be identified completely with static analysis.
The primitives are inserted into the program as function calls. The functions are implemented in a runtime file, which is statically linked to the instrumented source pro-grams (Step 2). The implementation encodes the memory
access events withPTWRITE operations. To record one
store operation, the implementation uses onePTWRITE
to record the address and anotherPTWRITEfor the data
value.
The runtime file contains an initialization procedure to notify the Trace Analyzer about all statically initialized variables (Step 3). It also contains operations to trap to the kernel to configure and enable Intel PT before the appli-cation starts execution (Step 4). During execution, the implemented primitives make Intel PT generate packets
(Step 5a). Intel PT writes the packets into a dedicated Trace Buffer in memory (Step 5b).
As configured by the Driver, Intel PT notifies the Driver via a Performance Monitoring Interrupt (PMI) when the Trace Buffer becomes overloaded (Step 6a). The processor pauses the traced program execution and switches to the PMI handler. The PMI handler invokes the Trace Analyzer (Step 6b).
Intel PT encodes tracing packets compactly for mem-ory efficiency. The Trace Analyzer reads the Trace Buffer, decodes all packets, filters out irrelevant ones and leaves only the packets generated from store and load event (Step 6c). On each store event, the Analyzer remem-bers the stored value as the current value on the stored address. Later, on decoding a load event, it looks for the remembered value on the same address and compares the loaded value with the remembered one. If there is a mismatch, the Analyzer reports the error and aborts the program (Step 7). Traces are also analyzed before the
pro-gram makes security-critical system calls such as write
andmprotect(Step 8).
As shown in the shaded area in Fig.3, the Trace Buffer
is allocated in kernel’s memory space. The Intel PT Driver and the Trace Analyzer work in kernel mode. Note that Intel PT writes the packets into the Trace Buffer without being restricted by virtual page permission (Step 5b).
DTrace primitives
DTrace provides a serial of primitives that help to cap-ture security-sensitive data access events. As we
dis-cussed in “Motivating example” section, dtrace_store64
anddtrace_load64are two of the primitives that capture the events of storing and loading the security-sensitive data. We list all primitives that DTrace currently supports
in Table1.
Each of the primitive accepts two parameters. The first parameter is the address of the security-sensitive variable, which helps the Trace Analyzer distinguishes different recorded variables. The second parameter is the value of the variable. The primitives vary on supported data sizes and load/store events.
Table 1Primitives provided by DTrace
Primitive Data length in bytes Places of instrumentation
dtrace_load64 8 Reading unsigned/signed long data
dtrace_store64 8 Writing unsigned/signed long data
dtrace_load32 4 Reading unsigned/signed int data
dtrace_store32 4 Writing unsigned/signed int data
dtrace_load8 1 Reading unsigned/signed char data
dtrace_store8 1 Writing unsigned/signed char data
Here we explain the usage of the primitive with the
example of Fig.1. The primitive dtrace_store64 is inserted
in Line 10, which is specifically used for the events of writing a 64-bit variable. It accepts the address of the
vari-ablerule→denyand the value of that variable as the two
parameters.
Emulating PTWRITE
PTWRITEhas not been supported by any Intel processor
release yet (Hunter2017; Beeman2017). The prototype
emulatesPTWRITE based on indirect jump instructions
and Intel PT’s control flow tracing. The primitives are implemented with the emulation. The decoder recon-structs the inserted data value according to a special packet flow pattern.
DTrace emulatesPTWRITEby orchestrating a serial of
indirect jump instructions in a particular order. To record
an N-bit valueval, the program executes an indirect jump
into a jump table with 2N entries at offsetval. Let the base
address of the jump table beBand each entry of the jump
table is in one byte. Intel PT generates a packet for such
indirect jump withB+valas its payload. The Trace
Ana-lyzer then extracts the payload, subtract Band gets the
recorded valueval.
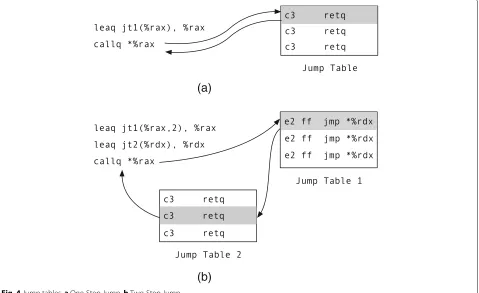
As Fig. 4a shows, each entry of the jump table
con-tains a retq instruction returning back to the
origi-nal site. A retq instruction takes 1 byte. To record a
48-bit pointer value, a table with 248 entries will require
a continuous virtual memory region of at least 248 bytes,
which exceeds the limit of the virtual memory space. To reduce the size of jump tables, DTrace breaks long data types into shorter pieces. For example, DTrace instru-ments the application to jump twice with indexes saved
in %rax and %rdx as illustrated in Fig. 4b. The Trace
Analyzer decodes the two consecutive indirect jump events and merges the payloads into a complete 48-bit value.
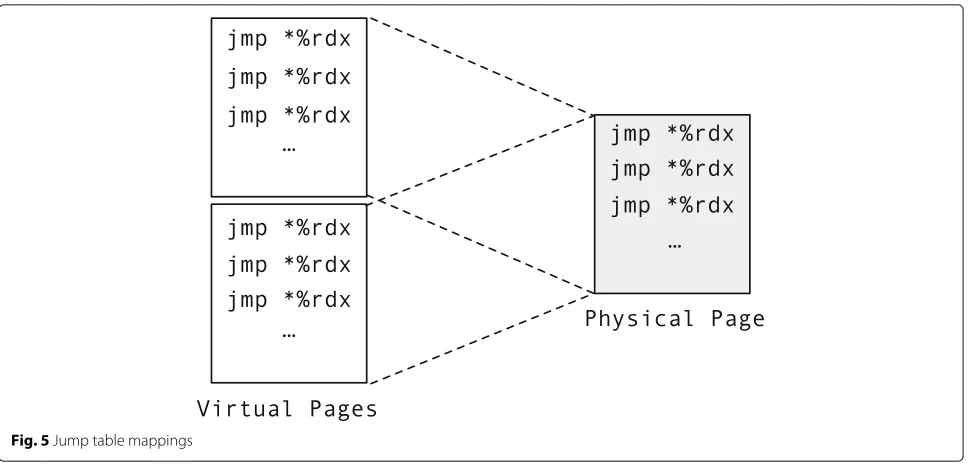
All pages for the same jump table have the same content as each entry in the jump table is the same instruction. To reduce physical memory usage, DTrace maps all virtual pages for the same jump table to a single physical page as
shown in Fig.5.
(a)
Fig. 5Jump table mappings
Implementation
We implement DTrace on Debian 9.1 with Linux Kernel 4.9, running on Intel Core i7-7700 with 16GB memory. We modify the Intel PT driver implemented by Linux perf subsystem, with customized ToPA setting and PMI handler. The modified PMI handler decodes packets in trace buffer and matches the load and store records. We replace some security sensitive system call handlers like read,write,execve,mmapandsetuid. The new system call handlers simply invoke the Trace Analyzer and turns to the original handler.
DTrace sets up all jump tables in user mode before the application starts execution. The application then sends the base addresses of the jump tables to the Trace Ana-lyzer. The user mode runtime talks with kernel to enable and stop Intel PT before and after application execution. These operations are implemented in constructor and
destructor, declared with GCCconstructoranddestructor
attributes and invoked automatically by C runtimes.
Jump table
In the runtime files, we declare three large arrays accord-ing to the sizes of the three jump tables. The arrays are not initialized so that they do not account for disk space in the linked binary file. During executing the application’s constructor, we unmap all virtual pages assigned for them and map the same physical page at each virtual page base address in the range.
Jumping indirectly and back has higher latency than an indirect function invocation and paired return, as the processor optimizes the return address prediction with an internal call stack while most other indirect
jumps fail in branch prediction. In dtrace_storeX and
dtrace_loadX, the last operation is jumping into a jump
table. We set the content of the last jump table withretq
instructions, which return directly back to the caller of dtrace_storeXanddtrace_loadX. At the same time, aretq is encoded in only one byte, which doubles the number of entries in a jump table without allocating more virtual pages.
Intel PT filter
Intel PT records all control flow transfer instructions by default, which fill the Trace Buffer with large quantities of uninteresting packets to DTrace like conditional branch taken-not-taken. The irrelevant packets increase the bur-den of packet decoding and the number of interrupts for the Trace Buffer filling events.
We leverage the instruction pointer filter (IP filter) mechanism provided by Intel PT to trace only the indirect jumps DTrace inserted in application. The i7-7700 plat-form supports two different IP filters. We set two ranges.
One for the primitive functions like dtrace_storeX and
dtrace_loadX. The other for the jump tables. All primitive
functions are assembled into.textsection closely together.
The first IP filter range is determined by the address of the first function and the address of the last instruction in the last function. The filter for jump tables is determined in a similar way. We compare all jump tables’ base addresses for the lowest one before setting the filter, as compilers provide no guarantee for the address order of different global data objects. Global variables may be allocated in a reversed order than what they are defined in the source program.
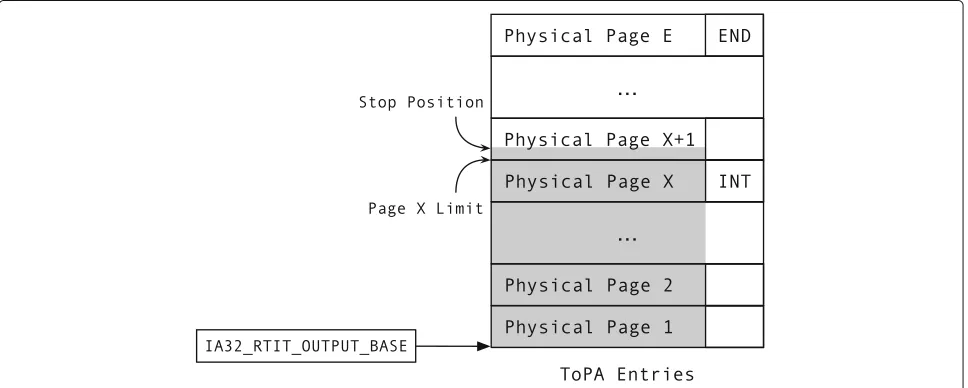
ToPA table setting
Intel PT locates the Trace Buffer with Table of Physical
points to a physical memory region with physically
con-tinuous pages. The last entry has a special bit namedEND
set, indicating that it points to the first ToPA table entry rather than a buffer page. When the last physical page in the Trace Buffer is filled, Intel PT moves forward to the first physical page pointed to by the first ToPA entry and overwrites the first few packets in the head of the Trace Buffer.
When a ToPA table entry has another bitINTset, Intel
PT triggers an interrupt on filling the corresponding phys-ical pages. The interrupt handler consumers the buffered packets and reenables tracing. However, the interrupt is not precise, and it is thus likely that writing to the next region occurs by the time the interrupt is taken (Intel 2018). As the shaded region in Fig.2 indicates, though
Intel PT is set to pause on filling physical pageX, the page
X+1has been written with hundreds of bytes when Intel
PT actually pauses.
To avoid any tracked corruption data access event
missed due to ring buffer overwrite, we set theINT bit a
few entries before the last entry in ToPA. The Trace Ana-lyzer scans the buffer up to the current Intel PT write position. After the trace analysis, the Driver resets the cur-rent write position to the beginning of the Trace Buffer
and Intel PT starts over. Figure 2 illustrates such
set-tings. INT bit is set on Physical Page X which makes
an interrupt is triggered when this page is fully filled. The Stop Position mark indicates the location that last packet resides when the processor jumps to the
inter-rupt handler. It is a few packets above Page X Limit
as the result of the interrupt event’s impreciseness. The
shaded area in Fig. 2 indicates all packets. The Trace
Analyzer will consume all packets within the shaded area without missing any packet generated after the interrupt.
In the implementation, we set the whole buffer as 32 pages and the INT bit at the 16th page, which leaves 16 pages after the INT bit to hold all packets generated after the interrupt is triggered. We find no record loss with this setting during evaluation.
Dual-buffers
DTrace sets up separate buffers for the application thread and the background worker to eliminate producer-consumer conflicts. The two buffers are pointed to by two different ToPA tables. Though the pages in one buffer may be discontinuous, DTrace remaps the pages to a continuous virtual address region to easy the decoding operations. Switching the buffers takes sim-ple operations of reconfiguring the Intel PT model spe-cific registers (MSRs). All of the processor-generated packets are guaranteed to be flushed into the buffer before switching by temporarily suspending Intel PT (Intel2018).
Kernel storage
The tracing results are analyzed into data value records and saved in kernel accessible memory. In order to reduce the memory footprint of the kernel, we allocate the
mem-ory usingmmapso that the allocated memory pages can
be automatically recycled when the process exits. We set the page permission of the allocated pages as user-inaccessible and remap the pages as kernel accessible.
In the prototype, we use a four-level radix tree to save all recorded memory values. The radix tree is indexed by the memory variable address, which is passed as a parame-ter in the DTrace primitive calls. We plan to leverage Intel
processor features like Intel MPX (Oleksenko et al.2017)
to speed up the radix tree search and update operations.
Evaluations
In this section, we first analyze how DTrace could be used in real-world applications to enhance security property. Besides the motivating example discussed in “Motivating example” section, we further provide three case studies from different applications. Then we analyze the security guarantee that DTrace provides by demon-strating how DTrace defeats memory corruptions. Finally, we evaluate the performance overhead that DTrace incurs with both micro-benchmarks and a real-world application.
Case study
In this subsection, we report our experience in which we apply the protection mechanism of DTrace on multiple real world applications, the Linux user authorization
util-itysudo, the FTP server applicationwu-ftpdand the web
serverNginx. The former two applications have reported
CVEs which are exploitable for arbitrary memory
corrup-tion as demonstrated by FlowStitch (Hu et al. 2015). In
these two cases, we analyze the program source and pick one security related case for each of them. Then we work as the application programmer to manually insert DTrace primitives and recompile the applications. For the last case study on Nginx, we apply static analysis on the source code to automatically identify the load and store operations that need to be instrumented. Overall, we find that DTrace is easy to be adopted in application development.
sudo.The Linux utilitysudo1.8.3 is vulnerable to
CVE-2012-0809 (CVE 2012). Normally, it displays the sudo
binary’s file name with vfprintf when running in debug
mode. If the filename is made up with malicious format
character like the infamous %n, the attacker is able to
write to any in-memory variable ofsudo. The exploit
cre-ates a soft link of sudo with malicious format character
as its file name. When the soft link is executed,vfprintf
corrupts a memory object specified by the attacker.
We pick theuidfield ofsudoas the security-critical
to execute a user-specifiedask passprogram. The code
snippet is presented in Listing2. The field is updated in
Line 8 and retrieved in Line 16. The retrieved value is used
as a parameter to the system callsetuid, which decides the
privileges of the current process. The attacker may wish to
overwrite this value to zero, making theask passprogram
work under root user while the only authenticated user is the unprivileged logged-in user.
1 struct user_details {
2 uid_t uid;
3 } *user_detail;
4
5 static char **
6 get_user_info (struct user_details *ud) {
7 ...
8 ud->uid = getuid();
9 dtrace_store32(&ud->uid, ud->uid);
10 ...
11 }
12
13 static char *
14 sudo_askpass(const char *askpass,
15 const char *prompt) {
16 uid_t uid = user_detail->uid;
17 dtrace_load32(&user_detail->uid,
18 user_detail->uid);
19 setuid(uid);
20 ...
21 }
Listing 2Defeating CVE-2012-0809 in sudo.
The fielduidis a 32-bit unsigned integer. We locate the
place where it gets updated in Line 9. This is the only place
thatuidcan be updated legally. We invokedtrace_store32
after the store operation, with the address of the fielduid
in a struct user_details and the correct value ofuid as parameters. We make the program log the access event in Line 17 with the value read from memory. The two events will be recorded into traces and verified when the
applica-tion invokessetuid. If thesudoprocess loads a corrupted
value in Line 16, DTrace will detect such a mismatch from
the trace and abort the subsequentsetuidsystem call. As
the result, the exploit of escalating the privilege through setuidwill fail.
wu-ftpd.The FTP serverwu-ftpdis vulnerable to
CVE-2000-0573 (CVE 2000) which escalates the privilege of
awu-ftpdserver daemon running in non-root into root user. The CVE introduces a format string error which empowers a remote attacker to corrupt arbitrary
mem-ory data in the address space. As Listing3indicates, the
wu-ftpdprocess saves the current non-root useruidin a
record namedpw→pw_uid. Then it acquires an escalated
privilege which is required bysetsockopt. Normally, when
it completes the privileged operations, the process will drop the privilege as indicated in Line 15, which restores
theuidsaved inpw→pw_uid.
1 struct passwd {
2 uid_t pw_uid;
3 } *pw; 4
5 struct passwd *sgetpwnam(char *name) {
6 pw->pw_uid = getuid();
7 dtrace_store32(&pw->pw_uid,pw->pw_uid);
8 ...
9 }
10
11 FILE *getdatasock(...){ 12 ...
13 seteuid(0);
14 setsockopt(...);
15 dtrace_load32(&pw->pw_uid,pw->pw_uid);
16 seteuid(pw->pw_uid);
17 ...
18 }
Listing 3Defeating CVE-2000-0573 in wu-ftpd.
However, with the help of CVE-2000-0573, it is highly
appealing that the attacker sets the value inpw→pw_uid
with zero, which indicates a root user and misleads the process to keep the escalated privilege. The attacker may further access security sensitive files through the root-user FTP daemon, which would have been blocked by file
permission checking. For example, she may replace
/etc/-passwd to set up a user account which can be used for remote login.
With the help of DTrace, we can enhance the
secu-rity property ofwu-ftpdby checking the data integrity of
pw→pw_uid. As Line 14 in Listing3 indicates, we can
add adtrace_load32operation before loading the
possi-bly corrupted value of pw→pw_uid, which records the
actual loaded value into the hardware instruction trace.
If the attacker corrupts the uid into any value different
thanpw→pw_uid should be, the Trace Analyzer would discover such a mismatch and abort the system call of seteuid. As a result,wu-ftpddaemon cannot be hijacked into a root-user process that is controlled by the remote attacker.
Nginx. The widely-deployed web server Nginx is vulnerable to multiple memory error bugs like
CVE-2013-2028 (CVE 2013) and CVE-2014-0133 (CVE
2014), which leave various kinds of security-sensitive data under the risk of being controlled by remote attacker. Besides the decision-making data discussed in “Motivating example” section, here we further try to apply DTrace’s protection mechanism to all function pointers, which will help to defeat control flow hijacking
attacks (Checkoway et al.2010). We have developed some
LLVM passes to statically analyze and instrument Nginx at the intermediate representation level.
We briefly describe our static analysis and
instrumnen-tation algorithm in Listing 4. The algorithm leverages
without any optimization, which leaves the type infor-mation from source intact. Then we apply the static analysis and instrumentation on the unoptimized IR. Finally we continue to compile the files with -O2 level optimizations.
1 def is_funcptr_ty(ty):
2 return is_pointer_ty(ty) and is_function_ty
3 (ty.get_pointer_element_ty())
4
5 # a module is an LLVM-IR file that corresponds to
6 # a compiled C source file
7 def analyze_and_instrument(module):
8 for i in module:
9 if is_load(i):
10 ty = i.get_loaded_data_type()
11 if is_funcptr_ty(ty):
12 prmt = get_primitive_for_size(ty)
13 calli = create_call(prmt,
14 i.get_loaded_ptr(), i)
15 calli.insert_after(i)
16 elif is_store(i):
17 ty = i.get_stored_data_type()
18 if is_funcptr_ty(ty):
19 prmt = get_primitive_for_size(ty)
20 calli = create_call(prmt,
21 i.get_stored_ptr(), i)
22 calli.insert_after(i)
Listing 4The static analysis and instrumentation algorithm that help to protect all function pointers in Nginx.
The instrumentation adds the primitives after each identified access to function pointers. As the instru-mented primitive after a store instruction records the stored function pointer value, once it gets corrupted, the primitive after the corresponding load instruction will record the corrupted loaded value. Finally, when DTrace performs the checks before a security-sensitive system call, the corrupted loaded value will be identified.
Security analysis
We analyze the data integrity security property that DTrace provides. DTrace’s goal is to reveal the data cor-ruptions over the specified security-sensitive data. Under the enhancement of DTrace, even though the attacker is assumed to have arbitrary memory write capability, any data corruption will be discovered and the related security sensitive operation will be rejected.
We hereby show that the attacker cannot bypass the data integrity checking that DTrace provides. First of all, DTrace injects data access recording operations right alongside each data access event by programmer annota-tion or program analysis. DTrace will not miss any data access operation as long as the recording coverage is complete.
Second, DTrace’s data recording operation is embedded in the program code which cannot be bypassed as long as the instrumented instructions are executed. We assume that control flow integrity techniques are deployed in the application to provide the assurance that the attacker cannot hijack the program execution. Furthermore, we
assume that the system will properly handle page per-mission settings that ensure instrumented instructions cannot be modified by the attacker. As the result, the embedded data tracing operations will loyally record down all the data access events.
Third, the data access tracing is implemented by Intel instruction tracing mechanism, which is controlled by some model specific registers (MSRs) and can only be manipulated in kernel mode. Even though the user-mode application is controlled by the attacker, she is not able to disable the Intel processor tracing mechanism by updating the MSRs. We also assume that the Intel PT management code is loaded and executed properly by the loading pro-cess of kernel, which ensures that the hardware tracing feature is enabled properly before the process execution.
We further show that the data integrity checking that DTrace provides can prevent the attacker from making security-sensitive operations. As we discussed earlier, any data corruption attack on specified security sensitive data can be revealed from the trace analysis. DTrace conducts such analysis before security-sensitive system calls. As the data corruption event can be discovered in the trace anal-ysis, the process will fail in the trace analysis part and cannot step into the system call handling. Even though the trace analysis may happen long after the data corruption event takes place, DTrace ensures the corruption can-not be finally exploited and affect any security-sensitive operations. For example, in the example of corrupting the
uid in thesudocase, even if the attacker is able to send
a crafted uid to trick the kernel, DTrace will abort any
security-sensitive system call as it discovers the corrup-tion event from the trace.
Performance analysis
The Intel PT driver and Trace Analyzer are implemented as a kernel module for Linux 4.9 without any kernel mod-ification. The kernel module registers a non-maskable interrupt handler to receive PMI when the Trace Buffer is full. The prototype is evaluated on a machine with Intel Core i7-7700 running at 3.6GHz and 16GB memory.
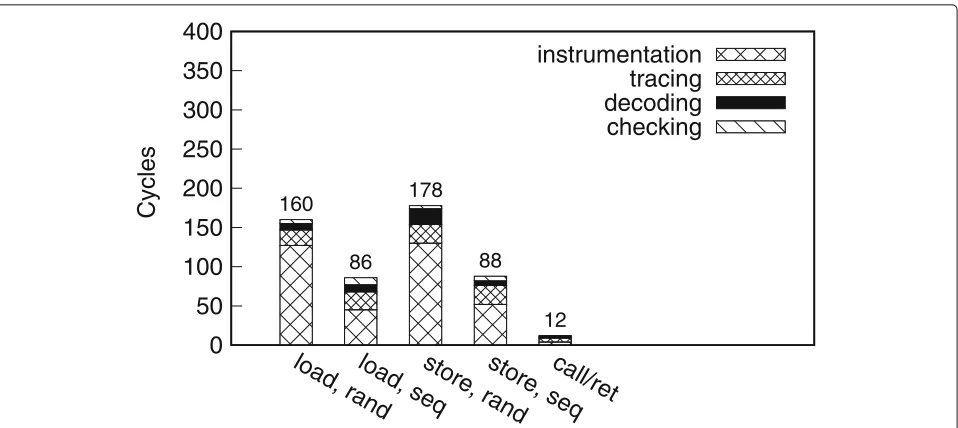
Microbenchmarks. We evaluate the primitives based on emulated PTWRITE for loading and storing a 48-bit value with a busy loop running 200,000 times. The
two bars ofload, randandstore, rand in Fig.6indicate
the number of CPU cycles required when the application records a random 48-bit value in each iteration. The other
two bars labeledload, seqandstore, seqindicate the
num-ber of cycles they take when the value to be recorded in each iteration increases in a constant step.
0
50
100
150
200
250
300
350
400
loa
d, ra
nd
loa
d, s
eq
store, ran
d
sto
re,
seq
call/re
t
Cycles
instrumentation
tracing
decoding
checking
160 86
178
88
12
Fig. 6Cycles of the primitives. Each bar is brokendown to show the cycles spent in each step.instrumentation: the cycles of executing the instructions of the primitives running in user-mode.tracing: the time that Intel PT writes packets to memory.decoding: the time for the Trace Analyzer to decode packets for the event.checking: the time cost of remembering a stored value or checking a loaded value
We further break down the overhead and report the
results in Fig. 6. We find that Intel PT packet decoding
time varies little among primitives and inputs. However, with stable input patterns, the primitives take much fewer cycles in indirect jumpings and value recording/checking in kernel mode. A sequential access pattern helps the pro-cessor predict indirect branch targets and reduces TLB miss rate.
We measure how much performance benefit DTrace can get from different optimizations that we use. We apply
different optimizations on the implementation of store,
randoperation, which shows the most significant latency
in Fig.6. We display the evaluation results in Table2. The
performance benefit from replacing indirectjmp
instruc-tions with rets can be shown by comparing the cycle
numbers between Row 2 and Row 3, which reduces about
70 cycles for eachstore, randoperation. The major
perfor-mance optimization is gained by parsing the packets with multiple worker threads as shown by the cycle difference
between Row 3 and Row 4 in Table2. We can see that the
number of cycles is further reduced with about 130 cycles. Row 4 is the final design of DTrace.
Table 2Rand-store operation’s latency changes in different designs
Design Cycles
jmp Instr. + Single Thread 375
ret Instr. + Single Thread 308
ret Instr. + Multiple Threads 178
PTWRITE latency model. We model the latency of PRWRITEby evaluating a pair ofcallqandretq instruc-tions as Intel PT will generate two packets in a total of 8
bytes for them, similar to the 9-byte packet forPTWRITE.
Though Intel expects the latency of a singlePTWRITEto
be about one cycle (Strong et al.2015), the total latency
will be a bit higher considering decoding and online checking. We find that the latency of a pair of call/ret is around 12 cycles when the instructions are traced and packets are decoded. Thus we model the latency of two PTWRITEs in the following Nginx evaluations to be as good as 12 and as bad as 36 cycles, which is between the
latency of a single pair ofcallq/retqand double pairs.
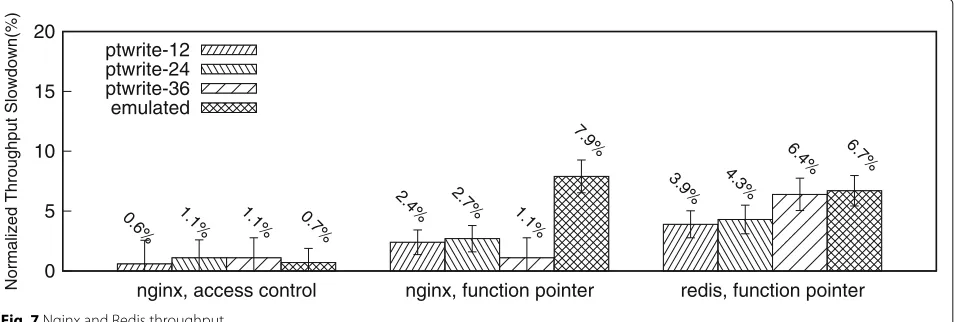
Nginx. We apply the data integrity checking in two different scenarios on Nginx 1.12.2 and evaluate Nginx’s throughput. In each scenario, we evaluate both
emu-latedPTWRITEand multiplePTWRITElatency models.
The results are displayed in Fig. 7. The result for two
PTWRITEs modeled with X cycles is indicated by the bar
labeled withptwrite-X. The baseline Nginx is compiled
without any modification. All of the optimization levels
are set to -O2, which is the level used when compiling
Debian’s Nginx package. We use the ApacheBench bench-marking tool in these evaluations. The tool sends 100000 requests to Nginx and fetches a 612-byte webpage.
In the first scenario, we protect Nginx to defeat the threat discussed in “Motivating example” section. We configure Nginx to deny all incoming requests. We man-ually insert the primitives in the source file to ensure
the integrity of those variables as shown in Listing 1.
0 5 10 15 20
nginx, access control nginx, function pointer redis, function pointer
Normalized Throughput Slowdown(%)
ptwrite-12 ptwrite-24 ptwrite-36 emulated
0.6%
2.4%
3.9%
1.1%
2.7%
4.3%
1.1% 1.1%
6.4%
0.7%
7.9%
6.7%
Fig. 7Nginx and Redis throughput
and emulated PTWRITE are displayed as the left-hand
side cluster in Fig. 7. As each of inserted primitive is
invoked once in responding to one HTTP request, both implementations incur inapparent overhead.
In the second scenario, we write an LLVM pass to automatically identify and instrument all function pointer accesses in Nginx. On serving each HTTP request, Nginx performs 104 function pointer read operations and 17 function pointer write operations on average. In the base-line, serving each request takes 31 microseconds on aver-age. The throughput drops 1.1 to 2.7% when a primitive’s latency varies from 12 to 36 cycles, and 7.9% for emulated PTWRITE.
Redis. We further apply the function pointer pro-tection mechanism to Redis, the in-memory key-value store. We use the static analysis algorithm described in
Listing4 to identify and instrument all function pointer
access events in Redis. We measure the throughput of Redis by sending INCR requests using the built-in bench-mark of Redis. The evaluation results are displayed in the
right-most cluster of Fig.7. The results show that the
func-tion pointer protecfunc-tion mechanism provided by DTrace incurs moderate overhead on Redis and the overhead
varies as the latencies ofPTWRITEdiffer. The overhead is
6.7% for emulatedPTWRITEand is expected to be as low
as 3.9% if the latency ofPTWRITEcan be reduced to 12
cycles.
Discussion
Instrumenting the application with new indirect jump operations does not increase the risk of being exploited by control data attacks like Jump Orient Programming (JOP)
(Checkoway et al.2010; Bletsch et al.2011). On one hand,
Jump tables are mapped with non-mutable page permis-sion to avoid corruption, which indicates the content of jump table is stable after initialization. Attackers can nei-ther alter the entries nor insert new entries into them. On the other hand, the index into the jump table is masked
with the size of the jump table. For example, for an
indi-rect jump into a table with 2Nentries, the index is masked
with 2N−1 before use. As the result, no index beyond the
upper bound exists.
In DTrace prototype, disabling Intel PT is implemented in statically linked destructors. The destructor is invoked
automatically after the program leaves main function.
However, the destructor still has a return operation back to C runtime provided by libc. DTrace focuses on data integrity enforcement. We assume a control flow integrity (CFI) enforcement is deployed. Under CFI assumption, the attacker cannot control the program exe-cution directly into the trap operation in the destructor into kernel to disable Intel PT, and jump back to continue program execution without instruction tracing. Further-more, DTrace works as an enhancement to CFI system as non-control data attacks are a great threat to security-critical applications.
DTrace’s data access trace generation interfaces require the programmer to mark the store and load operations. An alternative is to specify the security-critical data itself. However, tracing still works on data access oper-ations and marking the variables requires a fully auto-matic alias analysis on the protected variables. DTrace focuses on the data integrity enforcement rather than security-critical identification. In fact, DTrace is
orthog-onal to static alias analysis techniques (Wang et al.2017;
Kuznetsov et al.2014; Mashtizadeh et al.2015). The
analy-sis results specify a complete set of data access operations where DTrace’s interfaces suit well. Nevertheless, we dis-cuss the case of function pointer integrity enforcement in “Evaluations” section which relies on an automatic analy-sis to identify all function pointer access operations.
Otherwise DTrace will complain about a mismatch between recorded value and loaded value during trace analysis, or fail to find the recorded value at all. Further-more, the enforcement would be further strenthened if the whole data flow of security critical data is marked, including the in-memory pointers pointing to the security sensitive data.
Related work
Data isolation. Researchers have proposed numerous solutions to enforce the integrity of security-critical data. Data flow integrity can be achieved by restricting all memory write operations within their bounds so that no memory error exploit can be launched (Akritidis
et al. 2008; Castro et al. 2006; Oleksenko et al. 2017;
Erlingsson et al. 2006; Koning et al. 2017). The high
overhead of instrumenting all memory writes regard-less of the exploitability makes these solutions far from practical.
There are also explorations for techniques to set up secure memory regions for secure critical data. The secure region is isolated with hardware supports such as virtual
memory page permission (Song et al. 2016; Wang and
Jiang2010), Intel SGX (Hunt et al. 2016; Baumann et al.
2014; Kim et al. 2017), ARM memory domain (Chen
et al. 2016) and TrustZone (Azab et al.2014; Rubinov
et al. 2016). There are two challenges to isolate
mem-ory region with hardware support. The first one is the coarse-grained protection that hardware isolation mech-anisms support. Most of the memory in the same page will be wasted if the security-critical data only occupies
a few bytes, such asrule→deny in Listing1. The second
challenge is that accessing the isolated memory region requires time-consuming processor mode switching oper-ations, such as changing page permissions or entering the enclave. What is worse, when a whole data structure is placed in the secure region, accessing the non-secure-critical data in that data structure also requires a mode switching.
Researchers have also explored data integrity enforce-ment based on encryption. Tuck et al. proposed a new hardware to encrypted control data (Tuck et al. 2004). CCFI utilizes the AES-NI instructions on x86 processors to protect control data in C/C++
appli-cations (Mashtizadeh et al. 2015). Encryption-based
techniques require private storage to hold the encryp-tion keys. Addiencryp-tionally, the encrypt data in memory suffers from replay attacks, where the attacker can replace one piece of encrypt data with another piece to change the decrypted value without knowing the encryption keys.
In comparison, hardware traced data does not risk any memory corruption or information leak in user mode. It needs no switching between processor mode when
it generates trace data. DTrace can also protect word-size data even if security-sensitive data collocates with non-sensitive data.
Hardware tracing.Flowguard (Liu et al. 2017),
Grif-fin2017 and Pittypat (Ding et al.2017) enforces control
flow integrity with Intel Processor Trace by recording the analyzed application’s control flow and checking the traces. Pittypat enforces a stricter policy than the other two as it incorporates online point-to analysis. How-ever, Pittypat cannot distinguish different array elements if the path-sensitive analysis fails. DTrace reuses Intel PT for data access event tracing. Furthermore, DTrace’s design is compatible with these systems of CFI enforce-ment and can be adopted to improve the preciseness of these systems. For example, it can help Pittypat to distinguish different array elements that the applica-tion has accessed by recording an integer value of the array index.
Paupore et al. (2015) proposes hardware assisted taint tracking on mobile devices. One of the feasible tracing hardware is Embedded Trace Macrocell (ETM) shipped with recent ARM chips. DTrace is implemented on x86 architecture with Intel Processor Trace. DTrace tracks only the security-critical data without the burden of a full data flow tracing. ETM has a feature of data tracing (ARM2016) which records memory data access events in packets. However, ETM can only be configured to watch a range of memory rather than word-sized values scat-tered in stack and heap, which would significantly include redundant tracing results.
Snorlax (Kasikci et al. 2017) leverages Intel Processor
Trace to record multi-threaded application’s execution and help diagnosing data race bugs. It relies on point-to analysis to determine pointer variable values. We believe diagnosing tools like Snorlax would benefit from DTrace as the accurate pointer values can be recorded in Intel PT traces without the dependence on static analysis.
Conclusion
We have explored a novel application of hardware instruc-tion tracing to check data integrity. The prototype imple-mentation, named DTrace, is based on Intel PT and
emulatesPTWRITEinstructions to make it ready to use.
It incorporates software instrumentation and hardware tracing to enforce fine-grained data integrity without fre-quently switching the processor mode. DTrace is easy to be applied in applications and incurs moderate perfor-mance overhead.
Acknowledgements
We are grateful to the support from National Key Research and Development Program of China (2016YFB1000104) and the research grant from Huawei Technologies, Inc.
Funding
Availability of data and materials
The manuscript is original work of all authors. We confirm that this manuscript has not been published elsewhere and is not under consideration by another journal.
Authors’ contributions
All authors have contributed to this manuscript and approved of this submission. Prof. Haibo Chen made a decisive contribution to the content of research and revised the article critically. Xiayang Wang participated in all the work and drafted the article. Fuqian Huang has made many contributions to fix the technical issues, survey on supporting materials and revise the article. All authors read and approved the final manuscript.
Competing interests
No conflict of interest exists in the submission of this manuscript. The manuscript is approved by all authors for publication.
Publisher’s Note
Springer Nature remains neutral with regard to jurisdictional claims in published maps and institutional affiliations.
Received: 1 November 2018 Accepted: 14 December 2018
References
Abadi M, Budiu M, Erlingsson U, Ligatti J (2005) Control-flow integrity. In: Proceedings of the 12th ACM Conference on Computer and
Communications Security, CCS ’05. pp 340–353.https://doi.org/10.1145/ 1102120.1102165
Akritidis P, Cadar C, Raiciu C, Costa M, Castro M (2008) Preventing memory error exploits with wit. In: 2008 IEEE Symposium on Security and Privacy, S&P’08. pp 263–277.https://doi.org/10.1109/SP.2008.30
Amazon (2018) Amazon elastic compute cloud.http://aws.amazon.com/ec2/ ARM (2016) ARM Embedded Trace Macrocell Architecture Specification
ETMv4.0 to ETMv4.2. ARM Limited.https://static.docs.arm.com/ihi0064/d/ \IHI0064D_etm_v4_ar%chitecture_spec.pdf. Accessed 23 Sep 2018 Azab AM, Ning P, Shah J, Chen Q, Bhutkar R, Ganesh G, Ma J, Shen W (2014)
Hypervision across worlds: Real-time kernel protection from the arm trustzone secure world. In: Proceedings of the 2014 ACM SIGSAC Conference on Computer and Communications Security, CCS ’14. ACM, New York, NY, USA. pp 90–102.https://doi.org/10.1145/2660267/2660350 Baumann A, Peinado M, Hunt G (2014) Shielding applications from an
untrusted cloud with haven. In: 11th USENIX Symposium on Operating Systems Design and Implementation, OSDI’14. USENIX Association, Broomfield, CO. pp 267–283
Beeman S (2017) Supported processors for ptwrite instruction?.https:// software.intel.com/en-us/forums/intel-isa-extensions/%topic/704356. Accessed 23 Sep 2018
Bletsch T, Jiang X, Freeh VW, Liang Z (2011) Jump-oriented programming: a new class of code-reuse attack. In: Proceedings of the 6th ACM Symposium on Information, Computer and Communications Security. ACM, New York. pp 30–40.http://doi.acm.org/10.1145/1966913.1966919 Castro M, Costa M, Harris T (2006) Securing software by enforcing data-flow
integrity. In: Proceedings of the 7th Symposium on Operating Systems Design and Implementation, OSDI ’06. USENIX Association, Berkeley, CA, USA. pp 147–160
Checkoway S, Davi L, Dmitrienko A, Sadeghi AR, Shacham H, Winandy M (2010) Return-oriented programming without returns. In: Proceedings of the 17th ACM Conference on Computer and Communications Security, CCS ’10. ACM, New York, NY, USA. pp 559–572.https://doi.org/10.1145/ 1866307.1866370.http://doi.acm.org/10.1145/1866307.1866370 Chen S, Xu J, Sezer EC, Gauriar P, Iyer RK (2005) Non-control-data attacks are
realistic threats. In: Proceedings of the 14th Conference on USENIX Security Symposium - Volume 14, SSYM’05. USENIX Association, Berkeley, CA, USA. pp 12–12
Chen Y, Reymondjohnson S, Sun Z, Lu L (2016) Shreds: Fine-grained execution units with private memory. In: 2016 IEEE Symposium on Security and Privacy, S&P’16. pp 56–71.https://doi.org/10.1109/SP.2016.12 Cui W, Ge X, Kasikci B, Niu B, Sharma U, Wang R, Yun I (2018) REPT: Reverse
debugging of failures in deployed software. In: 13th USENIX Symposium
on Operating Systems Design and Implementation (OSDI 18). USENIX Association, Carlsbad, CA. pp 17–32.https://www.usenix.org/conference/ osdi18/presentation/weidong
CVE (2000) Cve-2000-0573 details. http://www.cvedetails.com/cve/cve-2000-0573. Accessed 23 Sep 2018
CVE (2012) Cve-2012-0809.https://cve.mitre.org/cgi-bin/cvename.cgi?name= CVE-2012-0809
CVE (2013) Cve-2013-2028.https://cve.mitre.org/cgi-bin/cvename.cgi?name= cve-2013-2028. Accessed 2 Dec 2018
CVE (2014) Cve-2014-0133.https://www.cvedetails.com/cve/cve-2014-0133. Accessed 2 Dec 2018
Ding R, Qian C, Song C, Harris B, Kim T, Lee W (2017) Efficient protection of path-sensitive control security. In: 26th USENIX Security Symposium, Security’17. USENIX Association, Vancouver, BC. pp 131–148 Erlingsson U, Abadi M, Vrable M, Budiu M, Necula GC (2006) Xfi: Software
guards for system address spaces. In: Proceedings of the 7th Symposium on Operating Systems Design and Implementation, OSDI ’06. USENIX Association, Berkeley, CA, USA. pp 75–88
Ge X, Cui W, Jaeger T (2017) Griffin: Guarding control flows using intel processor trace. SIGARCH Comput Archit News 45(1):585–598.https://doi. org/10.1145/3093337.3037716
Hu H, Chua ZL, Adrian S, Saxena P, Liang Z (2015) Automatic generation of data-oriented exploits. In: 24th USENIX Security Symposium, Security’15. USENIX Association, Washington, D.C. pp 177–192
Hu H, Shinde S, Adrian S, Chua ZL, Saxena P, Liang Z (2016) Data-oriented programming: On the expressiveness of non-control data attacks. In: 2016 IEEE Symposium on Security and Privacy, S&P’16. pp 969–986.https://doi. org/10.1109/SP.2016.62
Hunt T, Zhu Z, Xu Y, Peter S, Witchel E (2016) Ryoan: A distributed sandbox for untrusted computation on secret data. In: 12th USENIX Symposium on Operating Systems Design and Implementation, OSDI’16. USENIX Association, Savannah, GA. pp 533–549
Hunter A (2017) Lkml: Adrian hunter: [patch 00/37] perf intel-pt: Power events and ptwrite.https://lkml.org/lkml/2017/5/19/230. Accessed 23 Sep 2018 Intel (2018) Intel 64 and ia-32 architectures software developer’s manual.
https://software.intel.com/en-us/articles/intel-sdm Kasikci B, Cui W, Ge X, Niu B (2017) Lazy diagnosis of in-production
concurrency bugs. In: Proceedings of the 26th Symposium on Operating Systems Principles, SOSP ’17. ACM, New York, NY, USA. pp 582–598. https://doi.org/10.1145/3132747.3132767
Kim S, Han J, Ha J, Kim T, Han D (2017) Enhancing security and privacy of tor’s ecosystem by using trusted execution environments. In: Proceedings of the 14th USENIX Conference on Networked Systems Design and Implementation, NSDI’17. USENIX Association, Berkeley, CA, USA. pp 145–161
Koning K, Chen X, Bos H, Giuffrida C, Athanasopoulos E (2017) No need to hide: Protecting safe regions on commodity hardware. In: Proceedings of the Twelfth European Conference on Computer Systems, EuroSys ’17. ACM, New York, NY, USA. pp 437–452.https://doi.org/10.1145/3064176.3064217 Kuznetsov V, Szekeres L, Payer M, Candea G, Sekar R, Song D (2014)
Code-pointer integrity. In: 11th USENIX Symposium on Operating Systems Design and Implementation (OSDI 14). USENIX Association, Broomfield, CO. pp 147–163. https://www.usenix.org/conference/osdi14/technical-sessions/presentation/kuznetsov
Liu Y, Shi P, Wang X, Chen H, Zang B, Guan H (2017) Transparent and efficient cfi enforcement with intel processor trace. In: 2017 IEEE International Symposium on High Performance Computer Architecture (HPCA). pp 529–540.https://doi.org/10.1109/HPCA.2017.18
Mashtizadeh AJ, Bittau A, Boneh D, Mazières D (2015) CCFI: Cryptographically enforced control flow integrity. In: Proceedings of the 22nd ACM SIGSAC Conference on Computer and Communications Security, CCS ’15. ACM, New York, NY, USA. pp 941–951.https://doi.org/10.1145/2810103.2813676 Microsoft (2018) A detailed description of the data execution prevention (DEP)
feature. https://support.microsoft.com/en-us/help/875352/a-detailed-description-of-the-data-execution-prevention-dep-feature-in. Accessed 23 Sep 2018
Paupore J, Fernandes E, Prakash A, Roy S, Ou X (2015) Practical always-on taint tracking on mobile devices. In: 15th Workshop on Hot Topics in Operating Systems. USENIX Association, Kartause Ittingen, Switzerland. HotOS XV Reinders J (2013) Processor tracing.https://software.intel.com/en-us/blogs/
2013/09/18/processor-tracing. Accessed 23 Sep 2018 Rubinov K, Rosculete L, Mitra T, Roychoudhury A (2016) Automated
partitioning of android applications for trusted execution environments. In: Proceedings of the 38th International Conference on Software Engineering, ICSE ’16. ACM, New York, NY, USA. pp 923–934.https://doi. org/10.1145/2884781.2884817
Song C, Lee B, Lu K, Harris W, Kim T, Lee W (2016) Enforcing kernel security invariants with data flow integrity. In: 22th Annual Network and Distributed System Security Symposium, NDSS’18
Strong BC, Brandt JW, Lachner P, Kleen A, Crossland JB, Opferman T (2015) Software-initiated trace integrated with hardware trace. US Patent 20160378636A1. 26 June 2015
Tuck N, Calder B, Varghese G (2004) Hardware and binary modification support for code pointer protection from buffer overflow. In: Microarchitecture, 2004. MICRO-37 2004. 37th International Symposium on. pp 209–220. https://doi.org/10.1109/MICRO.2004.20
Wang H, Shi P, Zhang Y (2017) Jointcloud: A cross-cloud cooperation architecture for integrated internet service customization. In: Proceedings of The 37th IEEE International Conference on Distributed Computing Systems (ICDCS 2017), ICDCS’17
Wang K, Hussain A, Zuo Z, Xu G, Amiri Sani A (2017) Graspan: A single-machine disk-based graph system for interprocedural static analyses of large-scale systems code. SIGOPS Oper Syst Rev 51(2):389–404.https://doi.org/10. 1145/3093315.3037744.http://doi.acm.org/10.1145/3093315.3037744 Wang Z, Jiang X (2010) Hypersafe: A lightweight approach to provide lifetime
hypervisor control-flow integrity. In: 2010 IEEE Symposium on Security and Privacy. pp 380–395.https://doi.org/10.1109/SP.2010.30