M E T H O D O L O G Y
Open Access
An efficient procedure for protein extraction from
formalin-fixed, paraffin-embedded tissues for
reverse phase protein arrays
Huifang Guo
1, Wenbin Liu
2, Zhenlin Ju
2, Pheroze Tamboli
3, Eric Jonasch
4, Gordon B Mills
1, Yiling Lu
1†,
Bryan T Hennessy
5†and Dimitra Tsavachidou
4*†Abstract
Introduction:Protein extraction from formalin-fixed paraffin-embedded (FFPE) tissues is challenging due to extensive molecular crosslinking that occurs upon formalin fixation. Reverse-phase protein array (RPPA) is a high-throughput technology, which can detect changes in protein levels and protein functionality in numerous tissue and cell sources. It has been used to evaluate protein expression mainly in frozen preparations or FFPE-based studies of limited scope. Reproducibility and reliability of the technique in FFPE samples has not yet been
demonstrated extensively. We developed and optimized an efficient and reproducible procedure for extraction of proteins from FFPE cells and xenografts, and then applied the method to FFPE patient tissues and evaluated its performance on RPPA.
Results:Fresh frozen and FFPE preparations from cell lines, xenografts and breast cancer and renal tissues were included in the study. Serial FFPE cell or xenograft sections were deparaffinized and extracted by six different protein extraction protocols. The yield and level of protein degradation were evaluated by SDS-PAGE and Western Blots. The most efficient protocol was used to prepare protein lysates from breast cancer and renal tissues, which were subsequently subjected to RPPA. Reproducibility was evaluated and Spearman correlation was calculated between matching fresh frozen and FFPE samples.
The most effective approach from six protein extraction protocols tested enabled efficient extraction of
immunoreactive protein from cell line, breast cancer and renal tissue sample sets. 85% of the total of 169 markers tested on RPPA demonstrated significant correlation between FFPE and frozen preparations (p < 0.05) in at least one cell or tissue type, with only 23 markers common in all three sample sets. In addition, FFPE preparations yielded biologically meaningful observations related to pathway signaling status in cell lines, and classification of renal tissues.
Conclusions:With optimized protein extraction methods, FFPE tissues can be a valuable source in generating reproducible and biologically relevant proteomic profiles using RPPA, with specific marker performance varying according to tissue type.
Keywords:Formalin-fixed, Paraffin-embedded tissue, Protein extraction, Reverse phase protein array, Breast cancer, Renal cancer
* Correspondence:dtsavach@mdanderson.org †Equal contributors
4
Department of Genitourinary Medical Oncology, University of Texas MD Anderson Cancer Center, Houston, TX, USA
Full list of author information is available at the end of the article
Background
Formalin fixation coupled with paraffin embedding (FFPE) is the standard tissue fixation and storage method adopted by most health institutions. FFPE tissues are highly stable, and can be stored at room temperature. Proteins are stabilized through cross-linking and cell or tissue structure is mainly preserved. Multiple reports show that proteins and protein modifications such as phosphorylation are maintained and can be determined years later by immunohistochemistry [1].
However, releasing proteins from FFPE tissues for proteomic analysis has proven to be a daunting task. The extensive molecular crosslinking that occurs upon formalin fixation reduces protein extraction efficiency and may interfere with immunoreactivity [2], warrant-ing the development of more efficient extraction methods [3]. Several proteomic studies using archival FFPE tissues have been reported in recent years. The majority of these studies employ protein extraction methods that are derived from heat-induced antigen retrieval techniques originally developed for immuno-histochemistry [4-8].
In the era of personalized medicine, new therapeutic and diagnostic options are rapidly becoming available to cancer patients, based on novel high-throughput tech-nologies. Reverse-phase protein array (RPPA) can effi-ciently quantify changes in protein levels and protein functionality in numerous tissue and cell sources [9-12]. This methodology provides a suitable approach in gener-ating high-throughput protein profiles in a robust quan-titative manner, providing an advantage over traditional methods such as immunohistochemistry [13,14]. RPPA has been used to evaluate protein expression mainly in frozen preparations. Reproducibility and reliability of the technique in FFPE samples have not been previously assessed extensively.
In this study, we developed and optimized an efficient and reproducible procedure for extraction of proteins from FFPE tissues. We demonstrate that this approach produces reliable results and biologically meaningful proteomic profiles generated by RPPA.
Results
Optimization of the protein extraction method from paraffin-embedded samples
Paraffin-embedded specimens comprise a wide variety of tissues, which may include samples of very limited amount, such as core biopsies. Protein material extracted from paraffin-embedded specimens may be of lower quality compared to frozen equivalents, because of deg-radation or dephosphorylation of proteins due to the for-malin fixation and embedding process or differences in time taken for preparation. It is therefore important to evaluate protein extraction methods for optimal per-formance, both in terms of quantity as well as quality.
FFPE blocks generated from breast cancer cell lines and xenografts were used for preliminary studies due to ready availability and the ability to control condi-tions of preparation and handling. We applied differ-ent protein extraction protocols to cell lines and xenografts embedded in paraffin, in order to evaluate yield and protein quality. The protocols used in this study were versions of previously described RPPA pro-tocols [9,15], modified to include deparaffinization steps. Additional modifications were adopted based on an extensive literature review [16-18]. A commercially available protocol (Qproteome FFPE Tissue Kit from Qiagen, Germany) was also assessed. In particular, method 1 was a modification of the RPPA extraction protocol [9,15] to include deparaffinization steps. Methods 2 and 3 are versions of method 1 based on literature [16]. Methods 4–6 are based on method 2 with buffers of varying pH (described in Table 1).
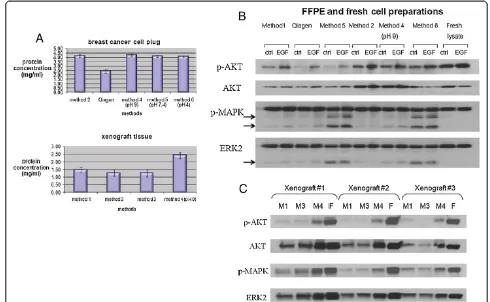
We first tested the protein concentration of the extracts recovered in standard volume, using the various methods, for both cell and xenograft preparations. Method 4 (the modification of method 2, with pH = 9) showed the highest yield (protein concentration of 4.25 mg/ml in breast cancer cell FFPE preparations, and 2.43 mg/ml in xenograft FFPE preparations) compared to the other methods (Figure 1A). We then evaluated the de-gree of degradation of the extracted protein. Specifically, we ran extracts from paraffin-embedded cell lines and
Table 1 Protein extraction methods
Method 1 Method 2 Method 3 Method 4 Method 5 Method 6 Qiagen RPPA buffer ✓ ✓ ✓
Qproteome buffer ✓
20mM Tris–HCl, pH=9 ✓
20mM Tris–HCl, pH=7.4 ✓
20mM Tris–HCl, pH=4 ✓
sonication ✓ ✓
incubation at 80oC ✓ ✓ ✓ ✓ ✓
xenograft tissues on SDS-PAGE gels, in parallel with extracted protein material from frozen preparations, stained the gels with Coomassie blue, and assessed pro-tein degradation as evidenced by the presence of low molecular weight bands or loss of signal. Coomassie blue staining demonstrated that the extracts from paraffin-embedded specimens (cell plugs and xenograft tissues) showed some prominent lower weight products (Additional file 6: Figure S2A, B), but with recoverable protein at high molecular weights as well. In addition to degradation, differences in lysis buffers may contribute to the variability in the observed banding patterns. Western blot analysis for select signaling molecules con-firmed that there was some protein degradation in the FFPE samples, which was reflected by lower molecular weight bands, but the bands of the correct molecular weight were strong, as in the case of frozen samples (Figure 1B, C). Importantly, the phosphorylation status of the proteins tested was conserved, as evidenced by phospho-AKT and phospho-ERK levels comparable between FFPE and frozen preparations.
RPPA on paraffin-embedded specimens
After establishing that method 4 exhibited the highest pro-tein yields and showed only partial propro-tein degradation on Coomassie staining and western blots, we proceeded with RPPA, in order to evaluate protein expression in extracts processed with method 4. In particular, extracts derived from paraffin-embedded cell line samples and their matched fresh frozen preparations were spotted on arrays and stained for 169 protein markers. Each fresh frozen (FF) and FFPE sample was represented by two replicate prepara-tions on the array. Each replicate preparation was serially diluted and spotted as described in Methods and Additional file 5: Figure S1. The resulting data were normalized using GSMN (see Methods). A breast and ovarian cancer cell line panel of six lines grown under different cell culture condi-tions (serum-starved media, addition of growth factors (EGF or IGF) or pharmacological inhibitors such as PI3K inhibitor LY294002 and MAPK inhibitor PD98059) pro-vided a dynamic range for phosphorylation events.
controlled and predictable experimental setting. We first addressed reproducibility of the technique by estimating the Spearman correlation coefficient between replicate preparations across the protein markers tested. Both for-malin fixed paraffin-embedded (FFPE) and frozen repli-cates performed reproducibly. Specifically, 91.42% of markers showed reproducibility between frozen sample replicates with spearman coefficient equal or greater than 0.7 (p < 3.5*10-7). For the FFPE sample replicates, 70.41% of markers showed reproducible results (spear-man coefficient > =0.7, p < 1.48*10-6) (Figure 2).
In addition to technical reproducibility, we assessed how similar the FFPE preparations performed compared to matched fresh frozen specimens. After estimating the Spearman coefficient between FFPE and matched FF samples across all protein markers in the RPPA experi-ment, we observed that there was statistically significant correlation (cutoff p <0.05, spearman coefficient > 0.36) for 45% of the markers tested (77 markers) (Table 2). For the markers that did not demonstrate significant
correlation between FFPE and their matched frozen pre-parations, we sought to investigate potential reasons for the apparent lack of correlation. First, we considered the case of overall low signal. Indeed, 17% of the protein mar-kers exhibited low intensities (log2 intensities of <−2), for all the samples tested. We then evaluated whether large intensity differences between the FFPE and FF sample sets may account for the observed low correlation. 32% of all the protein markers had significantly different signal in-tensities (> 2-fold, p < 5*10-6) between the FFPE and FF sets and low correlation between FFPE and FF intensities (Table 2). In fact, there was a significant enrichment of markers with different signal intensities between FFPE and FF in the low correlation group (59% of markers with low correlation between FFPE and FF exhibited high in-tensity differences between the two preparations, whereas only 23% of markers with good correlation between FFPE and FF had high intensity differences). There was no ap-parent bias towards a specific preparation type, with overall low or overall high intensities being equally dis-tributed between the FFPE and FF sets.
The remaining 6% of markers (Table 2) with poor cor-relation between FFPE and FF were found to have poor reproducibility between replicates for either FFPE or FF preparations, due to yet undetermined reasons.
To test whether results derived from FFPE specimens could be used to identify biologically relevant changes in signaling events, we focused on phospho protein mar-kers, where levels were altered by changing culture con-ditions and applying pharmacological interventions. In particular, we expected phospho-AKT (pAKTser473) and its downstream effector phospho-S6 (pS6ser235) to be induced by growth factor addition in the culture media, and inhibited by PI3K inhibitor (LY294002). On the other hand, these markers should not be affected directly by a MAPK inhibitor (PD98059). Indeed, we observed that both phospho-AKT and phospho-S6 exhibited the antici-pated changes in terms of rank order in matched FFPE and frozen samples (Figure 3). Specifically, the average normalized log2 signal intensities of both pAKTser473 and pS6ser235 increased by 3-fold and 1.76-fold respect-ively in the epidermal growth factor (EGF)-induced cul-tures in frozen preparations. pS6ser235 was increased by 2.05-fold in EGF-treated FFPE preparation, similar to that in the EGF-treated frozen preparation, indicating that the pS6ser235 site was robust to handling. In con-trast, EGF-induced elevation in pAKTser473 was not detected in the FFPE preparation, suggesting that pAKT was dephosphorylated during handling. Compared to EGF-treated cultures, pAKTser473 and pS6ser235 levels were markedly reduced in the LY294002-treated cultures, as anticipated (pAKTser473; 2.3-fold reduction in frozen and 5.2-fold reduction in FFPE preparations, pS6ser235; >10-fold reduction in frozen and 4.66-fold reduction in Figure 2RPPA reproducibility between replicate preparations.
FFPE). PD98059 treatment did not substantially alter the effects of EGF on pAKTser473 and pS6ser235 in either FFPE or frozen preparations (Figure 3).
The experiment on cell lines provided evidence sup-portive of applicability of high-throughput protein ex-pression detection from FFPE specimens. We then sought to analyze RRPA-based protein expression pat-terns for a set of FFPE breast cancer tissues from human patients. In particular, we screened 49 breast cancer samples along with an equal number of replicate preparations and matched frozen samples for expres-sion of 169 protein markers. The replicates from the
same specimen performed similarly for both FFPE and frozen preparations (Figure 2). Specifically, 92.3% of markers showed reproducibility between frozen sample replicates with spearman coefficient equal or greater than 0.7 (p < 5*10-10). For the FFPE sample replicates, 96.4% of markers showed reproducible results (spear-man coefficient > =0.7, p < 6.35*10-10). When the FFPE data were compared to their frozen counterparts, 32% demonstrated similar expression patterns (cutoff p <0.05, spearman coefficient > 0.28) between FFPE and matched frozen samples (Table 2). Importantly, 48% of the mar-kers exhibited statistically significant intensity differences (> 2-fold, p < 5*10-6) between frozen and FFPE prepara-tions, implying that a number of processes affecting pro-tein integrity such as handling, formalin fixation, propro-tein extraction buffers and conditions, as well as tissue het-erogeneity may contribute to differences between FFPE and matched frozen samples. Nevertheless for those pro-teins demonstrating correlations, FFPE may provide a usable source of material.
We also assessed two additional tissue types, renal cancer and normal renal cortex. These specimens were paraffin-embedded following a method similar to the one employed in the cell line experiment. We processed 15 renal cancer samples and 16 normal renal cortex samples from human patients. Each sample was repre-sented by two replicate frozen and two replicate FFPE preparations. Similarly to our previous experiments, we established technical reproducibility. Specifically, 89.94% of markers showed reproducibility between frozen sam-ple replicates with spearman coefficient equal or greater than 0.7 (p < 2.5*10-7). For the FFPE sample replicates, 90.53% of markers showed reproducible results (spear-man coefficient > =0.7, p < 3.66*10-7) (Figure 2). Cor-relation between FFPE and frozen preparations was improved compared to the cell line and breast cancer experiments, with 64% of the markers exhibiting p < 0.05 (spearman coefficient > 0.35)(Table 2). Importantly, the RPPA-based global protein expression profile of the FFPE preparations was able to distinguish between normal renal and tumor samples, as evidenced by means of principal component analysis (Figure 4).
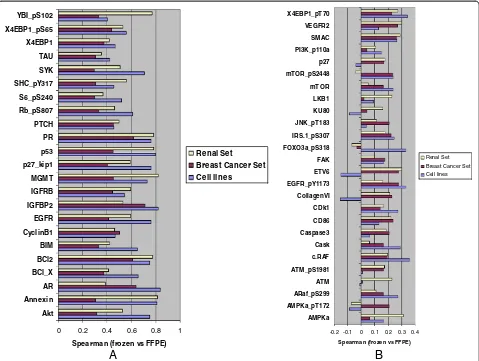
Comparing marker performance across all three experiments, the majority of protein markers (85%)
Table 2 Distribution of RPPA-detected protein markers depending on their performance between frozen and FFPE preparations
Markers with p < 0.05 between FFPE and FF
Markers with large intensity difference between FFPE and FF
Markers with low intensity in both FFPE and FF
Markers with low replicate reproducibility (R < 0.7) Cell lines 77 (45%) 54 (32%) 28 (17%) 10 (6%)
Breast cancer set 54 (32%) 81 (48%) 25 (15%) 9 (5%)
Renal cancer set 107 (64%) 31 (18%) 7 (4%) 24 (14%) Markers with high correlation (p < 0.05) between frozen and FFPE preparations, large intensity differences, low signal or low reproducibility for cell lines, breast cancer set and renal set are shown.
demonstrated significant correlation between FFPE and frozen preparations (p < 0.05) in at least one experiment (cell lines, breast cancer set or renal set), with 23 mar-kers exhibiting significant correlation in all three data sets (Figure 5A). There was variability between breast, renal and cell line data for each antigen suggesting that tissue specific characteristics likely contribute to total or phospho protein stability or recovery. The 26 markers with poor performance as evidenced by low frozen vs. FFPE correlations are shown in Figure 5B.
In order to demonstrate the applicability of RPPA from FFPE materials in a clinical laboratory setting, we sought to validate our results by comparing them to available immunohistochemistry-generated data of clinically sig-nificant markers. In particular, we compared our breast cancer RPPA data for one of our best performing markers (Figure 5A), PR (progesterone receptor), with correspond-ing immunohistochemical measurements. As shown in Figure 6, the breast cancer samples characterized as PR-positive using immunohistochemistry showed significantly higher PR protein expression levels in RPPA, compared to the PR-negative tumors. This was the case for both FFPE (PR-negative median normalized logarithmic intensity = −1.19; PR-positive median normalized logarithmic inten-sity = 0.38; p < 0.0008) and frozen samples (PR-negative median normalized logarithmic intensity = −1.19; PR-positive median normalized logarithmic intensity =−0.06; p < 2.5*10-5).
Discussion
In this study, we have shown that FFPE tissues can be a valuable source in generating reproducible and biologic-ally relevant proteomic profiles using reverse-phase pro-tein arrays (RPPA).
We first evaluated a broad range of extraction condi-tions from FFPE tissues, including deparaffinization, re-hydration, buffer components, pH conditions and temperatures. In the past, antigen retrieval techniques were used that mainly focused on applying high tempera-tures in appropriate buffers, facilitating the hydrolysis of formalin-induced crosslinks [19]. Subsequent studies hypothesized that the pH range may affect antigen re-trieval and quality of immunostaining. In particular, the Tris–HCl buffer tended to produce better results at higher pH (pH = 8–9) [20]. Other authors have suggested that low pH around 4.0 can produce peptides resulting from acid-catalyzed aspartic acid cleavage, therefore low-ering protein yield [21]. Addition of a reducing agent did not alter protein recovery significantly compared to pH [16]. Consistent with these studies, we observed that the highest protein yields were achieved using Tris–HCl con-taining 2% sodium dodecyl sulfate and 0.2 M glycine at pH 9.0 when heated at 100°C for 20 min, followed by in-cubation at 80°C for 2 h.
With respect to protein degradation, both Coomassie staining and western blot analysis revealed lower-weight products in the FFPE cell and xenograft samples,
Frozen FFPE
consistent with previous observations [5,22]. Since we initiated protein fixation immediately after harvesting, protein degradation may be the result of the duration of fixation, rather than solely due to handling prior to fix-ation. Our 16-hour fixation for cells and 24-hour fixation for xenografts may have led to challenges with isolating proteins from the fixed tissue, but this duration of fix-ation is commonly encountered in pathology laboratories. Novel extraction methods are continuously being devel-oped to specifically address the duration of fixation in pathology laboratories, and it will be beneficial in the fu-ture, to adapt these protocols to being compatible with RPPA [23]. Besides the observed partial degradation, the quality of the signal was overall comparable to frozen extractions. This implies that partial protein degradation or protein modification may occur in FFPE samples, but not to the extent of significantly lowering protein yield or signal detection. This is an important point, since the downstream application, RPPA, represents a dot blot, and
utilizes antibodies recognizing epitopes under denaturing conditions. This supports the notion that even partially degraded proteins will be readily detected using the RPPA approach, with little variation when compared to intact protein. Indeed, the dot blot approach of the RPPA may be even less influenced by protein degradation than the western blotting approach as RPPA only requires that the antibody epitope be intact and not the complete protein. This is supported by RPPA data which show that the average signal detected from the FFPE preparations was similar to that of the frozen counterparts (data not shown). In fact, the antibodies that exhibited marked dif-ference between frozen and FFPE preparations across experiments (Table 2) did so without showing any bias towards a particular preparation. The observed differ-ences in intensity for those markers between FFPE and frozen samples may be due to differential protein recov-ery rather than protein degradation, as suggested by pre-vious mass spectrometry-based experiments [3]. This
0 0.2 0.4 0.6 0.8 1
Akt Annexin AR BCl_X BCl2 BIM CyclinB1 EGFR IGFBP2 IGFRB MGMT p27_kip1 p53 PR PTCH Rb_pS807 S6_pS240 SHC_pY317 SYK TAU X4EBP1 X4EBP1_pS65 YBI_pS102
Spearman (frozen vs FFPE)
Renal Set Breast Cancer Set Cell lines
-0.2 -0.1 0 0.1 0.2 0.3 0.4 AMPKa
AMPKa_pT172 ARaf_pS299 ATM ATM_pS1981 c.RAF Cask Caspase3 CD86 CDk1 CollagenVI EGFR_pY1173 ETV6 FAK FOXO3a_pS318 IRS.1_pS307 JNK_pT183 KU80 LKB1 mTOR mTOR_pS2448 p27 PI3K_p110a SMAC VEGFR2 X4EBP1_pT70
Spearman (frozen vs FFPE)
Renal Set Breast Cancer Set Cell lines
A
B
implies that some protein markers may perform better in FFPE compared to frozen or vice versa depending on the extent of protein recovery. Indeed, it may be appropriate to use other approaches such as clustering or correlations with clinical and other characteristics to define the “gold standard” rather than assuming that frozen samples rep-resent the“truth”.
Previous studies have tested the applicability of RPPA on FFPE materials [3,24-27]. In this present study, we fol-lowed a systematic approach in evaluating feasibility, re-producibility and biological significance of RPPA applied on two distinct tissue types and for a wide range of pro-tein markers. We first established a cell plug model, in order to eliminate experimental variability due to storage duration of FFPE tissue blocks, differences in fixing times, autolysis due to delayed fixing, individual differences in samples, anatomical or regional heterogeneity, and other possible sources of variability commonly occurring in human tissue FFPE preparations. The predictable patterns of protein phosphorylation according to pharmacological manipulations applied to cultured cells proved particu-larly useful in this study, in order to determine whether both FFPE and frozen preparations of treated cells were capable of reproducing the anticipated results. Changes in the AKT downstream effector phospho-S6 were inhibited or induced by inhibitors or growth factors to a similar de-gree in both FFPE and frozen cells. However, the increases induced by EGF in pAKT were not detected in
FFPE samples suggesting degradation of pAKT. Neverthe-less, the decrease in pAKT induced by LY294002 was faithfully captured in both frozen and FFPE preparations. A striking correlation of phosphorylation status between upstream activator and downstream effector was observed in tissues. In particular, factors in the same sig-naling pathway, AKT, 4EBP1 and S6, were coordinately phosphorylated in both FFPE and frozen preparations in the same patient samples interrogated (Figure 5A). In-deed, the correlation in patient samples was higher than that in the cell line samples. The usefulness of proteomic profiling of FFPE tissues in producing biologically mean-ingful information is further supported by the observation that global protein expression information from FFPE samples was capable of accurately categorizing renal tis-sues according to their underlying biology i.e. separating cancer from normal.
Using different types of tissues and cells in this study revealed a wealth of differences with respect to their proteomic profiles. As anticipated, protein markers per-formed markedly differently according to tissue type. Many of them were not detected according to tissue type, regardless of FFPE or frozen preparation status (Table 2). With respect to markers that demonstrated good correlation between FFPE and matched frozen samples, only 23 markers were common across all tissue sets (Figure 5A), as a testament to marked biological di-versity of different cell lineages. This also suggests that it
Normalized logarithmic intensities
PR PR+
PR
PR+
FFPE samples
Frozen samples
may be necessary to select different antibodies to inter-rogate the diverse array of tissue lineages as protein and particular phosphoprotein stability may be tissue specific.
With respect to the reproducibility of the approach, it is important to note that separate preparations, either FFPE or frozen, from the same tissue sample (replicates) performed similarly on RPPA (Figure 2). This questions the notion that tissue heterogeneity between replicate preparations may introduce critical variations in protein profiling preventing useful interpretation if laser-capture microdissection is not applied [28]. It is noteworthy that our replicate preparations were derived from adjacent serial sections or pieces, therefore limiting tumor hetero-geneity. But unlike our replicate preparations from within the same sample, FFPE and matched frozen sam-ples came from tissue pieces that were located a signifi-cant distance from one another, especially in the case of breast cancer samples. Thus, tissue heterogeneity may have contributed to discrepancies between FFPE and matched frozen RPPA results. This is consistent with re-cently published studies of spatial heterogeneity of DNA mutations [29].
With respect to the applicability of RPPA in the clin-ical routine setting, it is encouraging that the RPPA-based measurements of PR correlated significantly with the immunohistochemical results of this clinically sig-nificant marker in breast tumors (Figure 6).
FFPE tissues represent a valuable resource to conduct retrospective studies aimed to biomarker discovery and validation, in cancer as well as other diseases. The most effective approach may be to both discover and validate molecular markers on FFPE preparations to decrease variability potentially induced by tissue handling when comparing FFPE and frozen samples. In order to im-prove the ability to characterize proteins from tissues used for pathological evaluation, a number of steps could be considered: using a consistent and short period of fixation in formalin, limiting the duration of time be-tween tissue collection and addition of formalin, using small tissue pieces where formalin will permeate more frequently, obtaining tissue from multiple parts of the tissue and the consideration of new fixation approaches that are under development. Clearly, FFPE tissue studies hold the promise of producing highly reproducible and meaningful data when linked to powerful high-throughput methodologies such as reverse-phase protein arrays.
Materials and methods Preparation of FFPE cell blocks
MDA-MB-231 and MDA-MB-468 cells were plated in 15 cm Petri dishes, and allowed to grow to 80% conflu-ence. They were subsequently starved with serum-free
medium overnight and then incubated with EGF or IGF for 10 minutes for cell signaling stimulation. The starved and growth factor stimulated cell monolayers were rinsed twice with TBS (50 mM Tris–HCl pH 7.5 and 150 mM NaCl) and harvested with rubber cell scrapers. Then cell pellets were processed as fresh frozen or FFPE cell blocks. Cell pellets were fixed in 10% formalin (Fisher Scientific, Pittsburgh, PA, USA) for 16 hours, and embedded in paraffin as a piece of tissue according to standard histological procedures. Paraffin cell blocks were stored at room temperature until analysis.
Xenografts and human tissues
The mammary pads of four-week-old female nude mice were inoculated with 5 × 10⁶MDA-MB-231 cells. Mice with mean tumor diameters of 0.5 cm were sacrificed and the grafted tumors were cut in halves. Half tumor was fixed in 10% formalin for 24 hours and paraffin em-bedded using standard procedures; the other half was immediately snap-frozen and then stored at−80°C until use. All experiments with mice were performed accord-ing to the IACUC guidelines for the care and use of liv-ing animals in scientific research.
Renal tumor, renal cortex and breast tumor tissue FFPE blocks and their matched frozen pieces from the same patients were obtained from the University of Texas MD Anderson Cancer Center tissue bank, follow-ing Institutional Review Board (IRB) approval and guide-lines. In the case of renal tissues, the FFPE and matched frozen preparations were derived from adjacent tissue pieces, whereas in the case of breast cancer tissues, they were derived from distant tumor pieces. Renal tissue samples were confirmed to have at least 70% cellular content, whereas the breast cancer tissue samples had at least 50% cellular content. All samples used in the study were histologically confirmed using H&E.
Deparaffinization and protein extraction
X-100, 50 mM Hepes, pH 7.4, 150 mM NaCl, 1.5 mM MgCl2, 1 mM EGTA, 10 mM NaF, 100 mM Na Pyru-vate, 1 mM Na3VO4, 10% glycerol, containing protease inhibitors and phosphatase inhibitors from Roche Ap-plied Science) [9] plus 4 × SDS buffer (3:1, v/v). For tis-sue samples, the amount of extraction buffer added to the pellets from paraffin sections was estimated accord-ing to the size of the tissue surface area. In particular, tissue blocks were first scanned with an Image Scanner (CanoScan 8400F, Canon, Lake Success, NY, USA) and then the surface area of the paraffin-embedded tissue was calculated using ImageJ (NIH). For frozen samples, adjustment of buffer volume according to weight of each frozen piece was performed.
The samples were first incubated on ice for 5 min, and mixed by vortexing, then boiled at 100°C for 20 min fol-lowed by an optional sonication step and an optional incu-bation at 80° C in a water bath for 2 hours. The extraction methods followed are described in detail in Table 1. After protein extraction, any remaining unsolubilized material was pelleted at 14000 × g for 20 min, and protein concen-tration of total protein extracted was determined by the BCA Protein Assay (Pierce Chemicals Co., Rockford, IL, USA). The Pierce BCA Protein Assay is a detergent-compatible formulation and the protein standards were prepared using the same lysis buffer as the samples.
SDS-PAGE and western blot
Protein extracts obtained from fresh-frozen and FFPE tis-sues were subjected to SDS-PAGE in a Bio-Rad Mini Protean II system. Proteins were stained with Brilliant R 250 according to Westermeier et al. [30]. Parallel gels were transferred onto PVDF (Polyvinylidene Fluoride, BioRad, Richmond, USA) membrane. Membranes were blocked and probed with antibodies against different sized molecules and visualized using ECL (Amersham/ GE health care).
RPPA assays and analysis
Protein extracts from cell and tissue paraffin blocks were probed for expression of validated antibodies by RPPA [9,11,31,32]. Specifically, five serial 2-fold dilutions of the protein extracts were performed using RPPA lysis buffer containing 1% SDS. The diluted lysates were spotted on nitrocellulose-coated FAST slides (Whatman, Schleicher & Schuell BioScience, Inc., Keene, NH) by an Aushon 2470 arrayer (Aushon Biosystems, Burlington, MA) per manufacturer’s protocol. The construction of the protein array is shown in Additional file 5: Figure S1. Each spotted slide was incubated with a primary antibody (Additional file 1: Table S1) in the appropriate dilution. A total of 169 slides were stained for 169 antibodies. The specific protein-antibody interaction was recognized by biotin-conjugated secondary antibody and amplified by
tyramide deposition. The analyte was detected by avidin-conjugated peroxidase reactive to its substrate chromogen diaminobenzidine (DAKO catalyzed signal amplification (CSA) system, DAKO, Carpinteria, CA). The stained RPPA slides were scanned by the Hewlett-Packard (HP) scanner and its companying scanning software, and the slide images were quantified for raw signal intensities by the software MicroVigene (VigeneTech Inc., Carlisle, MA) per manufacturer’s protocol. The raw signal intensities (which are provided in detail, in Additional files 2, 3 and 4: Tables S2, S3, and S4) were then processed by the R package SuperCurve [33] developed by the Department of Bioinformatics and Computational Biology at University of Texas MD Anderson Cancer Center (http://bioinfor-matics.mdanderson.org/Software/OOMPA/). The log2-scaled protein concentrations were normalized by global sample median normalization (GSMN) (the median of all protein marker intensities for a single sample is subtracted from each of the data points of this specific sample [22,34]). Student’s t test was used to evaluate statistical significance of differences in protein expression levels between FFPE and frozen sample groups, or between PR-negative and PR-positive breast cancer groups, in order to determine markers with intensity differences be-tween FFPE and frozen preparations, or bebe-tween PR-positive and PR-negative tumors. The reproducibility of sampling methods was determined by Spearman correl-ation coefficient. Principal component analysis was per-formed to show the relatedness of the samples and of the proteins. All statistical analysis was performed using the statistics software package R [35].
Additional files
Additional file 1:Table S1.List of the primary antibodies used in the RPPA experiments.
Additional file 2:Table S2.RPPA raw signal intensities of the cell lines experiment (FFPE and frozen).
Additional file 3:Table S3.RPPA raw signal intensities of the breast cancer tissue experiment (FFPE and frozen).
Additional file 4:Table S4.RPPA raw signal intensities of the renal tissue experiment (FFPE and frozen).
Additional file 5:Figure S1.Protein Microarray Construction. The size, design and dilution arrangement of the protein microarray are shown.
Additional file 6:Figure S2.SDS-PAGE analysis of protein lysates extracted from fresh frozen and FFPE cell blocks or xenografts by using different extraction protocols. (A) Extracts from breast cancer cell lines incubated with or without EGF were derived from FFPE or fresh preparations using different extraction methods and subjected to SDS-PAGE analysis. (B) SDS-SDS-PAGE image of protein extracts from fresh frozen and FFPE xenograft tissues are shown. Lane M: molecular weight marker. Arrows point to low molecular weight bands attributed to protein degradation.
Abbreviations
Protein Array; SDS-PAGE: Sodium Dodecyl Sulfate Polyacrylamide Gel Electrophoresis.
Competing interests
The authors declare that they have no competing interests.
Authors’contributions
HG: experiments and manuscript preparation, WL: statistics, ZJ: statistics, PT: tissue evaluation/pathology, EJ: tissue evaluation, GBM: manuscript preparation, YL: RPPA experiments and manuscript preparation, BTH: manuscript preparation, DT: RPPA experiments and manuscript preparation. All authors read and approved the final manuscript.
Authors’information
HG: Research scientist, Systems Biology, MD Anderson Cancer Center, WL: Research Statistical Analyst, MD Anderson Cancer Center, ZJ: Sr. Statistical Analyst, MD Anderson Cancer Center, PT: Associate Professor, Pathology, MD Anderson Cancer Center, EJ: Associate Professor, Genitourinary Medical Oncology, MD Anderson Cancer Center, GBM: Professor, Chair, Systems Biology, MD Anderson Cancer Center, YL: Associate professor, Systems Biology, director of RPPA Core, BTH: Senior Lecturer, RCSI, Consultant Medical Oncologist, Beaumont Hospital, Royal, College of Surgeons of Ireland, Dublin, Ireland, DT: Instructor, Genitourinary Medical Oncology, MD Anderson Cancer Center.
Acknowledgements
This work was supported by grants from:
BTH: Career Development Award (CDA) from the Conquer Cancer Foundation of the American Society of Clinical Oncology (ASCO), Translational research award TRA/2010/8 from the Health Research Board (HRB) of Ireland the Science Foundation Ireland (SFI).
DT: University of Texas MD Anderson Cancer Center Kidney Pilot Program, Mary K. Chapman Foundation Charitable Fund.
MD Anderson Cancer Center Support Grant (CCSG) CA016672 from National Institutes of Health.
Komen RPPA Grant.
Author details
1Department of Systems Biology, University of Texas MD Anderson Cancer
Center, Houston, TX, USA.2Department of Bioinformatics and Computational
Biology, University of Texas MD Anderson Cancer Center, Houston, TX, USA.
3
Department of Pathology, University of Texas MD Anderson Cancer Center, Houston, TX, USA.4Department of Genitourinary Medical Oncology,
University of Texas MD Anderson Cancer Center, Houston, TX, USA.
5Department of Medical Oncology, Beaumont Hospital, Royal College of
Surgeons of Ireland, Dublin, Ireland.
Received: 17 February 2012 Accepted: 10 September 2012 Published: 24 September 2012
References
1. Lim MS, Elenitoba-Johnson KS:Proteomics in pathology research.Lab Invest2004,84(10):1227–1244.
2. Crockett DK, Lin Z, Vaughn CP, Lim MS, Elenitoba-Johnson KS:Identification of proteins from formalin-fixed paraffin-embedded cells by LC-MS/MS.
Lab Invest2005,85(11):1405–1415.
3. Addis MF, Tanca A, Pagnozzi D, Crobu S, Fanciulli G, Cossu-Rocca P, Uzzau S: Generation of high-quality protein extracts from formalin-fixed, paraffin-embedded tissues.Proteomics2009,9(15):3815–3823. 4. Hood BL, Darfler MM, Guiel TG, Furusato B, Lucas DA, Ringeisen BR,
Sesterhenn IA, Conrads TP, Veenstra TD, Krizman DB:Proteomic analysis of formalin-fixed prostate cancer tissue.Mol Cell Proteomics2005, 4(11):1741–1753.
5. Shi SR, Liu C, Balgley BM, Lee C, Taylor CR:Protein extraction from formalin-fixed, paraffin-embedded tissue sections: quality evaluation by mass spectrometry.J Histochem Cytochem2006,54(6):739–743. 6. Palmer-Toy DE, Krastins B, Sarracino DA, Nadol JB Jr, Merchant SN:Efficient
method for the proteomic analysis of fixed and embedded tissues.
J Proteome Res2005,4(6):2404–2411.
7. Guo T, Wang W, Rudnick PA, Song T, Li J, Zhuang Z, Weil RJ, DeVoe DL, Lee CS, Balgley BM:Proteome analysis of microdissected formalin-fixed and
paraffin-embedded tissue specimens.J Histochem Cytochem2007, 55(7):763–772.
8. Hwang SI, Thumar J, Lundgren DH, Rezaul K, Mayya V, Wu L, Eng J, Wright ME, Han DK:Direct cancer tissue proteomics: a method to identify candidate cancer biomarkers from formalin-fixed paraffin-embedded archival tissues.Oncogene2007,26(1):65–76.
9. Tibes R, Qiu Y, Lu Y, Hennessy B, Andreeff M, Mills GB, Kornblau SM:Reverse phase protein array: validation of a novel proteomic technology and utility for analysis of primary leukemia specimens and hematopoietic stem cells.Mol Cancer Ther2006,5(10):2512–2521.
10. Park ES, Rabinovsky R, Carey M, Hennessy BT, Agarwal R, Liu W, Ju Z, Deng W, Lu Y, Woo HG,et al:Integrative analysis of proteomic signatures, mutations, and drug responsiveness in the NCI 60 cancer cell line set.
Mol Cancer Ther2010,9(2):257–267.
11. Carey MS, Agarwal R, Gilks B, Swenerton K, Kalloger S, Santos J, Ju Z, Lu Y, Zhang F, Coombes KR,et al:Functional proteomic analysis of advanced serous ovarian cancer using reverse phase protein array: TGF-beta pathway signaling indicates response to primary chemotherapy.Clin Cancer Res2010,16(10):2852–2860.
12. Sheehan KM, Calvert VS, Kay EW, Lu Y, Fishman D, Espina V, Aquino J, Speer R, Araujo R, Mills GB,et al:Use of reverse phase protein microarrays and reference standard development for molecular network analysis of metastatic ovarian carcinoma.Mol Cell Proteomics2005,4(4):346–355. 13. Spurrier B, Honkanen P, Holway A, Kumamoto K, Terashima M, Takenoshita
S, Wakabayashi G, Austin J, Nishizuka S:Protein and lysate array technologies in cancer research.Biotechnol Adv2008,26(4):361–369. 14. Speer R, Wulfkuhle J, Espina V, Aurajo R, Edmiston KH, Liotta LA, Petricoin EF
3rd:Development of reverse phase protein microarrays for clinical applications and patient-tailored therapy.Cancer Genomics Proteomics
2007,4(3):157–164.
15. Hennessy BT, Lu Y, Gonzalez-Angulo AM, Carey MS, Myhre S, Ju Z, Davies MA, Liu W, Coombes K, Meric-Bernstam F,et al:A Technical Assessment of the Utility of Reverse Phase Protein Arrays for the Study of the Functional Proteome in Non-microdissected Human Breast Cancers.Clin Proteomics2010,6(4):129–151.
16. Fowler CB, Cunningham RE, O'Leary TJ, Mason JT:'Tissue surrogates' as a model for archival formalin-fixed paraffin-embedded tissues.Lab Invest
2007,87(8):836–846.
17. Shi SR, Cote RJ, Taylor CR:Antigen retrieval immunohistochemistry and molecular morphology in the year 2001.Appl Immunohistochem Mol Morphol2001,9(2):107–116.
18. Chung JY, Lee SJ, Kris Y, Braunschweig T, Traicoff JL, Hewitt SM:A well-based reverse-phase protein array applicable to extracts from formalin-fixed paraffin-embedded tissue.Proteomics Clin Appl2008, 2:1539–1547.
19. Shi SR, Key ME, Kalra KL:Antigen retrieval in formalin-fixed, paraffin-embedded tissues: an enhancement method for immunohistochemical staining based on microwave oven heating of tissue sections.
J Histochem Cytochem1991,39(6):741–748.
20. Shi SR, Imam SA, Young L, Cote RJ, Taylor CR:Antigen retrieval immunohistochemistry under the influence of pH using monoclonal antibodies.J Histochem Cytochem1995,43(2):193–201.
21. Fowler CB, Cunningham RE, Waybright TJ, Blonder J, Veenstra TD, O'Leary TJ, Mason JT:Elevated hydrostatic pressure promotes protein recovery from formalin-fixed, paraffin-embedded tissue surrogates.Lab Invest
2008,88(2):185–195.
22. Zien A, Aigner T, Zimmer R, Lengauer T:Centralization: a new method for the normalization of gene expression data.Bioinformatics2001, 17(Suppl 1):S323–S331.
23. Wolff C, Schott C, Porschewski P, Reischauer B, Becker KF:Successful protein extraction from over-fixed and long-term stored formalin-fixed tissues.PLoS One2011,6(1):e16353.
24. Becker KF, Schott C, Hipp S, Metzger V, Porschewski P, Beck R, Nahrig J, Becker I, Hofler H:Quantitative protein analysis from formalin-fixed tissues: implications for translational clinical research and nanoscale molecular diagnosis.J Pathol2007,211(3):370–378.
25. Berg D, Langer R, Tran K, Walch A, Schuster T, Bronger H, Becker KF:Protein Microarray-based Comparison of HER2, Estrogen Receptor, and Progesterone Receptor Status in Core Biopsies and Surgical Specimens From FFPE Breast Cancer Tissues.Appl Immunohistochem Mol Morphol
26. Berg D, Wolff C, Malinowsky K, Tran K, Walch A, Bronger H, Schuster T, Hofler H, Becker KF:Profiling signalling pathways in formalin-fixed and paraffin-embedded breast cancer tissues reveals cross-talk between EGFR, HER2, HER3 and uPAR.J Cell Physiol2012,227(1):204–212. 27. Wolff C, Malinowsky K, Berg D, Schragner K, Schuster T, Walch A, Bronger H,
Hofler H, Becker KF:Signalling networks associated with urokinase-type plasminogen activator (uPA) and its inhibitor PAI-1 in breast cancer tissues: new insights from protein microarray analysis.J Pathol2011, 223(1):54–63.
28. Silvestri A, Colombatti A, Calvert VS, Deng J, Mammano E, Belluco C, De Marchi F, Nitti D, Liotta LA, Petricoin EF,et al:Protein pathway biomarker analysis of human cancer reveals requirement for upfront cellular-enrichment processing.Lab Invest2010,90(5):787–796.
29. Gerlinger M, Rowan AJ, Horswell S, Larkin J, Endesfelder D, Gronroos E, Martinez P, Matthews N, Stewart A, Tarpey P,et al:Intratumor heterogeneity and branched evolution revealed by multiregion sequencing.N Engl J Med2012,366(10):883–892.
30. Westermeier R:Sensitive, quantitative, and fast modifications for Coomassie Blue staining of polyacrylamide gels.Proteomics2006, 6(Suppl 2):61–64.
31. Hennessy BT, Lu Y, Poradosu E, Yu Q, Yu S, Hall H, Carey MS, Ravoori M, Gonzalez-Angulo AM, Birch R,et al:Pharmacodynamic markers of perifosine efficacy.Clin Cancer Res2007,13(24):7421–7431.
32. Stemke-Hale K, Gonzalez-Angulo AM, Lluch A, Neve RM, Kuo WL, Davies M, Carey M, Hu Z, Guan Y, Sahin A,et al:An integrative genomic and proteomic analysis of PIK3CA, PTEN, and AKT mutations in breast cancer.
Cancer Res2008,68(15):6084–6091.
33. Hu J, He X, Baggerly KA, Coombes KR, Hennessy BT, Mills GB: Non-parametric quantification of protein lysate arrays.Bioinformatics2007, 23(15):1986–1994.
34. Quackenbush J:Microarray data normalization and transformation.Nat Genet2002,32(Suppl):496–501.
35. Team RDC:R: A language and environment for statistical computing. Vienna, Austria: R Foundation for Statistical Computing; 2010:409.
doi:10.1186/1477-5956-10-56
Cite this article as:Guoet al.:An efficient procedure for protein extraction from formalin-fixed, paraffin-embedded tissues for reverse phase protein arrays.Proteome Science201210:56.
Submit your next manuscript to BioMed Central and take full advantage of:
• Convenient online submission
• Thorough peer review
• No space constraints or color figure charges
• Immediate publication on acceptance
• Inclusion in PubMed, CAS, Scopus and Google Scholar
• Research which is freely available for redistribution