R E S E A R C H A R T I C L E
Open Access
Decreased CD8
+
T cell response to Epstein-Barr
virus infected B cells in multiple sclerosis is not
due to decreased HLA class I expression on B
cells or monocytes
Michael P Pender
1,2*, Peter A Csurhes
1,3, Casey MM Pfluger
1,3and Scott R Burrows
4*Abstract
Background:Patients with multiple sclerosis (MS) have a decreased frequency of CD8+T cells reactive to their own Epstein-Barr virus (EBV) infected B cells. We have proposed that this might predispose to the development of MS by allowing EBV-infected autoreactive B cells to accumulate in the central nervous system. The decreased CD8+T cell response to EBV results from a general CD8+T cell deficiency and also a decreased proportion of EBV-specific T cells within the total CD8+T cell population. Because decreased HLA class I expression on monocytes and B cells has been reported in MS and could influence the generation and effector function of EBV-specific CD8+T cells, the present study was undertaken to measure the expression of HLA molecules on B cells and monocytes in patients with MS. Methods:We used flow cytometry to determine the proportions of T cells, natural killer cells, B cells and monocytes in peripheral blood mononuclear cells (PBMC) and to quantify the expression of HLA molecules on T cells, B cells and monocytes of 59 healthy subjects and 62 patients with MS who had not received corticosteroids or immunomodulatory therapy in the previous 3 months.
Results:The levels of HLA class I and class II molecules expressed on T cells, B cells and monocytes were normal in patients with MS, with the exception of two patients with secondary progressive MS with very low class II expression on B cells. In confirmation of previous studies we also found that the percentage of CD8+T cells was significantly decreased whereas the percentage of CD4+T cells and the CD4:CD8 ratio were significantly increased in patients with MS compared to healthy subjects.
Conclusions:The decreased CD8+T cell response to EBV-infected B cells in MS patients is not due to decreased HLA class I expression on monocytes or B cells. In a small proportion of patients decreased HLA class II expression on B cells might impair the CD8+T cell response to EBV by reducing CD4+T cell help.
Background
A large body of evidence indicates that infection with the Epstein-Barr virus (EBV) has a role in the pathogen-esis of multiple sclerosis (MS) [1-3]. Several hypotheses have been proposed to explain the role of EBV in the development of MS, including immunological crossreac-tivity between EBV and central nervous system (CNS)
antigens [4], autoimmunity to aB-crystallin [5], EBV infection of autoreactive B cells [6], bystander damage from immune attack against EBV in the CNS [7], and interactions with other infectious agents such as human endogenous retroviruses [8]. It is important to deter-mine the role of EBV in the pathogenesis of MS because of the potential to prevent and treat MS by controlling EBV infection, such as by vaccination against EBV [9]. In particular it is necessary to understand the exact rela-tionship between EBV and the immune system in MS in order to ensure that these interventions are beneficial, not harmful.
* Correspondence: m.pender@uq.edu.au; Scott.Burrows@qimr.edu.au 1
The University of Queensland, School of Medicine, Health Sciences Building, Royal Brisbane and Women’s Hospital, Queensland 4029, Australia
4
Cellular Immunology Laboratory, Queensland Institute of Medical Research, 300 Herston Rd., Brisbane 4029, Australia
Full list of author information is available at the end of the article
EBV infection is normally kept under tight control by EBV-specific immune responses, especially by cytotoxic CD8+ T cells which eliminate proliferating and lytically infected B cells [10]. We have hypothesized that a genetically determined defect in the elimination of EBV-infected B cells by cytotoxic CD8+ T cells might predis-pose to the development of MS by allowing EBV-infected autoreactive B cells to accumulate in the central nervous system [3,6]. Studies of CD8+ T cell reactivity to EBV using selected synthetic EBV peptides to stimu-late the T cells have produced conflicting results, with reports of normal reactivity [11] and increased reactivity [12] in clinically isolated syndromes, and normal reactiv-ity [12,13] and increased reactivreactiv-ity [14] in established MS. Studies using selected EBV peptides to assess T cell reactivity are limited by the fact that they do not pro-vide a measure of the total T cell response to EBV, which encodes many different proteins. To overcome this it is necessary to measure the T cell response to autologous EBV-infected B cells. This provides a direct measure of the aggregate T cell response to EBV-infected B cells in each subject because it uses each per-son’s natural antigen-processing mechanisms to present viral antigens at normal physiological concentrations on the surface of their own EBV-infected B cells and it represents the total T cell response to all EBV antigens presented by all HLA molecules on infected B cells in each subject [15]. Using this approach we have shown that patients with MS have a decreased frequency of CD8+T cells reactive to their own EBV-infected B cell lymphoblastoid cell lines (LCL) [15]. This results from a general CD8+T cell deficiency and also a decreased pro-portion of EBV-specific T cells within the total CD8+ T cell population [16]. Our finding of decreased CD8+ T cell reactivity to LCL in patients with MS [15] differs from a previous small study on 11 patients which reported a non-significant increase in the frequency of LCL-specific CD8+ T cells [17], but is consistent with an early report of decreased T cell control of LCL out-growth [18] and a recent report of a trend (p = 0.07) towards a decreased CD8+ T cell response to LCL [19].
In view of a previous report of decreased HLA class I expression on monocytes and B cells in patients with MS [20], which could impair the generation and effector function of EBV-specific CD8+ T cells, we have underta-ken the present study to quantify the level of HLA expression on B cells and monocytes in MS patients and healthy subjects.
Methods
Patients and controls
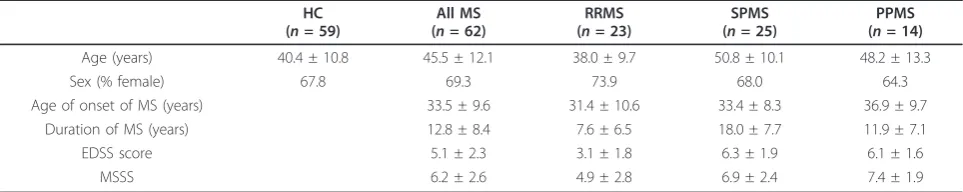
Blood was collected from 59 healthy subjects and 62 MS patients following informed consent. This study was approved by the Royal Brisbane & Women’s Hospital Human Research Ethics Committee and The University of Queensland Medical Research Ethics Committee. All patients met the 2005 Revised McDonald Criteria for a diagnosis of MS [21]. The clinical course was relapsing-remitting (RRMS) in 23 patients, secondary progressive (SPMS) in 25 and primary progressive (PPMS) in 14. The patients had not received corticosteroids or immu-nomodulatory therapy for at least 3 months prior to venesection. Only two patients had ever received immu-nosuppressive drugs and these had been ceased four years before blood collection. An additional 7 patients had received interferon-b which had been ceased 6 months to 6 years before blood collection. Disability was assessed using the Kurtzke Expanded Disability Status Scale (EDSS) [22], and the MS Severity Score (MSSS) was determined from the EDSS and disease duration [23]. The demographic and clinical details of the healthy subjects and patients with MS are presented in Table 1.
Flow cytometry
Peripheral blood mononuclear cells (PBMC) were sepa-rated by density centrifugation and cryopreserved, as previously described [15]. PBMC samples were thawed and cultured for 24 h to allow cells to rest and re-express cell surface receptors. Propidium iodide staining demonstrated > 99% viability within the lymphocyte and monocyte forward scatter/side scatter gate for each sam-ple used. PBMC samsam-ples were assessed using a Becton
Table 1 Characteristics of healthy subjects and patients with MS
HC (n= 59)
All MS (n= 62)
RRMS (n= 23)
SPMS (n= 25)
PPMS (n= 14)
Age (years) 40.4 ± 10.8 45.5 ± 12.1 38.0 ± 9.7 50.8 ± 10.1 48.2 ± 13.3
Sex (% female) 67.8 69.3 73.9 68.0 64.3
Age of onset of MS (years) 33.5 ± 9.6 31.4 ± 10.6 33.4 ± 8.3 36.9 ± 9.7
Duration of MS (years) 12.8 ± 8.4 7.6 ± 6.5 18.0 ± 7.7 11.9 ± 7.1
EDSS score 5.1 ± 2.3 3.1 ± 1.8 6.3 ± 1.9 6.1 ± 1.6
MSSS 6.2 ± 2.6 4.9 ± 2.8 6.9 ± 2.4 7.4 ± 1.9
All values except for sex presented as mean ± standard deviation.
Dickinson FACSCalibur flow cytometer to determine the percentages of CD3+ T cells, CD4+CD3+ T cells, CD8+CD3+ T cells, CD16+CD3-/CD56+CD3- natural killer (NK) cells, CD19+ B cells and CD14+ monocytes within the combined lymphocyte and monocyte gates. To quantify expression of HLA class I or class II mole-cules, PBMC were co-stained with either anti-HLA-ABC or anti-HLA-DR/DP/DQ in combination with anti-CD3 (T cells), anti-CD19 (B cells) or anti-CD14 (monocyte) antibodies. HLA-DR expression was also measured in 30 of the healthy subjects and 33 of the MS patients. Cali-brite beads (BD Pharmingen) and FACSComp software were used daily to ensure calibrated, comparable mea-surement of geometric mean fluorescence intensity (MFI). Antibodies were directly conjugated to allophyco-cyanin (anti-CD3, anti-CD19 and anti-CD14), R-phy-coerythrin (CD4, CD8, CD16 and anti-CD56) or fluorescein isothiocyanate (anti-HLA-ABC, anti-HLA-DR/DP/DQ and anti-HLA-DR) (BD Pharmin-gen, San Diego, California, USA). CellQuest software (BD Biosciences) was used for acquisition and analysis of flow cytometry data.
Data analysis and statistics
Statistical analyses were performed using GraphPad Prism version 5.04 (Graphpad Software Inc., San Diego, California, USA, http://www.graphpad.com). For com-parisons between the whole group of MS patients and healthy subjects, Student’sttest or the Mann-Whitney rank sum test was used, according to the distribution of the data. For comparison between each of the subtypes of MS (RRMS, SPMS and PPMS) and healthy subjects, one-way analysis of variance with Dunnett’s test for multiple comparisons was used. The CD4:CD8 ratios were log transformed to make the distributions approxi-mately normal prior to analysis. Differences were con-sidered significant forp< 0.05.
Results
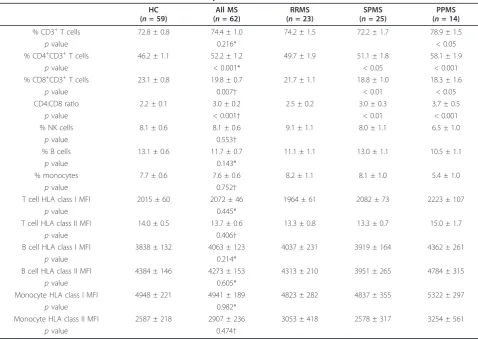
Table 2 shows the proportions of lymphocytes and monocytes in the peripheral blood. The percentages of CD3+T cells, NK cells, B cells and monocytes were nor-mal in the total group of MS patients, as well as in the RRMS, SPMS and PPMS subgroups, with the exception of an increased percentage of CD3+ T cells in PPMS. The percentage of CD8+ T cells was significantly decreased whereas the percentage of CD4+ T cells and the CD4:CD8 ratio were significantly increased in the total group of MS patients compared to healthy subjects; these changes were more pronounced in SPMS and PPMS than in RRMS. The levels of expression of HLA class I molecules on T cells, B cells and monocytes were normal in the total group of MS patients and in the RRMS, SPMS and PPMS subgroups (Table 2). Analysis
of HLA class I expression with the W6/32 antibody used by Li and colleagues [20] also demonstrated nor-mal HLA class I expression on lymphocytes and mono-cytes in the MS patients (data not shown). The levels of HLA class II expression on T cells, B cells and mono-cytes were also normal in the total group of MS patients, as well as in the RRMS, SPMS and PPMS sub-groups (Table 2), with the exception of very low levels of B cell expression (MFI = 1077 and 1139) in 2 patients with SPMS. HLA-DR expression on B cells was also assessed in one of these 2 patients and found to be very low (MFI = 2404). HLA-DR expression on B cells and monocytes was otherwise normal in the MS patients tested (Table 3).
Discussion
In the present study we have found that patients with MS have normal expression of HLA class I molecules on T cells, B cells and monocytes. Our findings stand in contrast to a previous study reporting low levels of HLA class I expression on T cells, B cells and monocytes in MS patients [20], but are consistent with a report of normal HLA class I expression on monocytes in MS [24] and with our previous finding of normal HLA class I expression on EBV-infected LCL in MS patients [15]. We therefore conclude that the decreased CD8+ T cell response to EBV-infected B cells in MS patients [15,16] is not due to decreased HLA class I expression on monocytes or B cells.
We also found normal expression of HLA class II molecules on T cells, B cells and monocytes in patients with MS, with the exception of two patients with SPMS who had very low class II expression on B cells. Low B cell HLA class II expression might impair the CD8+ T cell response to EBV by reducing CD4+ T cell help, which normally stimulates the expansion of EBV-specific CD8+ T cells by producing interleukin-2 [25]. Our find-ing of normal HLA-DR expression on monocytes in MS is consistent with the report of Kouwenhoven and col-leagues [24].
which we propose is genetically determined. The CD4/ CD8 T cell ratio is genetically controlled [34], with at least some of the responsible genes being located in the HLA complex [35]. CD8+ T cell deficiency is a feature of many chronic autoimmune diseases and is also found in healthy blood relatives of patients with autoimmune
diseases [36-38], indicating that it is genetically deter-mined and not secondary to the disease process.
Conclusions
The decreased CD8+ T cell response to EBV-infected B cells in MS patients is not due to decreased HLA class I
Table 2 PBMC subsets and HLA class I and class II expression
HC (n= 59)
All MS (n= 62)
RRMS (n= 23)
SPMS (n= 25)
PPMS (n= 14)
% CD3+T cells 72.8 ± 0.8 74.4 ± 1.0 74.2 ± 1.5 72.2 ± 1.7 78.9 ± 1.5
pvalue 0.216* < 0.05
% CD4+CD3+T cells 46.2 ± 1.1 52.2 ± 1.2 49.7 ± 1.9 51.1 ± 1.8 58.1 ± 1.9
pvalue < 0.001* < 0.05 < 0.001
% CD8+CD3+T cells 23.1 ± 0.8 19.8 ± 0.7 21.7 ± 1.1 18.8 ± 1.0 18.3 ± 1.6
pvalue 0.007† < 0.01 < 0.05
CD4:CD8 ratio 2.2 ± 0.1 3.0 ± 0.2 2.5 ± 0.2 3.0 ± 0.3 3.7 ± 0.5
pvalue < 0.001† < 0.01 < 0.001
% NK cells 8.1 ± 0.6 8.1 ± 0.6 9.1 ± 1.1 8.0 ± 1.1 6.5 ± 1.0
pvalue 0.553†
% B cells 13.1 ± 0.6 11.7 ± 0.7 11.1 ± 1.1 13.0 ± 1.1 10.5 ± 1.1
pvalue 0.143*
% monocytes 7.7 ± 0.6 7.6 ± 0.6 8.2 ± 1.1 8.1 ± 1.0 5.4 ± 1.0
pvalue 0.752†
T cell HLA class I MFI 2015 ± 60 2072 ± 46 1964 ± 61 2082 ± 73 2223 ± 107
pvalue 0.445*
T cell HLA class II MFI 14.0 ± 0.5 13.7 ± 0.6 13.3 ± 0.8 13.3 ± 0.7 15.0 ± 1.7
pvalue 0.406†
B cell HLA class I MFI 3838 ± 132 4063 ± 123 4037 ± 231 3919 ± 164 4362 ± 261
pvalue 0.214*
B cell HLA class II MFI 4384 ± 146 4273 ± 153 4313 ± 210 3951 ± 265 4784 ± 315
pvalue 0.605*
Monocyte HLA class I MFI 4948 ± 221 4941 ± 189 4823 ± 282 4837 ± 355 5322 ± 297
pvalue 0.982*
Monocyte HLA class II MFI 2587 ± 218 2907 ± 236 3053 ± 418 2578 ± 317 3254 ± 561
pvalue 0.474†
All values presented as mean ± standard error.
PBMC: peripheral blood mononuclear cells, HC: healthy control subjects, All MS: total group of MS patients, RRMS: relapsing-remitting MS, SPMS: secondary progressive MS, PPMS: primary progressive MS, NK: natural killer, MFI: mean fluorescence intensity.
Allpvalues are for comparisons with HC, using either Student’sttest* or the Mann-Whitney rank sum test†for the comparison with All MS, and using one-way analysis of variance with Dunnett’s test for multiple comparisons for comparisons with RRMS, SPMS and PPMS;pvalues < 0.05 are considered significant. In the right three columns of the table,pvalues are corrected for multiple comparisons using Dunnett’s test and are > 0.05 unless otherwise indicated. The CD4:CD8 ratios have been log transformed to make the distributions approximately normal prior to analysis.
Table 3 HLA-DR expression
HC (n= 30)
All MS (n= 33)
RRMS (n= 10)
SPMS (n= 15)
PPMS (n= 8)
B cell HLA-DR MFI 4745 ± 127 4729 ± 147 4894 ± 209 4489 ± 279 4974 ± 135
pvalue 0.940 > 0.05 > 0.05 > 0.05
Monocyte HLA-DR MFI 4122 ± 337 4321 ± 314 4657 ± 683 4122 ± 384 4273 ± 729
pvalue 0.655 > 0.05 > 0.05 > 0.05
All values presented as mean ± standard error.
HC: healthy control subjects; All MS: total group of MS patients, RRMS: relapsing-remitting MS, SPMS: secondary progressive MS, PPMS: primary progressive MS, MFI: mean fluorescence intensity.
expression on monocytes or B cells. In a small propor-tion of patients decreased HLA class II expression on B cells might impair the CD8+ T cell response to EBV by reducing CD4+T cell help.
Acknowledgements
This study was supported by project grants from Multiple Sclerosis Research Australia. We are grateful to Dr Kerryn Green, Kaye Hooper and Bernie Gazzard for assistance in clinically assessing patients and in the collection of blood samples and to Dr Peter Baker for statistical advice.
Author details
1The University of Queensland, School of Medicine, Health Sciences Building, Royal Brisbane and Women’s Hospital, Queensland 4029, Australia. 2Department of Neurology, Royal Brisbane and Women’s Hospital, Queensland 4029, Australia.3The University of Queensland Centre for Clinical Research, Royal Brisbane and Women’s Hospital, Queensland 4029, Australia. 4Cellular Immunology Laboratory, Queensland Institute of Medical Research, 300 Herston Rd., Brisbane 4029, Australia.
Authors’contributions
MPP planned the study, recruited and assessed the patients, helped analyze the results, and wrote the manuscript. PAC performed the laboratory studies and analyzed the data. CMMP assisted with the laboratory studies. SRB helped plan the study and analyze the data. All authors read and approved the final manuscript.
Competing interests
The authors declare that they have no competing interests.
Received: 24 June 2011 Accepted: 3 August 2011 Published: 3 August 2011
References
1. Ascherio A, Munger KL:Epstein-Barr virus infection and multiple sclerosis: a review.J Neuroimmune Pharmacol2010,5:271-277.
2. Santiago O, Gutierrez J, Sorlozano A, de Dios Luna J, Villegas E,
Fernandez O:Relation between Epstein-Barr virus and multiple sclerosis: analytic study of scientific production.Eur J Clin Microbiol Infect Dis2010, 29:857-866.
3. Pender MP:The essential role of Epstein-Barr virus in the pathogenesis of multiple sclerosis.Neuroscientist2011,17:351-367.
4. Lang HL, Jacobsen H, Ikemizu S, Andersson C, Harlos K, Madsen L, Hjorth P, Sondergaard L, Svejgaard A, Wucherpfennig K, Stuart DI, Bell JI, Jones EY, Fugger L:A functional and structural basis for TCR cross-reactivity in multiple sclerosis.Nat Immunol2002,3:940-943.
5. Van Noort JM, Bajramovic JJ, Plomp AC, van Stipdonk MJB:Mistaken self, a novel model that links microbial infections with myelin-directed autoimmunity in multiple sclerosis.J Neuroimmunol2000,105:46-57. 6. Pender MP:Infection of autoreactive B lymphocytes with EBV, causing
chronic autoimmune diseases.Trends Immunol2003,24:584-588. 7. Serafini B, Rosicarelli B, Franciotta D, Magliozzi R, Reynolds R, Cinque P,
Andreoni L, Trivedi P, Salvetti M, Faggioni A, Aloisi F:Dysregulated Epstein-Barr virus infection in the multiple sclerosis brain.J Exp Med2007, 204:2899-2912.
8. Krone B, Grange JM:Multiple sclerosis: are protective immune mechanisms compromised by a complex infectious background?
Autoimmune Dis2010,2011:708750.
9. Pender MP:Preventing and curing multiple sclerosis by controlling Epstein-Barr virus infection.Autoimmun Rev2009,8:563-568. 10. Hislop AD, Taylor GS, Sauce D, Rickinson AB:Cellular responses to viral
infection in humans: lessons from Epstein-Barr virus.Annu Rev Immunol
2007,25:587-617.
11. Lünemann JD, Tintoré M, Messmer B, Strowig T, Rovira A, Perkal H, Caballero E, Münz C, Montalban X, Comabella M:Elevated Epstein-Barr virus-encoded nuclear antigen-1 immune responses predict conversion to multiple sclerosis.Ann Neurol2010,67:159-169.
12. Jilek S, Schluep M, Meylan P, Vingerhoets F, Guignard L, Monney A, Kleeberg J, Le Goff G, Pantaleo G, Du Pasquier RA:Strong EBV-specific CD8
+ T-cell response in patients with early multiple sclerosis.Brain2008, 131:1712-1721.
13. Gronen F, Ruprecht K, Weissbrich B, Klinker E, Kroner A, Hofstetter HH, Rieckmann P:Frequency analysis of HLA-B7-restricted Epstein-Barr virus-specific cytotoxic T lymphocytes in patients with multiple sclerosis and healthy controls.J Neuroimmunol2006,180:185-192.
14. Höllsberg P, Hansen HJ, Haahr S:Altered CD8+ T cell responses to selected Epstein-Barr virus immunodominant epitopes in patients with multiple sclerosis.Clin Exp Immunol2003,132:137-143.
15. Pender MP, Csurhes PA, Lenarczyk A, Pfluger CMM, Burrows SR:Decreased T cell reactivity to Epstein-Barr virus infected lymphoblastoid cell lines in multiple sclerosis.J Neurol Neurosurg Psychiatry2009,80:498-505. 16. Pender MP, Csurhes PA, Pfluger CMM, Burrows SR:CD8 T cell deficiency
impairs control of Epstein-Barr virus and worsens with age in multiple sclerosis.J Neurol Neurosurg Psychiatry2011.
17. Cepok S, Zhou D, Srivastava R, Nessler S, Stei S, Büssow K, Sommer N, Hemmer B:Identification of Epstein-Barr virus proteins as putative targets of the immune response in multiple sclerosis.J Clin Invest2005, 115:1352-1360.
18. Craig JC, Hawkins SA, Swallow MW, Lyttle JA, Patterson VH, Merrett JD, Haire M:Subsets of T lymphocytes in relation to T lymphocyte function in multiple sclerosis.Clin Exp Immunol1985,61:548-555.
19. Lindsey JW, Hatfield LM:Epstein-Barr virus and multiple sclerosis: cellular immune response and cross-reactivity.J Neuroimmunol2010,229:238-242. 20. Li F, Linan MJ, Stein MC, Faustman DL:Reduced expression of
peptide-loaded HLA class I molecules on multiple sclerosis lymphocytes.Ann Neurol1995,38:147-154.
21. Polman CH, Reingold SC, Edan G, Filippi M, Hartung H-P, Kappos L, Lublin FD, Metz LM, McFarland HF, O’Connor PW, Sandberg-Wollheim M, Thompson AJ, Weinshenker BG, Wolinsky JS:Diagnostic criteria for multiple sclerosis: 2005 Revisions to the“McDonald Criteria”.Ann Neurol
2005,58:840-846.
22. Kurtzke JF:Rating neurologic impairment in multiple sclerosis: an expanded disability status scale (EDSS).Neurology1983,33:1444-1452. 23. Roxburgh RH, Seaman SR, Masterman T, Hensiek AE, Sawcer SJ, Vukusic S,
Achiti I, Confavreux C, Coustans M, le Page E, Edan G, McDonnell GV, Hawkins S, Trojano M, Liguori M, Cocco E, Marrosu MG, Tesser F, Leone MA, Weber A, Zipp F, Miterski B, Epplen JT, Oturai A, Sørensen PS, Celius EG, Lara NT, Montalban X, Villoslada P, Silva AM, Marta M, Leite I, Dubois B, Rubio J, Butzkueven H, Kilpatrick T, Mycko MP, Selmaj KW, Rio ME, Sá M, Salemi G, Savettieri G, Hillert J, Compston DA:Multiple Sclerosis Severity Score: using disability and disease duration to rate disease severity.
Neurology2005,64:1144-1151.
24. Kouwenhoven M, Teleshova N, Özenci V, Press R, Link H:Monocytes in multiple sclerosis: phenotype and cytokine profile.J Neuroimmunol2001, 112:197-205.
25. Gudgeon NH, Taylor GS, Long HM, Haigh TA, Rickinson AB:Regression of Epstein-Barr induced B-cell transformation in vitro involves virus-specific CD8+ T cells as the principal effectors and a novel CD4+ T-cell reactivity.J Virol2005,79:5477-5488.
26. Reinherz EL, Weiner HL, Hauser SL, Cohen JA, Distaso JA, Schlossman SF: Loss of suppressor T cells in active multiple sclerosis. Analysis with monoclonal antibodies.N Engl J Med1980,303:125-129.
27. Bach M-A, Phan-Dinh-Tuy F, Tournier E, Chatenoud L, Bach J-F, Martin C, Degos J-D:Deficit of suppressor T cells in active multiple sclerosis.Lancet
1980,316:1221-1223.
28. Compston A:Lymphocyte subpopulations in patients with multiple sclerosis.J Neurol Neurosurg Psychiatry1983,46:105-114.
29. Antel JP, Peeples DM, Reder AT, Arnason BGW:Analysis of T regulator cell surface markers and functional properties in multiple sclerosis.J Neuroimmunol1984,6:93-103.
30. Thompson AJ, Brazil J, Whelan CA, Martin EA, Hutchinson M, Feighery C: Peripheral blood T lymphocyte changes in multiple sclerosis: a marker of disease progression rather than of relapse?J Neurol Neurosurg Psychiatry1986,49:905-912.
31. Trotter JL, Clifford DB, McInnis JE, Griffeth RC, Bruns KA, Perlmutter MS, Anderson CB, Collins KG, Banks G, Hicks BC:Correlation of immunological studies and disease progression in chronic progressive multiple sclerosis.Ann Neurol1989,25:172-178.
cells of patients with multiple sclerosis and controls.Eur Neurol1992, 32:190-194.
33. Michałowska-Wender G, Wender M:Mononuclear subsets in the peripheral blood of multiple sclerosis patients in relation to results of brain gadolinium-enhancing imaging.Folia Neuropathol2006,44:67-71. 34. Amadori A, Zamarchi R, De Silvestro G, Forza G, Cavatton G, Danieli GA,
Clementi M, Chieco-Bianchi L:Genetic control of the CD4/CD8 T-cell ratio in humans.Nat Med1995,1:1279-1283.
35. Ferreira MAR, Mangino M, Brumme CJ, Zhao ZZ, Medland SE, Wright MJ, Nyholt DR, Gordon S, Campbell M, McEvoy BP, Henders A, Evans DM, Lanchbury JS, Pereyra F, International HIV Controllers Study, Walker BD, Haas DW, Soranzo N, Spector TD, de Bakker PI, Frazer IH, Montgomery GW, Martin NG:Quantitative trait loci for CD4:CD8 lymphocyte ratio are associated with risk of type 1 diabetes and HIV-1 immune control.Am J Hum Genet2010,86:88-92.
36. Jabs DA, Arnett FC, Bias WB, Beale MG:Familial abnormalities of lymphocyte function in a large Sjögren’s syndrome kindred.J Rheumatol
1986,13:320-326.
37. Johnston C, Alviggi L, Millward BA, Leslie RDG, Pyke DA, Vergani D: Alterations in T-lymphocyte subpopulations in type 1 diabetes. Exploration of genetic influence in identical twins.Diabetes1988, 37:1484-1488.
38. Johansen M, Elling P, Elling H, Olsson A:A genetic approach to the aetiology of giant cell arteritis: depletion of the CD8+ T-lymphocyte subset in relatives of patients with polymyalgia rheumatica and arteritis temporalis.Clin Exp Rheumatol1995,13:745-748.
Pre-publication history
The pre-publication history for this paper can be accessed here: http://www.biomedcentral.com/1471-2377/11/95/prepub
doi:10.1186/1471-2377-11-95
Cite this article as:Penderet al.:Decreased CD8+T cell response to Epstein-Barr virus infected B cells in multiple sclerosis is not due to decreased HLA class I expression on B cells or monocytes.BMC Neurology201111:95.
Submit your next manuscript to BioMed Central and take full advantage of:
• Convenient online submission
• Thorough peer review
• No space constraints or color figure charges
• Immediate publication on acceptance
• Inclusion in PubMed, CAS, Scopus and Google Scholar
• Research which is freely available for redistribution