R E S E A R C H
Open Access
Erectile dysfunction and exposure to
ambient air pollution in a nationally
representative cohort of older men
Lindsay A. Tallon
1,2, Justin Manjourides
1, Vivian C. Pun
1, Murray A. Mittleman
3, Marianthi-Anna Kioumourtzoglou
4,
Brent Coull
5and Helen Suh
6*Abstract
Background:Little is known about the association between air pollution and erectile dysfunction (ED), a disorder occurring in 64% of men over the age of 70, and to date, no studies have been published. To address this significant knowledge gap, we explored the relationship between ED and air pollution in a group of older men who were part of the National Social Life, Health, and Aging Project (NSHAP), a nationally representative cohort study of older Americans.
Methods:We obtained incident ED status and participant data for 412 men (age 57–85). Fine particulate matter (PM2.5) exposures were estimated using spatio-temporal models based on participants’geocoded addresses, while nitrogen dioxide (NO2) and ozone (O3) concentrations were estimated using nearest measurements from the Environmental Protection Agency’s Air Quality System. The association between air pollution and incident ED (newly developed in Wave 2) was examined and logistic regression models were run with adjusted models controlling for race, education, season, smoking, obesity, diabetes, depression, and median household income of census tract.
Results:We found positive, although statistically insignificant, associations between PM2.5, NO2, and O3exposures and odds of incident ED for each of our examined exposure windows, including 1 to 7 year moving averages. Odds ratios (OR) for 1 and 7 year moving averages equaled 1.16 (95% CI: 0.87, 1.55) and 1.16 (95% CI: 0.92, 1.46), respectively, for an IQR increase in PM2.5exposures. Observed associations were robust to model specifications and were not significantly modified by any of the examined risk factors for ED.
Conclusions:We found associations between PM2.5, NO2, and O3exposures and odds of developing ED that did not reach nominal statistical significance, although exposures to each pollutant were consistently associated with higher odds of developing ED. While more research is needed, our findings suggest a relationship between air pollutant exposure and incident cases of ED, a common condition in older men.
Keywords:Men, Vasculature, Erectile dysfunction, PM2.5
Background
Erectile dysfunction (ED), defined as the inability of a man to achieve or maintain an erection [1], is one of the most common health conditions affecting older men. Prevalence of ED is estimated to equal 20–40% in men aged 60–69 years and 64% in men over the age of 70 [2], with 617,715 new cases of ED expected each year in the
United States among white males between 40 and 69 years old [3]. With the aging of the population, it is estimated that globally by the year 2025, over 320 mil-lion men will have ED [4]. ED has a considerable impact on quality of life, having been associated with a variety of underlying psychological and physiological conditions, such as depression, Type 1 and Type 2 diabetes mellitus, use of medications, and cardiovascular disease [5]. How-ever, ED is often left untreated, with as few as 10% of men with ED receiving treatment [6]. Both treatment and prevention of ED includes lifestyle modifications like * Correspondence:[email protected]
6Department of Civil and Environmental Engineering, Tufts University, 200
College Avenue, 301 Anderson Hall, Medford, MA 02155, USA Full list of author information is available at the end of the article
exercise, weight loss, smoking cessation, and treatment for comorbid conditions [5].
ED is a complex neurovascular process, influenced by hormones and involves multiple pathways within the body. ED is a predictor of occult and subclinical cardio-vascular disease [7] that often occurs in 3 to 5 years after ED diagnosis [7, 8]. Given this, it is not surprising that ED has been shown to share a number of risk factors with car-diovascular disease, including restricted blood flow and vascular compromise with endothelial dysfunction at both the macro and microvascular level [9, 10]. It is also plaus-ible that ED shares other risk factors with cardiovascular disease, including air pollutants such as fine particulate matter (PM2.5; particles with aerodynamic diameters
≤2.5 μm) [11]. PM2.5 in particular has consistently been
shown to be strongly associated with cardiovascular mor-bidity and mortality [12, 13]. The biological pathways through which PM2.5 leads to cardiovascular damage is
thought to occur primarily through inflammation and oxi-dative stress [14], leading to systemic vascular and endo-thelial cell dysfunction [14, 15]. Whether PM2.5’s impacts
on systemic vascular dysfunction also lead to ED is un-known. To our knowledge, no studies to date have been published investigating the association between air pollu-tion and ED. To address this significant knowledge gap, we investigated the association between air pollution and incident ED using a nationally representative cohort study of older men from the National Social Life, Health, and Aging Project (NSHAP).
Methods Study participants
NSHAP is a longitudinal, population-based study of community-dwelling older adults, who were selected for participation based on a nationally representative prob-ability sample of household-resident older adults aged 57–85 years, with oversampling of African-Americans, Hispanics, men, and adults aged 75–84 years. Numerous self-reported and biological measures of social, psycho-logical, functional, and physiological health were col-lected for each participant in each of two data collection waves. The first wave (Wave 1) was conducted from July 2005 to March 2006, with in-home interviews, bio-specimen collection, and respondent-completed ques-tionnaires performed for 3,005 individuals (1,455 men). The same data were obtained in Wave 2 (August 2010 to May 2011) for 3,377 participants (1,538 men), includ-ing 2,261 respondents from Wave 1, 161 Wave 1 eligible, but non-interviewed respondents, and 955 spouses or cohabitating romantic partners. The overall weighted response rate (weighted for differential probabilities of selection and nonresponse) among the 2,261 individuals (1068 men) who participated in both waves was 75.5% and 76.9% for Waves 1 and 2 respectively, and interviews
were completed in English or Spanish as appropriate.[16] The protocol was approved by the Institutional Review Boards of Northeastern University, the University of Chicago and NORC at the University of Chicago. All respondents provided written informed consent.
ED measures
ED status was obtained through self-report to the ques-tion asking men if “during the last 12 months has there ever been a period of several months or more when you had trouble getting or maintaining an erection?” This question was administered only to men who reported sexual activity within one year of the interview date in Wave 1 and of all men in Wave 2. Information on ED medication use and prostatectomy surgery was also col-lected via questionnaire. Men were counted as having ED if they answered yes to having ED or taking medica-tions to treat ED. Incident cases were defined as men who participated in both waves and developed ED between Wave 1 and Wave 2.
Other covariates
Measures of height and weight were taken at the time of the interview to calculate to body mass index (BMI), with a BMI of 30 or greater kg/m2defined as obese [17]. Addition-ally, blood spot samples were collected and blood pressure was measured for each participant (2–3 consecutive times) during the home interview. Blood pressure was estimated as the average of the repeated measurements, with hyper-tension defined as having average systolic and diastolic measurement of greater than 140 mmHg and 90 mmHg, respectively [18]. C-Reactive Protein (CRP) was measured from dried blood samples, and was considered elevated if greater than 1 mg/L. Participants with CRP measurements greater than 40 mg/L were not included in CRP analyses, given the likelihood of an active infection [19].
In addition, information on medical conditions, like dia-betes, and measures of activity, such as exercise and ability to walk across a room, were obtained through participant self-report. Measures of emotional health were also obtained, with depression assessed using an eleven ques-tion version of the Center for Epidemiological Studies – Depression scale, CESD-11 [20]. A score of 9 or greater on the CESD-11 was used to identify individuals with “moderate-to-severe”depressive symptoms [20, 21].
Air pollution exposure assessment
Daily PM2.5exposures were estimated on a 6 km (km) grid
covering the conterminous United States using a set of five spatio-temporal generalized additive mixed models (GAMMs) of daily PM2.5mass levels fit separately to 1999–
2001, 2002–2004, 2005–2007, 2008–2009, and 2010–2011 based on previous work from Yanosky et al. [22]. PM2.5
data for the models were obtained primarily from the EPA’s Air Quality System (AQS) database and Interagency Moni-toring of Protected Visual Environments (IMPROVE) net-work [23, 24]. The models included three meteorological covariates (i.e., wind speed, temperature, and total precipi-tation) that influence pollutant dispersion as well as several geospatial covariates such as smoothed county population density from the 2000 U.S. census, point-source PM2.5
emissions density within 7.5 km, proportion of urban land use within 1 km, elevation, and annual-average PM2.5 for
2002 from EPA’s Community Multiscale Air Quality model. Finally, the daily PM2.5 models include traffic-related PM
levels, represented as the output of a Gaussian line-source dispersion modeling approach. The line-source model uses ADMS-Roads software and associated spatially-smoothed traffic intensity and daily meteorological inputs to describe small-scale spatial gradients in primary PM concentrations near roadways. The daily PM2.5model was validated using
cross-validation techniques, as in Yanosky et al. [22], and had a cross-validation R2of 0.76. Cases and controls were matched by date of interview to the PM2.5grid values
clos-est to their residential addresses, taking into account moves between waves. One to seven year moving averages from the date of interview were calculated from the daily PM2.5
estimates. The mean distance between each grid centroid–residential address pair was 2.23 km, with a range of 0.05 – 4.21 km.
As secondary analyses, exposures to ozone (O3) and
nitrogen dioxide (NO2) were also estimated using data
from the EPA’s AQS. For both O3and NO2, participants
were matched to the AQS monitor nearest to their resi-dential address, provided that this monitor was located within 60 km of the participant’s home. Air pollution ex-posures were estimated for 93% (for O3) and 63% (for
NO2) of all male NSHAP participants. For NO2, 1–7
year moving averages from the date of interview were calculated. For O3, 1–7 year average exposures preceding
the interview date were calculated based on the average warm season (April-September) concentration, since O3
is measured at most monitoring sites only during warmer months. Moving averages for each pollutant were considered valid if≥75% of the daily values within each exposure window were available.
Statistical analyses
To investigate the association between chronic air pollu-tant exposures and incident ED, we performed logistic
regression analyses, with the outcome of incident ED de-fined as men reporting either ED or ED medication use in Wave 2 but not Wave 1. Base models controlled for covariates including age and geographic region, while adjusted models additionally controlled for race/ethni-city (white, black, Hispanic non-black, other), education (proxy variable for socioeconomic status (SES), less than high school, completed high school or vocational school, college degree), current smoking status, obesity, dia-betes, depression, season, and median household income of the census tract. Covariates were included based upon previous, known associations with either air pollution exposures or ED. Results for all models are expressed as the odds ratios (ORs) of having ED per interquartile range (IQR) increase in ambient air pollution exposure.
Due to missingness in ED, BMI, and diabetes (39.6% missing incident ED outcome in Wave 1 and 13.6% out-come missing in Wave 2, 5.1% missing BMI in both waves, and 0.6% missingness for diabetes in both waves), we used multiple imputation to impute missing data. We did so using the fully conditional specification (FCS) algorithm with 100 imputed datasets created given the logistic model and binary data used in the model [25]. Variables used in imputation included the outcome of incident ED, any factors relating to ED (CRP, ability to walk across a room, antiandrogens, and beta blockers) as well as all covariates included in the model. Imputation resulted in a data set containing all men who partici-pated in both waves (n= 1068).
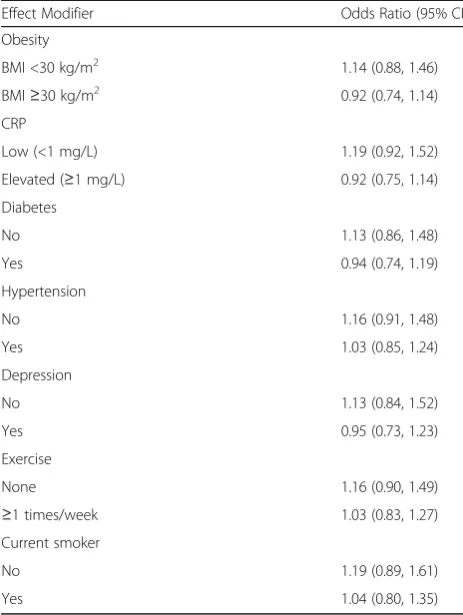
We examined effect modification of the association between PM2.5and incident ED by including separate
in-teractions between PM2.5and obesity, hypertension,
dia-betes, CRP, exercise (as less or greater than once each week), current smoking, and depression. These potential modifiers were selected based on previous scientific findings for air pollution and cardiovascular disease. All effect modification analyses were performed for 4 year moving average PM2.5exposures since it was the interval
with the strongest observed effect estimate.
explore the relation of air pollution to ED prevalence while treating ED as a reversible outcome [26], we in-cluded all cases of ED (n= 746) in generalized mixed models with random intercepts, rather than just incident cases of ED. As before, models included adjustments for age, race/ethnicity, education, year, season, current smoking, obesity, diabetes, depression, median house-hold income, and region. Similar to our primary ana-lyses, additional covariates were selected based on previous scientific findings to investigate effect modifica-tion. Finally, complete case analyses were undertaken to examine the potential effects of imputation.
All statistical analyses were conducted using SAS version 9.4 software (SAS Institute Inc., Cary, North Carolina). Statistical significance is reported at the two--sided 0.05 level.
Results
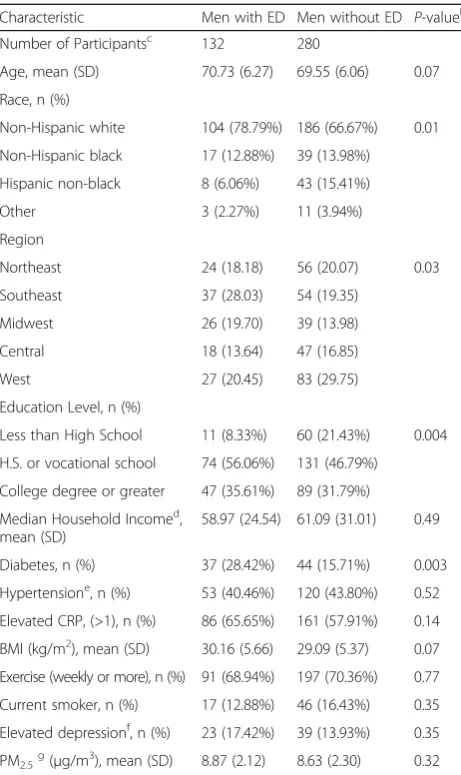
In Wave 2, 132 men answered yes for the first time to either having ED (129 men) or to ED medication use (10 men total, 3 men with medication usage alone), with these men defined as incident ED cases for our study period (Table 1). The number of incident ED cases was small relative to the number of men reporting ED in Wave 1, for which 331 men reported having ED and 29 reported being on ED medication. Over both waves, 280 men did not report developing ED and were the com-parison group in our main analysis (Table 1). The major-ity of men with incident ED were non-Hispanic White (78.79%), with the average age of 70.3 years. Compared to men without ED, those with ED were more likely to be non-Hispanic Whites, have higher education levels, and be obese. Other demographic characteristics of men with and without ED were similar. One year mean mov-ing averages for PM2.5 during Wave 2 were 8.9 μg/m3
(±2.1) for men with ED and 8.6 μg/m3 (±2.3) for men without ED. A comparison of men with and without data for prevalent ED (provided in Additional file 1: Table S1) showed that, depending on the wave, men dif-fered significantly in the distribution of major risk factors for ED including age, education, diabetes status, obesity rates, depression and stress.
Table 2 presents the associations between incident ED and moving average PM2.5 exposures over 1 to 7 years
prior to the interview date for both base and adjusted models for imputed data. An IQR increase in 1 year moving average PM2.5exposure (3.25μg/m3) was
associ-ated with a 1.16 (95% CI: 0.87, 1.55) times higher odds of developing ED, with similar results for an IQR increase in the 7 year moving average exposure (3.10μg/ m3, OR = 1.16 (95% CI, 0.92, 1.46)). The association be-tween PM2.5 and ED was not significantly modified by
adverse health conditions, such as being obese or having elevated CRP, diabetes, hypertension, depression, or by
behaviors such as current smoking or exercise (Table 3), although the estimated ORs were consistently higher for individuals without adverse health conditions.
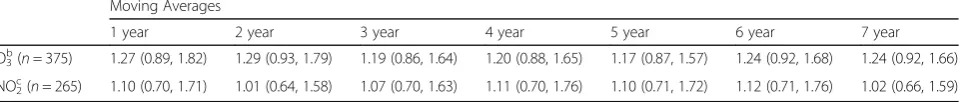
As for PM2.5 exposures, 1–7 year moving averages of
O3 and NO2 exposures were positively associated with
odds of having incident ED, although associations did not reach nominal statistical significance (Table 4). ORs increased with longer moving averages, with the largest odds ratio for O3and incident ED observed for an IQR
increase in exposures averaged over 2 years (OR = 1.29, 95% CI, 0.93, 1.79).
Analyses conducted using different definitions of ED and geographic regions as well as restricting analyses to men who did not have residential moves between waves showed qualitatively comparable results. For example, including only those men who answered yes to the ED question as men with incident ED (n= 129), in adjusted models we found PM2.5-associated ORs ranging from
1.10 (95% CI, 0.75, 1.62) for an IQR increase in the 1 year moving average exposure to 1.12 (95% CI, 0.82, 1.52) for an IQR increase in the 7 year moving average exposure. Analyses of all ED cases from both waves, assuming ED is a reversible outcome, showed no statistically signifi-cant association with pollutant exposures. For example, the OR associated with IQR increases in PM2.5 7 year
moving average exposures was 1.06 (95% CI, 0.86, 1.30, Additional file 1: Table S2).
Analyses restricted to complete cases (Additional File 1: Table S3), had similar results to imputed data (Table 2) but with slightly lower estimates. An IQR increase in 1 year moving average PM2.5exposure was associated with a 1.11
(95% CI: 0.76, 1.61) times higher odds of developing ED, while an IQR increase in 7 year moving average PM2.5
exposure was associated with a 1.14 (95% CI: 0.84, 1.54) times higher odds of developing ED.
Discussion
In our nationally representative study of older men, we found that the odds of developing ED were higher but did not reach nominal statistical significance for IQR increases in PM2.5exposures, with the 4 year moving average
expos-ure having the highest odds ratio (1.17, 95% CI: 0.91, 1.50). The observed associations between recent long-term average PM2.5 level and ED were not significantly
modified by any of the examined risk factors for ED. This study is the first to investigate the association between incident ED and exposure to ambient air pollu-tion. Although not statistically significant, we found PM2.5 exposures to be consistently associated with
power to detect associations in the range of the observed estimates.
Support for the hypothesis that ambient air pollution may impact ED incidence is provided by epidemiologic studies of cardiovascular outcomes, which have consist-ently linked long-term PM2.5 exposure to vascular and
endothelial dysfunction, biological pathways that have
been linked to both ED and cardiovascular disease [27]. For example, a number of studies have found significant associations between ambient PM2.5 and various
mea-sures of cardiovascular disease, including increased blood pressure [28–30], stroke [31], brachial artery reactivity to shear stress [15, 32], and atherosclerosis [33–35]. Similarly, PM2.5 has also been shown to result
in endothelial dysfunction [36] and oxidative stress [37] as assessed by measurements of the associated proteins Tumor Necrosis Factor-alpha (TNF-α), intercellular ad-hesion molecules (iCAM), and vascular cell adad-hesion molecules (vCAM). In contrast to our findings, factors, such as BMI [38] and diabetes [15] have been shown to modify PM2.5impacts on cardiovascular outcomes;
how-ever, our relatively small number of ED cases also likely limited our ability to detect the presence of any effect modification.
It is biologically plausible that exposure to PM2.5 can
lead to ED. Exposure to PM2.5 is associated with
oxida-tive stress and inflammation [36, 37], endothelial dys-function [11], and atherosclerosis [33–35], potentially causing ED of vascular origin through both arteriogenic and veno-occlusive pathways [39]. Endothelial dysfunc-tion and atherosclerosis, which are both strongly associ-ated with ED, lead to damage in the arteries, reducing blood flow to the penis [40]. Also, in erection biology, oxidative stress and endothelial dysfunction cause a re-duction in endothelial nitric oxide (NO) prore-duction, leading to an increase in smooth muscle tone, impair-ment of vasodilation, and impairimpair-ment of the ability to achieve an erection [9, 41]. Additional support comes from animal models, where PM2.5 was shown to
decrease NO bioavailability, which is required for penile erection [42].
Our findings that longer averages of 1 to 7 years are associated with ED are supported by studies that show higher risks for cardiovascular disease increases with longer PM2.5 exposure windows [43]. Implications of
these findings are that adverse vascular effects of expos-ure to PM2.5 are cumulative over time, progressively
leading to changes that manifest in a variety of vascular disorders, including ED. It is also interesting to note that we found lower, but still non-statistically significant associations between exposure to PM2.5 and prevalent
cases of ED, possibly due to the fact that prevalent cases of ED may have been present for many years and are not related to the recent exposure windows used in this study.
Our study has some potential limitations that warrant discussion. First, the number of men with incident ED (132) was relatively small. The number of men with inci-dent ED may have been underestimated in Wave 1 given that men were not asked about ED if they had no recent sexual activity, possibly due to being impotent. This Table 1Characteristics of NSHAP Male Participants Included in
the Incident ED Studya
Characteristic Men with ED Men without ED P-valueb
Number of Participantsc 132 280
Age, mean (SD) 70.73 (6.27) 69.55 (6.06) 0.07
Race, n (%)
Non-Hispanic white 104 (78.79%) 186 (66.67%) 0.01
Non-Hispanic black 17 (12.88%) 39 (13.98%)
Hispanic non-black 8 (6.06%) 43 (15.41%)
Other 3 (2.27%) 11 (3.94%)
Region
Northeast 24 (18.18) 56 (20.07) 0.03
Southeast 37 (28.03) 54 (19.35)
Midwest 26 (19.70) 39 (13.98)
Central 18 (13.64) 47 (16.85)
West 27 (20.45) 83 (29.75)
Education Level, n (%)
Less than High School 11 (8.33%) 60 (21.43%) 0.004
H.S. or vocational school 74 (56.06%) 131 (46.79%)
College degree or greater 47 (35.61%) 89 (31.79%)
Median Household Incomed, mean (SD)
58.97 (24.54) 61.09 (31.01) 0.49
Diabetes, n (%) 37 (28.42%) 44 (15.71%) 0.003
Hypertensione, n (%) 53 (40.46%) 120 (43.80%) 0.52
Elevated CRP, (>1), n (%) 86 (65.65%) 161 (57.91%) 0.14
BMI (kg/m2), mean (SD) 30.16 (5.66) 29.09 (5.37) 0.07
Exercise (weekly or more), n (%) 91 (68.94%) 197 (70.36%) 0.77
Current smoker, n (%) 17 (12.88%) 46 (16.43%) 0.35
Elevated depressionf, n (%) 23 (17.42%) 39 (13.93%) 0.35
PM2.5g(μg/m3), mean (SD) 8.87 (2.12) 8.63 (2.30) 0.32 a
Statistics are given for male participants from ED analysis, results are given as n (%) or mean (SD)
bp
values calculated for difference between groups using chi-square tests for categorical variables andt-test for difference in means
c
Men with ED are defined as subjects replying yes to ED question (129) or reporting ED medication usage (10) in Wave 2 and not Wave 1 (7 men replied yes to both); Men without ED are subjects who replied no to ED question and ED medication use in both waves
d
Median household income is from census tract of each participant, results given in thousands of dollars
e
>90 mmHg diastolic and/or >140 mmHg systolic averaged from 2 or 3 blood pressure measurements
f
Elevated depression defined as a score of 9 or greater on the CESD-11 g
potential outcome misclassification, if any, is likely small, given that multiple imputation was performed to predict incident ED status for men without ED data (39.6% in Wave 1 and 13.6% in Wave 2), with similar results to using non-imputed data. Importantly, selection bias was also unlikely, given that pollutant exposures and charac-teristics of men with and without ED information were similar across both data collection waves (Additional File 1: Table S1). Second, exposures were estimated using spatio-temporal models created from ambient monitor measurements that are imperfect measures of personal exposures to ambient air pollution. However, our exposure assessment method minimized exposure error resulting from spatial variation in PM2.5
concen-trations, as the distance of the grid point estimates to residential addresses were minimal and substantially less than would otherwise occur if more traditional closest stationary ambient monitor concentrations were used to assess exposures. Any remaining exposure error would likely bias our odds ratios towards the null, as shown by previous studies that show that chronic health risks are underestimated using nearest monitor ex-posures [44–46]. Third, ED status was ascertained using self-reports of ED and medication use, which may result in outcome misclassification, likely biasing our results to-wards the null given its independence with pollutant ex-posures and given our binary outcome. The study would be improved by confirming ED status with clinical diagno-sis. Fourth, the NSHAP study consisted of community
dwelling older adults, limiting its generalizability to youn-ger men and institutionalized men. Lastly, there are a number of confounding variables that could be included in future studies that were not available for all participants in this study, resulting in potential residual confounding. Examples include an improved measure of individual SES (beyond our use of education as an SES proxy), given its association with both higher pollutant levels [47] and ED [3], and more comprehensive information on medication usage and underlying health conditions related to ED.
Important strengths of this study include our NSHAP population, which is nationally representative of older adults. In this study, we analyzed the impacts of PM2.5
on incident ED controlling for key participant-specific demographic characteristics and accounting for medica-tion use. This comprehensive characterizamedica-tion of each participant allowed us to control for potential con-founders and to investigate the possibility of effect modi-fication on a participant specific basis. The longitudinal nature of participant data also allowed us to capture newly developed cases of ED and analyze the impact of ambient air pollution on incident ED. Additionally, we assessed PM2.5 exposures for each participant using
Geographic Information System (GIS) based spatio-temporal models, which reduced exposure error in our exposure estimates. Importantly, our findings were robust to our method of analysis, with results from sev-eral sensitivity analyses being qualitatively similar to those for our main analysis.
Table 4ORs (95% CIs) for Incident ED per IQR Increment of O3and NO2 a
Moving Averages
1 year 2 year 3 year 4 year 5 year 6 year 7 year
O3b(n= 375) 1.27 (0.89, 1.82) 1.29 (0.93, 1.79) 1.19 (0.86, 1.64) 1.20 (0.88, 1.65) 1.17 (0.87, 1.57) 1.24 (0.92, 1.68) 1.24 (0.92, 1.66)
NO2c(n= 265) 1.10 (0.70, 1.71) 1.01 (0.64, 1.58) 1.07 (0.70, 1.63) 1.11 (0.70, 1.76) 1.10 (0.71, 1.72) 1.12 (0.71, 1.76) 1.02 (0.66, 1.59)
a
Incident ED is defined as either replying yes to ED question or reporting ED medication use in Wave 2 but not in Wave 1; 125 men had incident ED with O3data available and 84 men had incident ED with NO2data available; results given are ORs (95% Confidence Intervals); Logistic regression models include adjustment for age, geographic region (West, Midwest, Central, South, Northeast), ethnic group, education (<H.S., H.S., College), current smoking status, obesity (BMI≥30), diabetes, depression, season, and median household income
b
Summer (April-Sept) only, 1 year IQR = 8.21 ppb, 2 years IQR = 7.17 ppb, 3 years IQR = 7.13 ppb, 4 years IQR = 7.16 ppb, 5 years IQR = 6.77 ppb, 6 years IQR = 6.96 ppb, 7 years IQR = 6.81 ppb
c
1 year IQR = 7.49 ppb, 2 years IQR = 7.35 ppb, 3 years IQR =7.18 ppb, 4 years IQR = 7.82 ppb, 5 years IQR = 7.57 ppb, 6 years IQR = 7.80 ppb, 7 years IQR = 7.81 ppb
Table 2ORs (95% CIs) for Incident ED per IQR Increase in PM2.5 a
PM2.5Moving Average b
1 year 2 year 3 year 4 year 5 year 6 year 7 year
Base Modelc 1.08 (0.84, 1.40) 1.07 (0.84, 1.36) 1.08 (0.85, 1.35) 1.09 (0.87, 1.36) 1.08 (0.88, 1.34) 1.08 (0.88, 1.34) 1.08 (0.88, 1.32)
Adjusted Modeld 1.16 (0.87, 1.55) 1.16 (0.89, 1.53) 1.17 (0.90, 1.52) 1.17 (0.91, 1.50) 1.16 (0.91, 1.48) 1.16 (0.92, 1.47) 1.16 (0.92, 1.46)
a
Incident ED is defined as either replying yes to ED question or reported ED medication usage in Wave 2 but not in Wave 1, multiple imputation using FCS algorithm run 100 times, results given are mean ORs (95% Confidence Intervals)
b
PM2.51 year IQR = 3.25μg/m 3
, 2 years IQR =3.12μg/m3, 3 years IQR = 3.18μg/m3, 4 years IQR = 3.12μg/m3, 5 years IQR =3.10μg/m3, 6 years IQR = 3.15μg/m3, 7 years IQR = 3.10μg/m3
c
Logistic regression models include adjustment for age and geographic region (West, Midwest, Central, South, Northeast) in base models d
Conclusions
In summary, we found positive associations between recent long-term ambient PM2.5 levels and ED that did
not reach nominal statistical significance. The associations were stronger for longer-term moving averages of expos-ure. Given that our study is the first to examine associa-tions between ambient air pollution and ED, further research investigating the association of PM2.5 and
inci-dent ED should be conducted using larger sample sizes. If the relationship between PM2.5 and incident ED does in
fact exist, limiting exposure to PM2.5 may decrease the
number of incident cases of ED in older men, a common condition that affects an increasing number of men.
Additional file
Additional file 1:Erectile Dysfunction and Exposure to Ambient Air Pollution in a Nationally Representative Cohort of Older Men.Table S1. Wave-Specific Comparison of NSHAP Male Participants with and without Available ED Data.Table S2.ORs (95% CIs) for Prevalent ED per IQR
Increase in PM2.5.Table S3.ORs (95% CIs) for Incident ED per IQR
Increase in PM2.5: Complete Case Analysis. (DOCX 35 kb)
Abbreviations
BMI:Body mass index; CESD: Center for epidemiological studies depression scale; CRP: C-reactive protein; ED: Erectile dysfunction; EPA: Environmental protection agency; GAMMs: Generalized additive mixed models;
GIS: Geographic information systems; iCAM: Intercellular adhesion molecules; IMPROVE: Interagency monitoring of protected visual environments; IQR: Interquartile range; NO: Nitric oxide; NO2: Nitrogen dioxide; O3: Ozone;
OR: Odds ratio; PM2.5: Particulate matter with aerodynamic diameters ≤2.5μm; SES: Socioeconomic status; TNF-α: Tumor necrosis factor-alpha; vCAM: Vascular cell adhesion molecules
Acknowledgements
We thank Dr. Jeffrey Yanosky from the Pennsylvania State University for providing daily PM2.5grid data.
Funding
This work was funded by NIEHS grant 1R01ES022657-01A1. Development of PM2.5GIS-based spatio-temporal models was supported by National Institutes
of Health grant #1 R01 ES019168. NSHAP is supported by the National Institutes of Health, including the National Institute on Aging (R37AG030481; R01AG033903), the Office of Women’s Health Research, the Office of AIDS Research, and the Office of Behavioral and Social Sciences Research (R01AG021487), and by NORC which was responsible for the data collection.
Availability of data and materials
The data that support the findings of this study are available on request from the corresponding author HS. The data are not publicly available due to containing individually identifiable information that could compromise research participant privacy.
Authors’contributions
LT analyzed and interpreted the participant and pollutant data and wrote the manuscript. JM advised on the data analysis and writing of the manuscript. VP prepared the pollutant data and advised on data analysis. MM, MK, and BC advised on the study design, data analysis, and manuscript. HS also advised on the study design and data analysis, provided critical revision of the manuscript for important intellectual content, and obtained funding support. All authors read and approved the final manuscript.
Competing interests
The authors declare that they have no competing interests.
Consent for publication Not applicable.
Ethics approval and consent to participate
The protocol was approved by the Institutional Review Boards of Northeastern University, the University of Chicago and NORC at the University of Chicago. All respondents provided written informed consent.
Author details
1Department of Health Sciences, Northeastern University, 360 Huntington
Avenue, Boston, MA 02115, USA.2MCPHS University, 179 Longwood Avenue, Boston, MA 02115, USA.3Department of Epidemiology, Harvard T.H. Chan School of Public Health, 677 Huntington Ave., Boston, MA 02115, USA. 4Department of Environmental Health Sciences, Columbia University
Mailman School of Public Health, 722 W. 168th Street, #1105C, New York, NY 10032, USA.5Department of Biostatistics, Harvard T.H. Chan School of Public Health, 677 Huntington Ave., Boston, MA 02115, USA.6Department of Civil and Environmental Engineering, Tufts University, 200 College Avenue, 301 Anderson Hall, Medford, MA 02155, USA.
Table 3Effect Modification of the 4 Year Moving Average PM2.5-Incident ED Associationa
Effect Modifier Odds Ratio (95% CI)
Obesity
BMI <30 kg/m2 1.14 (0.88, 1.46)
BMI≥30 kg/m2 0.92 (0.74, 1.14)
CRP
Low (<1 mg/L) 1.19 (0.92, 1.52)
Elevated (≥1 mg/L) 0.92 (0.75, 1.14)
Diabetes
No 1.13 (0.86, 1.48)
Yes 0.94 (0.74, 1.19)
Hypertension
No 1.16 (0.91, 1.48)
Yes 1.03 (0.85, 1.24)
Depression
No 1.13 (0.84, 1.52)
Yes 0.95 (0.73, 1.23)
Exercise
None 1.16 (0.90, 1.49)
≥1 times/week 1.03 (0.83, 1.27)
Current smoker
No 1.19 (0.89, 1.61)
Yes 1.04 (0.80, 1.35)
a
Results for Wave 2 with imputed data; Incident ED is defined as men who either replied yes to ED question or reported ED medication usage in Wave 2; the comparison group of men without ED replied no to the ED question and ED medication use in both waves; logistic model includes adjustment for age, geographic region, ethnic group, education (<H.S., H.S., College), current smoking status, obesity, diabetes, depression, season, median household income; Reference group is PM2.54 year moving average exposures (IQR =3.12μg/m
Received: 5 August 2016 Accepted: 8 February 2017
References
1. National Institutes of Health: NIH Consensus Conference. Impotence. NIH consensus development panel on impotence. JAMA. 1993;270(1):83–90. 2. Feldman HA, Goldstein I, Hatzichristou DG, Krane RJ, McKinlay JB. Impotence
and its medical and psychosocial correlates: results of the Massachusetts male aging study. J Urol. 1994;151(1):54–61.
3. Johannes CB, Araujo AB, Feldman HA, Derby CA, Kleinman KP, McKINLAY JB. Incidence of erectile dysfunction in men 40 to 69 years old: longitudinal results from the Massachusetts male aging study. J Urol. 2000;163(2):460–3. 4. Aytac I, McKinlay J, Krane R. The likely worldwide increase in erectile
dysfunction between 1995 and 2025 and some possible policy consequences. BJU Int. 1999;84:50–6.
5. Hockenberry MS, Masson P. Erectile dysfunction in the elderly. Curr Geriatr Rep. 2015;4(1):33–43.
6. De Boer B, Bots M, Nijeholt A, Verheij TJ. The prevalence of bother, acceptance, and need for help in men with erectile dysfunction. J Sex Med. 2005;2(3):445–50.
7. Solomon H, Man JW, Jackson G. Erectile dysfunction and the cardiovascular patient: endothelial dysfunction is the common denominator. Heart. 2003;89(3):251–3.
8. Inman BA, Sauver JL, Jacobson DJ, McGree ME, Nehra A, Lieber MM, Roger VL, Jacobsen SJ. A population-based, longitudinal study of erectile dysfunction and future coronary artery disease. Mayo Clinic Proceedings. 2009;84(2):108–113.
9. Albersen M, Orabi H, Lue TF. Evaluation and treatment of erectile dysfunction in the aging male: a mini-review. Gerontology. 2012;58(1):3–14. 10. Elesber AA, Solomon H, Lennon RJ, Mathew V, Prasad A, Pumper G, Nelson RE, McConnell JP, Lerman LO, Lerman A. Coronary endothelial dysfunction is associated with erectile dysfunction and elevated asymmetric dimethylarginine in patients with early atherosclerosis. Eur Heart J. 2006;27(7):824–31.
11. Brook RD, Franklin B, Cascio W, Hong Y, Howard G, Lipsett M, Luepker R, Mittleman M, Samet J, Smith Jr SC, Tager I. Expert panel on population and prevention science of the american heart association: Air pollution and cardiovascular disease: a statement for healthcare professionals from the expert panel on population and prevention science of the american heart association. Circulation. 2004;109(21):2655–71.
12. Brook RD, Rajagopalan S, 3rd Pope CA, Brook JR, Bhatnagar A, Diez-Roux AV, Holguin F, Hong Y, Luepker RV, Mittleman MA, Peters A, Siscovick D, Smith Jr SC, Whitsel L, Kaufman JD, American Heart Association Council on Epidemiology and Prevention, Council on the Kidney in Cardiovascular Disease, and Council on Nutrition, Physical Activity and Metabolism. Particulate matter air pollution and cardiovascular disease: an update to the scientific statement from the american heart association. Circulation. 2010;121(21):2331–78.
13. 3rd Pope CA, Burnett RT, Thurston GD, Thun MJ, Calle EE, Krewski D, Godleski JJ. Cardiovascular mortality and long-term exposure to particulate air pollution: epidemiological evidence of general pathophysiological pathways of disease. Circulation. 2004;109(1):71–7.
14. Donaldson K, Tran CL. Inflammation caused by particles and fibers. Inhal Toxicol. 2002;14(1):5–27.
15. O’Neill MS, Veves A, Zanobetti A, Sarnat JA, Gold DR, Economides PA, Horton ES, Schwartz J. Diabetes enhances vulnerability to particulate air pollution-associated impairment in vascular reactivity and endothelial function. Circulation. 2005;111(22):2913–20.
16. O’Muircheartaigh C, Eckman S, Smith S. Statistical design and estimation for the national social life, health, and aging project. J Gerontol Ser B Psychol Sci Soc Sci. 2009;64B suppl 1:i12–9.
17. Keys A, Fidanza F, Karvonen MJ, Kimura N, Taylor HL. Indices of relative weight and obesity. J Chronic Dis. 1972;25(6):329–43.
18. Pickering TG, Hall JE, Appel LJ, Falkner BE, Graves J, Hill MN, Jones DW, Kurtz T, Sheps SG, Roccella EJ. Subcommittee of professional and public education of the american heart association council on high blood pressure research: recommendations for blood pressure measurement in humans and experimental animals: part 1: blood pressure measurement in humans: a statement for professionals from the subcommittee of professional and public education of the american heart association council on high blood pressure research. Hypertension. 2005;45(1):142–61.
19. Hansson L, Lindquist L. C-reactive protein: its role in the diagnosis and follow-up of infectious diseases. Curr Opin Infect Dis. 1997;10(3):196–201. 20. Kohout FJ, Berkman LF, Evans DA, Cornoni-Huntley J. Two shorter forms of
the CES-D (Center for Epidemiological Studies Depression) depression symptoms index. J Aging Health. 1993;5(2):179–93.
21. Harada N, Takeshita J, Ahmed I, Chen R, Petrovitch H, Ross GW, Masaki K. Does cultural assimilation influence prevalence and presentation of depressive symptoms in older Japanese American men? the Honolulu-Asia aging study. Am J Geriatr Psychiatry. 2012;20(4):337–45.
22. Yanosky JD, Paciorek CJ, Laden F, Hart JE, Puett RC, Liao D, Suh HH. Spatio-temporal modeling of particulate air pollution in the conterminous United States using geographic and meteorological predictors. Environ Health. 2014;13(1):63.
23. Environmental Protection Agency (EPA). :http://www.epa.gov/ttn/airs/ airsaqs/.(2009) Accessed 27 Dec 2015
24. Interagency Monitoring of Protected Visual Environments (IMPROVE). :http:// vista.cira.colostate.edu/improve/.(2013) Accessed 27 Dec 2015
25. Lee KJ, Carlin JB. Multiple imputation for missing data: fully conditional specification versus multivariate normal imputation. Am J Epidemiol. 2010; 171(5):624–32.
26. Keene LC, Davies PH. Drug-related erectile dysfunction. Adverse Drug React Toxicol Rev. 1999;18(1):5–24.
27. Bivalacqua TJ, Usta MF, Champion HC, Kadowitz PJ, Hellstrom WJ. Endothelial dysfunction in erectile dysfunction: role of the endothelium in erectile physiology and disease. J Androl. 2003;24(S6):S17–37.
28. Ibald-Mulli A, Stieber J, Wichmann HE, Koenig W, Peters A. Effects of air pollution on blood pressure: a population-based approach. Am J Public Health. 2001;91(4):571–7.
29. Zanobetti A, Canner MJ, Stone PH, Schwartz J, Sher D, Eagan-Bengston E, Gates KA, Hartley LH, Suh H, Gold DR. Ambient pollution and blood pressure in cardiac rehabilitation patients. Circulation. 2004;110(15):2184–9. 30. Diez Roux AV, Auchincloss AH, Dvonch JT, Brown PL, Barr RG, Daviglus ML, Goff Jr DC, Kaufman JD, O'Neill MS. Associations between recent exposure to ambient fine particulate matter and blood pressure in the Multi-Ethnic Study of Atherosclerosis. Environmental Health Perspectives. 2008;116(4): 486–91.
31. Wellenius GA, Schwartz J, Mittleman MA. Air pollution and hospital admissions for ischemic and hemorrhagic stroke among medicare beneficiaries. Stroke. 2005;36(12):2549–53.
32. Schneider A, Neas L, Herbst MC, Case M, Williams RW, Cascio W, Hinderliter A, Holguin F, Buse JB, Dungan K. Endothelial dysfunction: associations with exposure to ambient fine particles in diabetic individuals. Environ Health Perspect. 2008;116(12):1666–74.
33. Künzli N, Jerrett M, Garcia-Esteban R, Basagaña X, Beckermann B, Gilliland F, Medina M, Peters J, Hodis HN, Mack WJ. Ambient air pollution and the progression of atherosclerosis in adults. PLoS One. 2010;5(2):e9096. 34. Diez Roux AV, Auchincloss AH, Franklin TG, Raghunathan T, Barr RG,
Kaufman J, Astor B, Keeler J. Long-term exposure to ambient particulate matter and prevalence of subclinical atherosclerosis in the multi-ethnic study of atherosclerosis. Am J Epidemiol. 2008;167(6):667–75. 35. Kaufman JD, Adar SD, Barr RG, Budoff M, Burke GL, Curl CL, Daviglus ML,
Roux AVD, Gassett AJ, Jacobs DR: Association between air pollution and coronary artery calcification within six metropolitan areas in the USA (the Multi-Ethnic Study of Atherosclerosis and Air Pollution): a longitudinal cohort study. The Lancet. 2016;388(10045):696–704.
36. Brook RD, Brook JR, Urch B, Vincent R, Rajagopalan S, Silverman F. Inhalation of fine particulate air pollution and ozone causes acute arterial
vasoconstriction in healthy adults. Circulation. 2002;105(13):1534–6. 37. Bind MA, Baccarelli A, Zanobetti A, Tarantini L, Suh H, Vokonas P, Schwartz J.
Air pollution and markers of coagulation, inflammation, and endothelial function: associations and epigene-environment interactions in an elderly cohort. Epidemiology. 2012;23(2):332–40.
38. Zeka A, Sullivan JR, Vokonas PS, Sparrow D, Schwartz J. Inflammatory markers and particulate air pollution: characterizing the pathway to disease. Int J Epidemiol. 2006;35(5):1347–54.
39. Gillon G, Barnea O. Erection mechanism of the penis: a model based analysis. J Urol. 2002;168(6):2711–5.
40. Kloner RA, Speakman M. Erectile dysfunction and atherosclerosis. Curr Atheroscler Rep. 2002;4(5):397–401.
42. Nurkiewicz TR, Porter DW, Hubbs AF, Stone S, Chen BT, Frazer DG, Boegehold MA, Castranova V. Pulmonary nanoparticle exposure disrupts systemic microvascular nitric oxide signaling. Toxicol Sci.
2009;110(1):191–203.
43. Pope III CA, Dockery DW. Health effects of fine particulate air pollution: lines that connect. J Air Waste Manage Assoc. 2006;56(6):709–42.
44. Suh HH, Zanobetti A. Exposure error masks the relationship between traffic-related air pollution and heart rate variability. J Occup Environ Med. 2010;52(7):685–92.
45. Kioumourtzoglou M, Spiegelman D, Szpiro AA, Sheppard L, Kaufman JD, Yanosky JD, Williams R, Laden F, Hong B, Suh H. Exposure measurement error in PM2. 5 health effects studies: A pooled analysis of eight personal exposure validation studies. Environ Health. 2014;13(1):2.
46. Paciorek CJ, Yanosky JD, Puett RC, Laden F, Suh HH. Practical large-scale spatio-temporal modeling of particulate matter concentrations. The Annals of Applied Statistics. 2009;3(1):370–97.
47. Hajat A, Diez-Roux AV, Adar SD, Auchincloss AH, Lovasi GS, O’Neill MS, Sheppard L, Kaufman JD. Air pollution and individual and neighborhood socioeconomic status: evidence from the Multi-Ethnic Study of Atherosclerosis (MESA). Environ Health Perspect (Online). 2013;121(11–12): 1325.
• We accept pre-submission inquiries
• Our selector tool helps you to find the most relevant journal • We provide round the clock customer support
• Convenient online submission • Thorough peer review
• Inclusion in PubMed and all major indexing services • Maximum visibility for your research
Submit your manuscript at www.biomedcentral.com/submit