Biogeosciences, 10, 2761–2774, 2013 www.biogeosciences.net/10/2761/2013/ doi:10.5194/bg-10-2761-2013
© Author(s) 2013. CC Attribution 3.0 License.
EGU Journal Logos (RGB)
Advances in
Geosciences
Open Access
Natural Hazards
and Earth System
Sciences
Open Access
Annales
Geophysicae
Open Access
Nonlinear Processes
in Geophysics
Open Access
Atmospheric
Chemistry
and Physics
Open Access
Atmospheric
Chemistry
and Physics
Open Access
Discussions
Atmospheric
Measurement
Techniques
Open Access
Atmospheric
Measurement
Techniques
Open Access
Discussions
Biogeosciences
Open Access Open Access
Biogeosciences
Discussions
Climate
of the Past
Open Access Open Access
Climate
of the Past
Discussions
Earth System
Dynamics
Open Access Open Access
Earth System
Dynamics
Discussions
Geoscientific
Instrumentation
Methods and
Data Systems
Open Access
Geoscientific
Instrumentation
Methods and
Data Systems
Open Access
Discussions
Geoscientific
Model Development
Open Access Open Access
Geoscientific
Model Development
DiscussionsHydrology and
Earth System
Sciences
Open Access
Hydrology and
Earth System
Sciences
Open Access
Discussions
Ocean Science
Open Access Open Access
Ocean Science
DiscussionsSolid Earth
Open Access Open Access
Solid Earth
DiscussionsThe Cryosphere
Open Access Open Access
The Cryosphere
Discussions
Natural Hazards
and Earth System
Sciences
Open Access
Discussions
UV/PAR radiation and DOM properties in surface coastal waters of
the Canadian shelf of the Beaufort Sea during summer 2009
J. Para1, B. Charri`ere1, A. Matsuoka2,3, W. L. Miller4, J. F. Rontani1, and R. Semp´er´e1
1Aix-Marseille Universit´e, Mediterranean Institute of Oceanography (MIO), 13288, Marseille, Cedex 9, France; Universit´e du Sud Toulon-Var, MIO, 83957, La Garde cedex, CNRS/INSU, MIO UMR7294, France
2Laboratoire d’Oc´eanographie de Villefranche, Universit´e Pierre et Marie Curie (Paris 6)/ CNRS/INSU, B.P. 08, Port de la Darse, Villefranche-sur-Mer Cedex, 06230, France
3Takuvik Joint International Laboratory, Universit´e Laval (Canada) – CNRS (France), D´epartement de Biologie and Qu´ebec-Oc´ean, Universit´e Laval, Pavillon Alexandre-Vachon 1045, Avenue de la M´edecine, Local 2078, G1V 0A6, Canada
4UGAMI/UGA Marine Science, Athens, GA 30602, USA
Correspondence to: R. Semp´er´e (richard.sempere@univ-amu.fr)
Received: 2 October 2012 – Published in Biogeosciences Discuss.: 5 November 2012 Revised: 3 April 2013 – Accepted: 4 April 2013 – Published: 26 April 2013
Abstract. Surface waters from the Beaufort Sea in the Arctic Ocean were evaluated for dissolved organic carbon (DOC), and optical characteristics including UV (ultraviolet) radia-tion and PAR (photosynthetically active radiaradia-tion) diffuse at-tenuation (Kd), and chromophoric and fluorescent dissolved organic matter (CDOM and FDOM) as part of the MALINA field campaign (30 July to 27 August). Spectral absorption coefficients (aCDOM(350 nm) (m−1))were significantly cor-related to both diffuse attenuation coefficients (Kd)in the UV-A and UV-B and to DOC concentrations. This indicates CDOM as the dominant attenuator of both UV and PAR solar radiation and suggests its use as an optical proxy for DOC concentrations in this region. While the Mackenzie in-put is the main driver of CDOM dynamics in low salinity waters, locally, primary production can create significant in-creases in CDOM. Extrapolating CDOM to DOC relation-ships, we estimate that∼16 % of the DOC in the Macken-zie River does not absorb radiation at 350 nm. The dis-charges of DOC and its chromophoric subset (CDOM) by the Mackenzie River during the MALINA cruise are estimated as ∼0.22 TgC and 0.18 TgC, respectively. Three dissolved fluorescent components (C1–C3) were identified by fluores-cence excitation/emission matrix spectroscopy (EEMS) and parallel factor (PARAFAC) analysis. Our results showed an aquatic dissolved organic matter (DOM) component (C1), probably produced in the numerous lakes of the watershed,
that co-dominated with a terrestrial humic-like component (C2) in the Mackenzie Delta Sector. This aquatic DOM could partially explain the high CDOM spectral slopes observed in the Beaufort Sea.
1 Introduction
2762 J. Para et al.: UV/PAR radiation and DOM properties in surface coastal waters
Arctic rivers usually exhibit high organic matter content and low nutrient concentrations, especially for nitrogen and phos-phorus (Dittmar and Kattner, 2003). The DOM content in the Western Arctic region of the Beaufort Sea is strongly im-pacted by freshwater inputs from the Mackenzie River, which currently contributes the fourth-largest freshwater discharge to the Arctic (Gordeev, 2006) and is the dominant source of terrestrial DOM to this region. River discharge, approx-imately 330 km3yr−1varies from 4000 m3s−1during winter (from December to May) to about 25 000 m3s−1during sum-mer (from June to August) (e.g. O’Brien et al., 2006). The Mackenzie’s flux of dissolved organic carbon (DOC) to the coastal Beaufort Sea is estimated to be∼1.04–1.76 TgC per year (Raymond et al., 2007).
The chromophoric fraction of DOM (CDOM) that absorbs solar irradiation over a broad range of ultraviolet (UV) and visible wavelengths is also delivered by the Mackenzie River. During the spring freshet and ice break-up, this increased amount of terrestrial CDOM in coastal areas can have nu-merous biological, chemical and physical effects. The pres-ence of terrestrial CDOM decreases the euphotic depth for primary production, increases photo-oxidation (i.e. CO and CO2 production) and increases mineralization of terrestrial DOC by stimulation of heterotrophic bacteria through the photo-production of labile organic substrates (Osburn et al., 2009). The combination of low sunlight intensity due to high solar zenith angles, large variations in seasonal day length, the influence of sea ice cover on sunlight penetration in surface waters, plume dynamics of the Mackenzie, and the changing DOM photochemical and biological reactivity in relation to season (Emmerton et al., 2008) all create a com-plex and highly variable photochemical environment over the Canadian shelf (Johannessen and Miller, 2001; Osburn et al., 2009). Consequently, in this Arctic environment that is so susceptible to the forcings of future climate change, bet-ter knowledge of the source, composition and surface dis-tribution of CDOM, along with its effects on in situ optical characteristics, is crucial to better quantify the processes in-volved in the organic carbon cycle in surface waters and at the land/sea interface.
Here, we report the spatial distribution of CDOM optical properties, in-air and in-water sunlight optical characteris-tics, and their evolving patterns in surface coastal waters of the Canadian shelf of the Beaufort Sea during the summer of 2009. CDOM optical properties in sampled water, in com-bination with three-dimensional excitation/emission matrix spectroscopy (EEMS) and parallel factor (PARAFAC) anal-ysis, were also examined to (i) define CDOM spectral ab-sorbance features, (ii) identify and characterize the primary DOM fluorescent components and (iii) trace the correspond-ing spatial distributions of these signals in surface waters of the Canadian Arctic shelf.
2 Materials and methods
2.1 Study site and sample collection
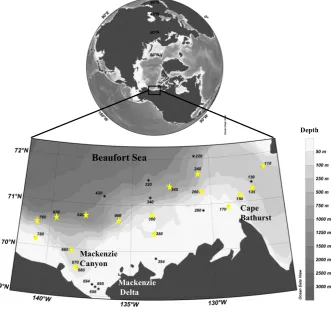
Hydrological samples were collected from surface waters at 27 stations over the Canadian shelf of the Beaufort Sea on-board the research ice-breaker CCGS Amundsen during the Mackenzie Light and Carbon (MALINA) cruise held from 30 July to 27 August 2009 (Fig. 1 and 2). During this open water study period, the Mackenzie discharge was approxi-mately 12 000 m3s−1(http://www.ec.gc.ca/rhc-wsc/) and the area investigated was characterized by an unusual ice cover extent and predominately overcast weather. According to the freshwater influence of the Mackenzie River estimated from the salinity (S), three different sectors were defined in-cluding Mackenzie Delta sector (S <15), North West sector (S <23) and North East sector (S >23). Samples were col-lected using Niskin bottles equipped with Teflon O-rings and silicon tubes to avoid chemical contamination. For fluores-cence determination, samples were directly transferred from the Niskin bottle through a Polycap AS 75 (Whatman®) 0.2 µm nylon filter membrane cartridge into precombusted (6 h at 450◦C) glass ampoules and stored at−20◦C in the dark until analyses. Polycap AS 75 were washed with HCL 5 %, then with 5 L of Milli-Q (Millipore®) water and finally rinsed with 4–5 L of sea water before sampling. A new Poly-cap AS 75 filter was used for each sample. The 0.2 µm filtra-tion avoids rupture of microbial cells during the freeze–thaw cycle and thus minimized changes in fluorescence proper-ties due to storage (Yamashita et al., 2010). However, la-bile protein-like materials could be degraded during stor-age, thus protein-like C3 fluorophore will not be discussed in this article. For CDOM, samples were transferred from Niskin bottles into 10 % HCl-washed and precombusted (6 h at 450◦C) glass bottles covered with aluminium foil and di-rectly filtered in dim light using 0.2 µm GHP filters (Acrodisc Inc.) pre-rinsed with 200 mL of Milli-Q water. DOC samples were sampled online with the Niskin bottle using a Milli-pore Swinnex-47 cartridge holder equipped with a precom-busted (6 h at 450◦C) 0.7 µm GF/F filters, which had been pre-rinsed with Milli-Q water and with samples. Ampoules were immediately acidified with 85 % H3PO4 (final pH 2) and flame sealed. During sampling, in situ hydrological con-text (temperature and salinity vs. depth) was determined with a SeaBird Electronics 911 CTD profiler (Table 1).
2.2 Radiometric measurements
J. Para et al.: UV/PAR radiation and DOM properties in surface coastal waters 2763
32
707 708
709
Figure 1. Location and station number investigated during the MALINAcruise in the
710
Canadian Shelf of the Beaufort Sea. Yellow stars represent the stations where profiles of 711
downward irradiance were performed.
712
713
714
715
716
717
Depth
Mackenzie Delta
Cape Bathurst
Beaufort Sea
[image:3.595.134.466.67.376.2]Mackenzie Canyon
Fig. 1. Locations and station numbers investigated during the MALINA cruise over the Canadian shelf of the Beaufort Sea. Yellow stars
represent the stations where profiles of downward irradiance were performed.
et al., 2007). Surface irradiance (Es(λ)in µW cm−2nm−1) was simultaneously measured at the same wavebands on the ship’s roof with matching OCR-504 sensors to account for variations in the sky conditions during the cast as well as to monitor UV and PAR solar irradiance during the day. For both the in-water and in-air OCR-504 sensors, the full width at half maximum (FWHM) was 2 nm for the 305, 325 and 340 nm channels and 10 nm for the PAR channels. The MicroPro® free-fall profiler, equipped with pressure, tem-perature and tilt sensors, was deployed from the front of the ship and profiled ∼50 m away to minimize shadowing ef-fects and disturbances.
Each cast was accompanied by a measurement of the dark current (instrument on deck) and a pressure tare (instrument at sea surface). To obtain as many valid measurements as pos-sible (i.e. tilt<5◦), the profiler was nose ballasted to provide a descent rate of∼70 cm s−1at a sampling rate of 7 Hz (i.e. sampling resolution of 10 cm). Measurements were logged using Satlantic’s Satview® 2.6 software. This allowed for initial data processing, such as channel integration for PAR calculations, radiometric calibration, dark correction, pres-sure tare application and the removal of data with tilt>5◦. Satview®’s data interpolation option was not used, choosing
rather to work with the raw radiometric data for Kd calcu-lations. Profiles of downwelling irradiance in the total PAR range were calculated by Prosoft Satlantic software from the four PAR channels.
The diffuse attenuation coefficients for downwelling UV ra-diation and PAR irradiances (Kd(λ)m−1)were calculated, assuming a homogeneous surface mixed layer, as the slope of the best-fit linear regression for the log-transformed down-welling irradiance data vs. depth relationship defined by the following equation:
Ed(z, λ)=Ed 0−, λexp(−Kd(λ)
z
). (1)
Ed(0−, λ), the downwelling irradiance just beneath the sea surface, was computed from above-water deck irradiance measurements,Ed(0+,λ), using the theoretical relationship defined by Smith and Baker (1984):
Ed 0−, λ=
Ed 0+, λ
/ (1+α) , (2)
2764 J. Para et al.: UV/PAR radiation and DOM properties in surface coastal waters
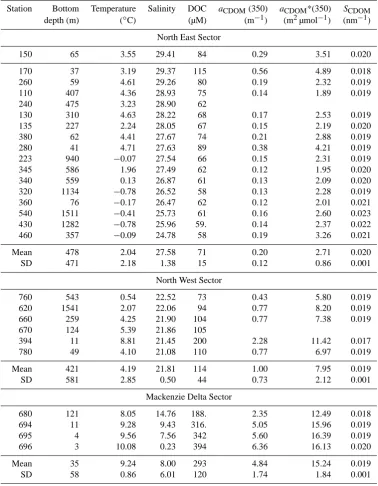
Table 1. Bottom depth, temperature, salinity, DOC and absorbance properties, including CDOM absorption coefficient, specific absorption
coefficient at 350 nm (aCDOM*(350)) and the spectral slope determined in surface waters of each sampling station and among the different
sectors investigated (i.e. North East, North West and Mackenzie Delta sectors) observed.
Station Bottom Temperature Salinity DOC aCDOM(350) aCDOM*(350) SCDOM
depth (m) (◦C) (µM) (m−1) (m2µmol−1) (nm−1)
North East Sector
150 65 3.55 29.41 84 0.29 3.51 0.020 170 37 3.19 29.37 115 0.56 4.89 0.018 260 59 4.61 29.26 80 0.19 2.32 0.019 110 407 4.36 28.93 75 0.14 1.89 0.019 240 475 3.23 28.90 62
130 310 4.63 28.22 68 0.17 2.53 0.019 135 227 2.24 28.05 67 0.15 2.19 0.020 380 62 4.41 27.67 74 0.21 2.88 0.019 280 41 4.71 27.63 89 0.38 4.21 0.019 223 940 −0.07 27.54 66 0.15 2.31 0.019 345 586 1.96 27.49 62 0.12 1.95 0.020 340 559 0.13 26.87 61 0.13 2.09 0.020 320 1134 −0.78 26.52 58 0.13 2.28 0.019 360 76 −0.17 26.47 62 0.12 2.01 0.021 540 1511 −0.41 25.73 61 0.16 2.60 0.023 430 1282 −0.78 25.96 59. 0.14 2.37 0.022 460 357 −0.09 24.78 58 0.19 3.26 0.021 Mean 478 2.04 27.58 71 0.20 2.71 0.020 SD 471 2.18 1.38 15 0.12 0.86 0.001
North West Sector
760 543 0.54 22.52 73 0.43 5.80 0.019 620 1541 2.07 22.06 94 0.77 8.20 0.019 660 259 4.25 21.90 104 0.77 7.38 0.019 670 124 5.39 21.86 105
394 11 8.81 21.45 200 2.28 11.42 0.017 780 49 4.10 21.08 110 0.77 6.97 0.019 Mean 421 4.19 21.81 114 1.00 7.95 0.019 SD 581 2.85 0.50 44 0.73 2.12 0.001
Mackenzie Delta Sector
680 121 8.05 14.76 188. 2.35 12.49 0.018 694 11 9.28 9.43 316. 5.05 15.96 0.019 695 4 9.56 7.56 342 5.60 16.39 0.019 696 3 10.08 0.23 394 6.36 16.13 0.020 Mean 35 9.24 8.00 293 4.84 15.24 0.019 SD 58 0.86 6.01 120 1.74 1.84 0.001
in the UV range, anyKd(λ)value that was lower than those at longer wavelengths was deleted. Values ofKd(λ)at 305 nm were particularly prone to error. The mean variability (CV %) ofKd(UV) andKd(PAR) determined between duplicate pro-files was within 3 %.
2.3 DOC analysis
The Shimadzu instrument used in this study is the commer-cially available model TOC-5000 Total Organic Carbon An-alyzer with a quartz combustion column filled with 1.2 % Pt on silica pillows with modifications previously described in Sohrin and Semp´er´e (2005).
J. Para et al.: UV/PAR radiation and DOM properties in surface coastal waters 2765
33
718
719
720
[image:5.595.53.285.64.190.2]721
Figure 2. Map of the sea surface salinity illustrating the different surface salinity sectors 722
observed during the study: Mackenzie Delta Sector (salinity < 15), North West Sector (15 < 723
salinity < 25) and North East Sector (salinity > 25). Isohalines 15 and 25 mark the boundaries
724
of these sectors.
725
726
727
728
729
730
731
25
North East Sector
North West Sector
Mackenzie Delta Sector
SEA SURFACE SALINITY SECTORS
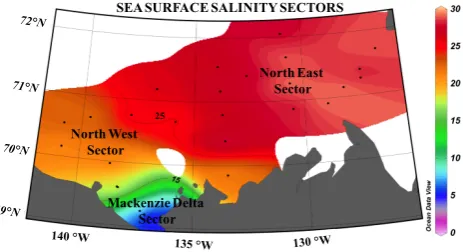
Fig. 2. Map of the sea surface salinity illustrating the different
sur-face salinity sectors observed during the study: Mackenzie Delta Sector (salinity<15), North West Sector (15<salinity<25) and North East Sector (salinity>25). Isohalines 15 and 25 mark the boundaries of these sectors.
hydrogen phthalate diluted in Milli-Q water and acidified with H3PO4 (range 0–400 µMC, five points) prepared just before sample analysis as a standard. The running blank was determined as the average of the peak area of the Milli-Q wa-ter acidified with H3PO4. The DOC concentrations were de-termined by subtracting the running blank from the average peak area of the samples (n=4 or 5) and dividing the result by the slope of the calibration curve. The acidified Milli-Q water was injected in triplicate after every 4 samples. The measurement accuracy and the system blank of our instru-ment were determined by the analysis of seawater reference material (D. Hansell, Rosenstiel School of Marine and At-mospheric Science, Miami, USA), including Deep Atlantic Water (DAW) and Low Carbon Water (LCW) reference stan-dards. The average DOC concentrations in the DAW and in the LCW reference standards were 45±2 µM C (n =24) and 1±0.3 µM C (n=24), respectively. Carbon levels in the LCW ampoules were similar to and often higher than the Milli-Q water produced in our laboratory. The nominal an-alytical precision for the procedure was 2 % or less.
2.4 CDOM optical properties
2.4.1 Absorbance measurements
After collection and filtration of the samples, CDOM ab-sorbance (280–700 nm) was measured onboard (within 24 h) using a multiple pathlength, liquid core UltraPath waveguide system (MPLCW; WPI Inc.). The detailed methodology for determining light absorbance of CDOM (280–735 nm) using this system is documented in Matsuoka et al. (2012) (this is-sue). Spectral absorption coefficients,aCDOM(λ)(m−1)were obtained using the following relationship:
aCDOM(λ)=2.303A(λ)/L, (3)
where A(λ)(dimensionless) is the absorbance at wavelength
λ(nm) andL is the pathlength in meters. The value of the
spectral slope coefficient for the CDOM spectrum (SCDOM) was determined by fitting a non-linear exponential regression to the originalaCDOM(λ)data over the 350–500 nm spectral range (Stedmon et al., 2000; Babin et al., 2003; Matsuoka et al., 2011, 2012). TheaCDOM(λ)at 350 nm (aCDOM(350)) was used as a proxy for the absorbent DOC. The specific ab-sorption coefficient at 350 nm,aCDOM*(350), was calculated asaCDOM(350)/DOC (m2µMC−1)to estimate the efficiency with which DOC absorbs UV radiation and is used in this study to provide insight on the origin and types of CDOM in the Beaufort Sea.
2.4.2 Fluorescence measurements
For fluorescence measurements, samples were stored in the dark at −20◦C, transported frozen to the MIO laboratory,
and analyzed within 3 months of sampling. Thawed sam-ples were transferred to a 1 cm pathlength far UV silica quartz cuvette (170–2600 nm; LEADER LAB), thermostated at 4◦C and analyzed with a Hitachi (Japan) Model F-7000 spectrofluorometer. Instrument settings, measurement proto-col and spectral correction procedures are fully described in Tedetti et al. (2010) and Para et al. (2011). Briefly, the spec-tral correction for the instrumental response was conducted according to the procedure recommended by Hitachi (Hitachi F-7000 Instruction Manual). First, the excitation (Ex) instru-mental response was obtained by using a rhodamine B stan-dard and a single-side frosted red filter in the Ex scan mode. The emission (Em) calibration was performed with a diffuser in synchronous scan mode. The Ex and Em spectra obtained over the range 240–550 nm were applied internally as the in-strument blank to correct subsequent spectra.
EEM spectra were generated using Ex wavelengths from 240 to 550 nm (5 nm intervals), Em wavelengths from 300 to 550 nm (2 nm intervals), a scan speed of 2400 nm min−1 and 5 nm bandwidths (full width at half maximum; FWHM) for both Ex and Em. Milli-Q water was analyzed to nor-malize all fluorescence data (blanks, standards, samples) to be normalized to the intensity of the Raman scatter peak at Ex/Em: 275/303 nm (5 nm bandwidths) (Coble et al., 1993; Coble, 1996; Belzile et al., 2006). Solutions of quinine sul-fate (Fluka) in 0.05 M H2SO4(1–10 ppb) were also analyzed and fluorescent dissolved organic matter (FDOM) data were converted into quinine sulfate units (QSU) to further normal-ize fluorescence results and to allow comparison to previ-ously published work.
2766 J. Para et al.: UV/PAR radiation and DOM properties in surface coastal waters
34
732
733
734
Figure 3. Diffuse attenuation coefficient of light for Kdat 325nm as a function of surface 735
salinity in the North East (circles) and North West (squares) sectors. Station 170 was
736
characterized by high DOC (115µM), Chlorophyll a (1.72µg l-1), primary productivity(37.9
737
mgC m-3d-1) and a
CDOM(350) (0.56 m-1) content. Similar pattern was observed for 340 and
738
380 nm wavelengths and for PARspectral domain.
739
740
741
0.0 0.2 0.4 0.6 0.8 1.0 1.2 1.4 1.6 1.8
20 22 24 26 28 30
Kd
(3
25
n
m
)
[m
-1]
Salinity St 170
Fig. 3. Diffuse attenuation coefficient of light for Kd at 325 nm
as a function of surface salinity in the North East (circles) and North West (squares) sectors. Station 170 was characterized by high DOC (115 µM), chlorophylla(1.72 µg L−1), primary productivity (37.9 mgC m−3d−1)andaCDOM(350) (0.56 m−1)content. A
sim-ilar pattern was observed for 340 and 380 nm wavelengths and for PAR spectral domain.
protocols presented in Stedmon and Bro (2008). A three-component PARAFAC model was validated using split-half analysis (Stedmon et al., 2003) and provided low residual values when compared to EEM spectra obtained from the original samples, thus confirming the model’s ability to ex-tract the majority of the samples’ fluorescent features and ap-propriately characterize the surface FDOM composition for this area.
3 Results and discussion
3.1 Surface irradiance at sea surface and diffuse
attenuation coefficient of light in surface waters
During the MALINA cruise, the mean daily doses (kJ m−2)
of UV-B (305 nm), UV-A (380 nm) and PAR incident on the sea surface were 0.12±0.03, 8.46±1.64 and 18.09±4.20 kJ m−2, respectively. These mean daily doses were low and relatively constant throughout the study pe-riod due to the presence of persistent clouds that reduced the overall incident solar radiation and particularly the UV-B. Thus, photochemical processes were probably limited dur-ing the summer of 2009 in the Beaufort Sea. For comparison, such daily doses for UV-B (305 nm), UV-A (380) and PAR (490 nm) were 10-, 2- and 1.5-fold lower, respectively, than those received at the sea surface in the South Pacific gyre during (austral) summer cloudy days (Semp´er´e et al., 2008). Because the overall surface irradiance Es(UV-B) was no-tably weak, the determination of Kd(UV-B) for approxi-mately 50 % of the stations sampled was not possible, par-ticularly for the “organic-rich stations” located mostly in the
35
[image:6.595.48.284.65.224.2]742
Figure 4. Dissolved organic carbon (A) and spectral absorption coefficients aCDOM(350) (B) as
743
a function of surface salinity in the North East (circles), North West (squares) and Mackenzie
744
Delta (triangles) sectors. Linear regressions are given for the North West and Mackenzie delta
745
sectors.
746
747
748
749
A
B 0 50 100 150 200 250 300 350 400
0 5 10 15 20 25 30
D
O
C
[
µ
M
C
]
0 1 2 3 4 5 6 7
0 5 10 15 20 25 30
aC
D
O
M
(350)
[m
-1]
Salinity
y = -0.276x + 7.031 R²= 0.92 p<0.0001 y = -14.15x + 423.19
R²= 0.91, p<0.0001
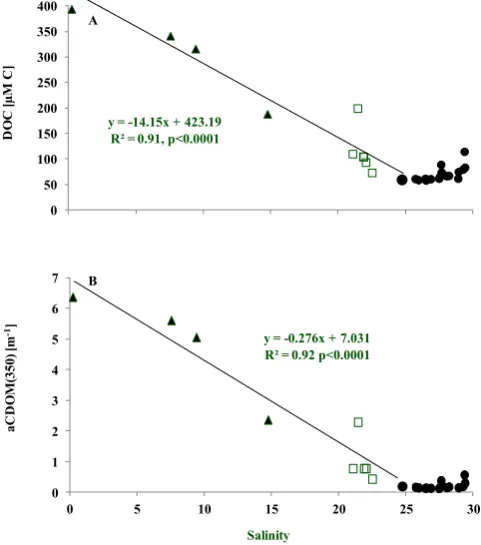
Fig. 4. Dissolved organic carbon (A) and spectral absorption
co-efficientsaCDOM(350) (B) as a function of surface salinity in the
North East (circles), North West (squares) and Mackenzie Delta (tri-angles) sectors. Linear regressions are given for the North West and Mackenzie Delta sectors.
[image:6.595.307.548.67.340.2]J. Para et al.: UV/PAR radiation and DOM properties in surface coastal waters 2767
36
750 751
Figure 5.Relationship between specificabsorption coefficient at 350 nm (aCDOM*(350)) and
752
aCDOM(350)in the Mackenzie delta and North west sectors
753
754
0 1 2 3 4 5 6 7
0 2 4 6 8 10 12 14 16 18
y=19.36x/1.23+x R2= 0.98 p<0.0001
aCDOM(350) (m-1) aCDO
M
*(
350
) (
m
2µ
m
ol
-1)
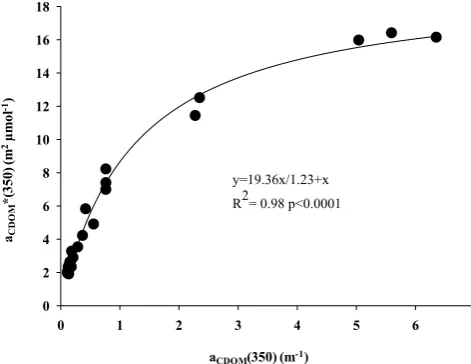
Fig. 5. Relationship between specific absorption coefficient at
350 nm (aCDOM*(350)) andaCDOM(350) in the Mackenzie Delta
and North West sectors.
3.2 DOM characteristics
3.2.1 Dissolved organic carbon (DOC) and
chromophoric DOM
DOC concentration varied from 58 to 394 µM in surface wa-ter of the Beaufort Sea during summer 2009 (Table 1), within the range reported by Emmerton et al. (2008). The minimum DOC value (46 µM) was measured in the deep waters at sta-tion 620 (1750 m depth). This value can be considered as the deep refractory component of the DOC pool in this area. The DOC distribution among the three surface water salin-ity sectors observed for the Canadian shelf increased from 71±15 µM C in the North East Sector (salinity ≥25) to 106±45 and 310±87 µM C in the North West (15<salinity
<25) and Mackenzie Delta (salinity<15) sectors, respec-tively (Table 1, Fig. 4). As shown by salinity distribution (Fig. 2), the western channel was more influenced by the river plume than the eastern channel. Relationships between DOC and salinity indicated a near-conservative behaviour when salinity was less than 25.
Similar to the DOC distributions, aCDOM(350) in-creased from 0.20±0.12 in the North East Sector (salin-ity ≥25) to 1.00±0.73 m−1 in the North West Sector (15<salinity<25) and 4.84±1.74 m−1 in the Mackenzie Delta (salinity<15) Sector, being maximum near the river mouth (Table 1; Fig. 4). We found a negative correlation be-tweenaCDOM(350) and salinity for S <25 that indicates a near-conservative behaviour of CDOM in the river plume.
A similar pattern was observed for the specific absorption coefficient at 350 nm (aCDOM*(350)) with salinity, which is consistent with previous observations reported in the South Atlantic Bight and Mid-Atlantic Bight (Del Vec-chio and Blough, 2004; Kowalczuk et al., 2009). Plotting
37
[image:7.595.308.543.62.205.2]755
Figure 6. Relationship between aCDOM(350) and the CDOM spectral slope in the Beaufort Sea.
756 757 758 759
0.016 0.017 0.018 0.019 0.020 0.021 0.022 0.023
0 1 2 3 4 5 6 7
S
p
ec
tr
al
s
lop
e
(n
m
-1)
aCDOM(350) [m-1]
Fig. 6. Relationship between the CDOM spectral slope and
aCDOM(350) in the Beaufort Sea.
aCDOM*(350) vs. DOC (Fig. 5) revealed a hyperbolic re-lationship (R2=0.98). This observation is in good agree-ment with optical theory, where absorption does not covary with increasing CDOM concentration. This may result from high riverine DOM concentrations that cause shelf shading effects that decrease CDOM light absorption efficiency, as suggested by Kowalczuk et al. (2010). Such results demon-strate the different optical properties between the eastern and western channels, and suggest that the Mackenzie River is a significant source of CDOM in the coastal area.
Our results indicated no significant difference among mean SCDOM values between each salinity sector (0.019±0.001 nm−1, Fig. 6, Table 1) and a general scatter for salinity values greater than 25 (0.018 to 0.023 nm−1). This could be attributed to the unusually high SCDOM values determined for the allochthonous CDOM of the Mackenzie Delta Sector that are more typical of marine CDOM, thus preventing a clear spatial contrast in SCDOM values throughout the system. However, high SCDOM val-ues for the Mackenzie Delta Sector during MALINA are similar to values previously reported for CDOM from the Mackenzie River during summer (Retamal et al., 2007; Osburn et al., 2009; Stedmon et al., 2011). Stedmon et al. (2011) and Osburn et al. (2009) suggested that such highSCDOMvalues might be due to preferential adsorption by high molecular weight hydrophobic DOM components in abundant suspended sediments or to more extensive photodegradation of the high molecular weight fraction in the important Mackenzie River watershed. These results may also reflect high biological activity occurring in the numerous lakes within the Mackenzie catchment that could serve as a source of the CDOM characterized by a high CDOM spectral slope (Squires et al., 2009). We found no relationship between aCDOM(350) and the spectral slope
[image:7.595.47.283.64.246.2]2768 J. Para et al.: UV/PAR radiation and DOM properties in surface coastal waters
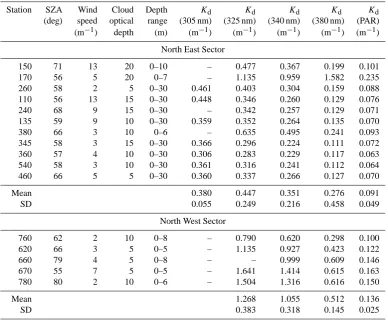
Table 2. Values of diffuse attenuation coefficient of light in the UV-B (305 nm), UV-A (325, 340 and 380 nm) and PAR spectral domains
determined in surface waters of each sampling stations and among the different sectors. Environmental conditions, including solar zenith angle (SZA), wind speed, and cloud optical depth estimation are also reported, as well as the maximal depth range from which surfaceKd(λ)
values were derived.
Station SZA Wind Cloud Depth Kd Kd Kd Kd Kd
(deg) speed optical range (305 nm) (325 nm) (340 nm) (380 nm) (PAR) (m−1) depth (m) (m−1) (m−1) (m−1) (m−1) (m−1)
North East Sector
150 71 13 20 0–10 – 0.477 0.367 0.199 0.101 170 56 5 20 0–7 – 1.135 0.959 1.582 0.235 260 58 2 5 0–30 0.461 0.403 0.304 0.159 0.088 110 56 13 15 0–30 0.448 0.346 0.260 0.129 0.076 240 68 9 15 0–30 – 0.342 0.257 0.129 0.071 135 59 9 10 0–30 0.359 0.352 0.264 0.135 0.070 380 66 3 10 0–6 – 0.635 0.495 0.241 0.093 345 58 3 15 0–30 0.366 0.296 0.224 0.111 0.072 360 57 4 10 0–30 0.306 0.283 0.229 0.117 0.063 540 58 3 10 0–30 0.361 0.316 0.241 0.112 0.064 460 66 5 5 0–30 0.360 0.337 0.266 0.127 0.070
Mean 0.380 0.447 0.351 0.276 0.091
SD 0.055 0.249 0.216 0.458 0.049
North West Sector
760 62 2 10 0–8 – 0.790 0.620 0.298 0.100 620 66 3 5 0–5 – 1.135 0.927 0.423 0.122 660 79 4 5 0–8 – – 0.999 0.609 0.146 670 55 7 5 0–5 – 1.641 1.414 0.615 0.163 780 80 2 10 0–6 – 1.504 1.316 0.616 0.150
Mean 1.268 1.055 0.512 0.136
SD 0.383 0.318 0.145 0.025
Table 3. Spectral characteristics of the three components identified by PARAFAC analysis compared to previously identified components,
including Arctic and sub-Arctic studies (Stedmon et al., 2007; Walker et al., 2009; Fellman et al., 2010). Position of Ex/Em maxima of C1, C2 and C3 are deduced from their corresponding spectra reported in Fig. 8.
Components
C1 C2 C3
Ex. maxima (nm) <240 (300) <240 (340) <240 (275) Em. maxima (nm) 404 472 314
Coble et al. (1998) M A and © B and T Stedmon et al. (2007) C3 C1 C4 and C5 Walker et al. (2009) BERC6 BERC3 BERC5 Fellman et al. (2010) C5 CA and (C2) C8 and C7 Source Marine and Terrestrial Amino acids
terrestrial (allochthonous) (autochthonous)
to determine, a result consistent with observations made by Matsuoka et al. (2012) foraCDOM(440 nm).
There was a linear relationship between DOC and
aCDOM(350) with salinity for the North West and Mackenzie Delta sectors (Fig. 4), whereas values remained constant for
salinities>25 in the North East Sector. DOC oraCDOM(350) residuals calculated as the vertical distance to the regres-sion line represent non-conservative variations in DOC or
[image:8.595.158.440.491.625.2]J. Para et al.: UV/PAR radiation and DOM properties in surface coastal waters 2769
38
760 761
762
763
764
765
Figure
7. Relationships between surface diffuse attenuation coefficient of light (K
d)
766
determined in
the UVR
-
A (325, 340 and 380 nm) and PAR spectral domains with absorption
767
coefficient of CDOM at 350 nm (a
CDOM(350)) observed in the two saltiest surface salinity
768
sectors [North West (squares) and North East sectors (circles)]. Kw =diffuse attenuation
769
coef
ficient values for pure water (K
w(
λ
))
determined by Baker and Smith (1982).
770
771
772
Without St 170 y= 0.010x+0.06, R2=0.90
n=12, p<0.0001
Kw(PAR) = 0,033 +/- 0,029 m-1
y = 0.13x + 0.06
R²= 0.53, n = 13, p =0.004
0.00 0.05 0.10 0.15 0.20 0.25
0.0 0.2 0.4 0.6 0.8 1.0
Kd
(P
A
R
) [
m
-1]
aCDOM(350) [m-1]
St 170
y = 0.67x + 0.03
R²= 0.88, n = 13, p < 0.0001
Kw(380 nm) = 0,027 m-1
0 0.1 0.2 0.3 0.4 0.5 0.6 0.7
0.0 0.2 0.4 0.6 0.8 1.0
K
d
(38
0 n
m
) [
m
-1]
aCDOM(350) [m-1]
St 170
y = 1.30x + 0.07
R²= 0.92, n = 13, p < 0.0001
Kw(340 nm) = 0,064 m-1
0.00 0.20 0.40 0.60 0.80 1.00 1.20 1.40 1.60
0.00 0.20 0.40 0.60 0.80 1.00
K
d
(340
n
m
) [
m
-1]
aCDOM(350) [m-1]
y = 1.56x + 0.11
R²= 0.92, n = 12, p < 0.0001
Kw(325 nm) = 0,086 m-1
0 0.2 0.4 0.6 0.8 1 1.2 1.4 1.6 1.8
0.00 0.20 0.40 0.60 0.80 1.00
K
d
(32
5
n
m
) [
m
-1]
aCDOM(350) [m-1]
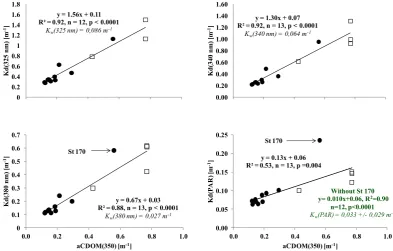
Fig. 7. Relationships between surface diffuse attenuation coefficient of light (Kd)determined in the UV-A (325, 340 and 380 nm) and PAR
spectral domains with absorption coefficient of CDOM at 350 nm (aCDOM(350)) observed in the two saltiest surface salinity sectors (North
West (squares) and North East sectors (circles)).Kw=diffuse attenuation coefficient values for pure water (Kw(λ))determined by Baker
and Smith (1982).
et al., 2011). The highest DOC andaCDOM(350) residuals (+ 80 µM and+1.2 m−1, respectively) were observed at the sta-tion 394 (salinity 21.45) where the primary producsta-tion was high (11.1 mgC m−3d−1, Patrick Raimbault, unpublished re-sults), five-fold higher than primary production for other sta-tions with similar salinity. Unfortunately, primary produc-tion was not available for all staproduc-tions. Negative DOC and
aCDOM(350) residuals correspond, except at station 696, to the lowest chlorophyll values (data not shown).
In order to quantify the relationship between DOC and
aCDOM(350), we plotted theses two parameters for all salin-ities. A significant correlation was found for the North West and Mackenzie Delta sectors (r2=0.99, data not shown), in-dicating that 99 % of DOC variability is explained by that in the colored fraction of DOM. Matsuoka et al. (2012), during the same cruise, observed a similar relationship between DOC content and aCDOM (440). The correlation was lower (R2=0.86) in the North East Sector. The so-lar radiation reaching the sea surface was, due to the pres-ence of persistent clouds, low during summer 2009 (see Sect. 3.1). This low light availability probably prevented CDOM from photobleaching processes, and thus preserved theaCDOM(350)/DOC relationship.
Based on theaCDOM(350) and DOC distributions alone, it appears that the origin of DOM in each region is shifted throughout the shelf system. In the Mackenzie Delta and North West sectors (salinity<25), the concentrations
re-flect the mixing process of the Mackenzie’s terrestrial in-put, except locally (station 394) where primary production enhanced both DOC andaCDOM(350), while in the saltiest surface waters (North East Sector), autochthonous DOM ap-pears to dominate. Sea ice formation/brine rejection and up-welling processes are common physical features in this salty area and have the capacity to both deliver new DOM and enhance surface in situ production of DOM (Carmack and Macdonald, 2002; Barber and Hanesiak, 2004; Gu´eguen et al., 2007; Walker et al., 2009; Mucci et al, 2010). Addi-tional CDOM could be produced by zooplankton and bacte-rioplankton communities (Nelson et al., 2004). DOM intro-duced by either process could have the capacity to create the attenuation patterns for both UV-A and PAR seen in Fig. 3. An upwelling event close to the Cape Bathurst area (Fig. 1) was clearly identified during our sampling period and has been previously observed by Mucci et al. (2010). It enhanced primary production (37.9 mgC m−3d−1, P. Raimbault, un-published results) in the surface waters surrounding Cape Bathurst, manifested as the second highest surface chloro-phyll a concentrations (∼1.72 µg L−1) observed at station 170 (Josephine Ras, LOV, personal communication). Subse-quent organic by-products from this productive area could explain the high values for DOC,aCDOM(350) andKd (UV-A and P(UV-AR) observed at this station (Tables 1 and 2).
[image:9.595.98.492.65.316.2]2770 J. Para et al.: UV/PAR radiation and DOM properties in surface coastal waters
39
[image:10.595.47.290.63.332.2]773
Figure 8. Emission (dashed line) and Excitation (solid line) spectra (left panels) and contour
774
plots (right panels) of the three main fluorescent components identified in the dataset (n = 54). 775
Ex/Em Component 1: 240 (300)/404; Ex/Em Component 2: 240 (340)/472 and Ex/Em
776
Component 3: 240 (275)/314. 777
778
779
0 0,1 0,2 0,3 0,4
240 340 440 540
L
oad
in
gs
Wavelength [nm] Component 1
0 0,1 0,2 0,3 0,4
240 340 440 540
L
oad
in
gs
Wavelength [nm] Component 2
0 0,1 0,2 0,3 0,4
240 340 440 540
L
oad
in
gs
Wavelength [nm] Component 3
E m is si on (n m ) Excitation (nm) 250 350 450 550 300 400 500 550 450 350 E m is si on (n m )
250 350 450 550 300 400 500 550 450 350 E m is si on (n m )
250 350 450 550 300 400 500 550 450 350 0 0,1 0,2 0,3 0,4
240 340 440 540
L
oad
in
gs
Wavelength [nm] Component 1
0 0,1 0,2 0,3 0,4
240 340 440 540
L
oad
in
gs
Wavelength [nm] Component 2
0 0,1 0,2 0,3 0,4
240 340 440 540
L
oad
in
gs
Wavelength [nm] Component 3
E m is si on (n m ) Excitation (nm) 250 350 450 550 300 400 500 550 450 350 E m is si on (n m )
250 350 450 550 300 400 500 550 450 350 E m is si on (n m )
250 350 450 550 300 400 500 550 450 350 Component 1 Component 2 Component 3 Component 1 Component 2 Component 3
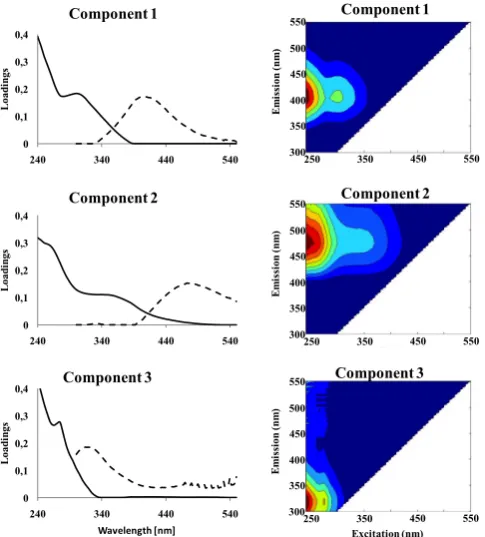
Fig. 8. Emission (dashed line) and excitation (solid line) spectra
(left panels) and contour plots (right panels) of the three main fluo-rescent components identified in the data set (n=54). Ex/Em com-ponent 1: 240 (300)/404; Ex/Em comcom-ponent 2: 240 (340)/472 and Ex/Em component 3: 240 (275)/314.
of the Canadian shelf. An additional feature of the source material can be seen in the estimation of the optically in-active fraction of the DOC pool in the study area. Using the y-intercept of the DOC vs.aCDOM(350) relationship (i.e.
aCDOM(350)=0 m−1), we estimate that about 64 µM of the DOC do not absorb radiation at 350 nm in the Mackenzie River. Such results indicated that, on average,∼16 % of the DOC is optically inactive at 350 nm in the Mackenzie River, with a result similar foraCDOM(440) from Matsuoka et al. (2012). Based on a carbon content of∼400 µM C in the river mouth (Table 1), the DOC discharged by the Mackenzie River can be estimated during the MALINA cruise (30 July– 27 August) to be approximately 0.22 TgC (i.e. 10 to 20 % of annual DOC fluxes and 6 to 10 % of annual total organic car-bon fluxes; Raymond et al., 2007; MacDonald et al;, 1998). Considering that∼64 µM C does not absorb radiation in the UV, we can estimate that about 0.18 TgC of the DOC dis-charge can be categorized as CDOM.
Kd(UV-A) and Kd(PAR) in the North West and North East sectors (i.e. at salinity >20; where radiometric mea-surements were performed) were significantly correlated to
aCDOM(350) values (Fig. 7), except for the singleKd(PAR) value observed at station 170 where the second highest chlorophyll a content and highest primary production
oc-curred (1.72 µg L−1 and 37.9 mgC m−3d−1, respectively, data not shown), andaCDOM(350)=0.56 m−1. Interestingly, the y-intercept values of these relationships (Fig. 7) were in the range of attenuation coefficient values found for pure wa-ter,Kw(λ), determined by Baker and Smith (1982). There-fore, it can be argued that CDOM is the dominant attenuator for not only UV-A radiation, but also for PAR. This is in good agreement with Retamal et al. (2008) and their report of con-trol of PAR-light absorbance by CDOM in the Beaufort Sea.
3.2.2 Fluorescent DOM
Three fluorescent components (Fig. 8, Table 3) were iden-tified with PARAFAC analysis using a total of 54 EEM spectra collected from surface waters and the deep chloro-phyll maximum (DCM) for the stations investigated during the MALINA cruise. The low number of fluorescent com-pounds identified is probably due to the degradation pro-cesses of labile material during storage. Thus, C3 component data should be taken with caution due to possible degrada-tion processes during storage. In the Mackenzie Delta Sec-tor (salinity<15), the relative contribution of the aquatic DOM component C1 (52±2 %) and terrestrial component C2 (36±6 %) reached their highest contribution, while C3 (12±7 %) was around 5 times lower than the same compo-nent determined for the saltiest surface waters. In the North East Sector (salinity >25), the relative contribution of flu-orescent components was clearly dominated by the protein-like C3 (57±7 %), followed by the ubiquitous humic-like C1 (30±4 %) and the terrestrial C2 (13±4 %). In surface waters of the North West Sector (15 <salinity<25), we observed a co-dominance of both C1 (40±8 %) and C3 (36±13 %) while the relative contribution of the terrestrial component C2 was around two times lower (23±6 %).
J. Para et al.: UV/PAR radiation and DOM properties in surface coastal waters 2771
y = 12.91x - 0.95 R² = 0.95, n=9, p<0.0001
0 20 40 60 80 100
0 1 2 3 4 5 6 7
F
lu
or
es
ce
u
n
ce
(
-Q
S
U
)
aCDOM(350) [m-1]
y = -3.56x + 90.18 R² = 0.89, n=10, p<0.0001
0 20 40 60 80 100
0 5 10 15 20 25
F
lu
ore
sc
eu
n
ce
(
-Q
S
U
)
Salinity
y = 10.19x - 4.48 R² = 0.95, n=9, p<0.0001
0 10 20 30 40 50 60 70
0 1 2 3 4 5 6 7
aCDOM(350) [m-1]
y = -2.80x + 67.19 R² = 0.89, n=10, p<0.0001
0 10 20 30 40 50 60 70
0 5 10 15 20 25
Salinity
A C
[image:11.595.100.497.65.261.2]B D
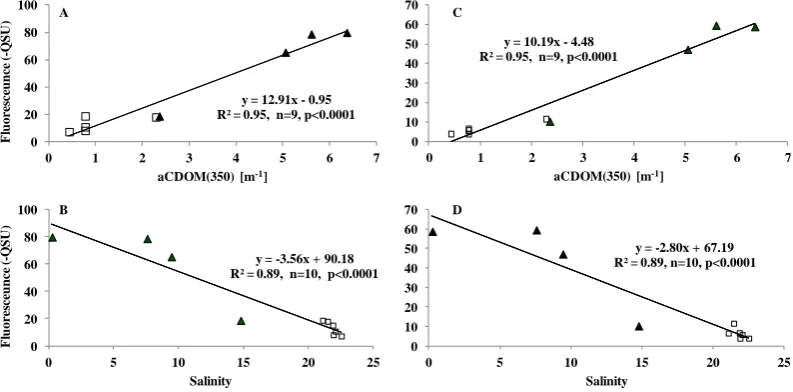
Fig. 9. Relationships observed between C1 (A), (B) and C2 (C), (D) components with absorption coefficient of CDOM at 350 nm
(aCDOM(350)) and salinity determined in the Mackenzie Delta (triangles) and North West sectors (squares).
primary production impact can not be precluded. The fluo-rescence intensity of C1 and C2 components are strongly cor-related (R2=0.89) within the Mackenzie Delta and North West sectors, but this correlation decreased with increasing salinity in the North West Sector (R2=0.77 and 0.33, re-spectively). This decoupling reinforces the hypothesis that there is a common (terrestrial) origin for both the C1 and C2 components in the Mackenzie Delta Sector, whereas the C1 component is probably contributed by in situ marine pro-duction with increasing salinity (>15). The positive linear relations between both C1 and C2 andaCDOM(350) in the Mackenzie Delta and North West sectors (R2=0.95, Fig. 9) suggest that fluorescence may be used as a proxy for the ab-sorption coefficient. The fluorescence/salinity residuals for C1 and C2 did not match chlorophylla content or primary production.
Therefore, during our study period, the FDOM content in surface waters of the Canadian shelf was strongly influenced by allochthonous DOM that originated from the Macken-zie River, except in the saltiest waters where autochthonous in situ biological FDOM prevailed. Surprisingly, the al-lochthonous fluorescent DOM carried by the Mackenzie into the Beaufort Sea presents both a terrestrial humic and an aquatic DOM signature. Indeed, the fluorescence intensity of the aquatic DOM component C1 co-dominated with the terrestrial humic-like component C2 in controlling the over-all over-allochthonous fluorescent DOM pool of the Mackenzie Delta Sector. Interestingly, the overall distribution of the ter-restrial component C2 appeared restricted to the Mackenzie Delta Sector and correlated well with the strongly absorb-ing allochthonous DOM observed, while the surface distri-bution of the aquatic DOM component C1 appeared more widespread in the whole system.
The Mackenzie Delta is composed of numerous (∼45 000) shallow (1.6 m depth on average) macrophyte-rich lakes (Emmerton et al., 2007; Squires et al., 2009) that significantly influence the Mackenzie DOM content prior to its marine discharge in summer (Emmerton et al., 2008; Gareis et al., 2010). In addition, macrophyte and phytoplank-ton degradation/exudation processes in fresh shallow (Zhang et al., 2009) and marine systems can lead to the production of a marine humic-like fluorescent component (M peak; Coble, 1996) comparable to our C1. Therefore, the strong aquatic fluorescent DOM fraction observed in the Mackenzie Delta Sector during this study may partly originate from high biological activity (Squires et al., 2009) occurring in these catchments. This finding complements previous work and provides valuable evidence concerning the Mackenzie organic matter quality, which is depleted in humic material as reported previously during summer time; this depletion is attributed to (i) a long freshwater residence time in Macken-zie catchments (Retamal et al., 2007), (ii) a preferential sorption of the high molecular weight hydrophobic DOM components to abundant suspended sediments (Stedmon et al., 2011) and (iii) a more extensive photodegradation of the high molecular weight fraction occurring in the Mackenzie watershed during summer (Osburn et al., 2009).
4 Summary
2772 J. Para et al.: UV/PAR radiation and DOM properties in surface coastal waters
CDOM content both for UV-A and PAR radiation. Along the Mackenzie Delta and North West sectors of the Beaufort Sea, the DOC and CDOM dynamic is controlled by mixing processes, although, locally, primary productivity can con-tribute to the CDOM signal. In this studyaCDOM(350) can be used as a DOC proxy over the studied area. During the sum-mer period 16 % of the DOC did not absorb light at 350 nm. Fluorescent DOM in the Mackenzie Delta Sector exhibited both a terrestrial “humic-like” signature (component C2) and an in situ aquatic signature (component C1). Fluorescent C1 and C2 components can be used asaCDOM(350) proxy in the Mackenzie Delta and North West sectors.
Acknowledgements. This study was conducted as part of the
Malina Scientific Program funded by ANR (Agence Nationale de la Recherche), INSU-CNRS (Institut National des Sciences de l’Universit´e – Centre National de la Recherche Scientifique), CNES (Centre National d’Etudes Spatiales) and ESA (European Space Agency). We are grateful to M. Babin PI of the Malina Project as well as the captain and crews of the Canadian Icebreaker CCGS
Amundsen. We also thank S. Belanger, A. Mucci, B. Lansard and
C. Stedmon for SIM/Chladata and PARAFAC analysis. Special thanks are due to C. Marec and Y. Graton for water sampling. We are grateful to M. Tedetti and M. Goutx for their help with the fluorescence analysis, and to J. Ras and P. Raimbault for unpub-lished chlorophyll a and primary production data. R. Semp´er´e acknowledges equipment funding from the French Provence Alpes Cˆote d’Azur region. PhD scholarship to J. Para was provided by the Region of Provence Alpes Cˆote d’Azur and AIRPACA. The authors acknowledge anonymous reviewers, G. Herndl for handling the manuscript as an editor, and P. K. Kowalczuk for constructive comments on the manuscript.
Edited by: G. Herndl
The publication of this article is financed by CNRS-INSU.
References
Babin, M., Stramski, D., Ferrari, G. M., Claustre, H., Bricaud, A., Obolensky, G., and Hoepffner, N.: Variations in the light absorp-tion coefficients of phytoplankton, nonalgal particles, and dis-solved organic matter in coastal waters around Europe, J. Geo-phys. Res., 108, 3211, doi:10.1029/2001JC000882, 2003. Baker, K. S. and Smith, R. C.: Bio-optical classification and model
of natural waters, Limnol. Oceanogr., 27, 500–509, 1982. Barber, D. G. and Hanesiak, J.: Meteorological forcing of
sea ice concentrations in the Southern Beaufort Sea over
the period 1978 to 2001, J. Geophys. Res., 109, C06014, doi:10.1029/2003JC002027, 2004
Belzile, C., Roesler, C. S., Christensen, J. P., Shakhova, N., and Semiletov, I.: Fluorescence measured using the WETStar DOM fluorometer as a proxy for dissolved matter absorption, Estuar. Coast. Shelf Sci., 67, 441–449, 2006.
Carmack, E. C. and Macdonald, R. W.: Oceanography of the Cana-dian shelf of the Beaufort Sea: a setting for marine life, Arctic, 55, 29–45, 2002.
Coble, P. G.: Characterization of marine and terrestrial DOM in seawater using excitation emission matrix spectroscopy, Mar. Chem., 51, 325–346, 1996.
Coble, P. G., Schultz, C. A., and Mopper, K.: Fluorescence con-touring analysis of DOC intercalibration experiments samples: a comparison of techniques, Mar. Chem., 41, 173–178, 1993. Coble, P. G., Del Castillo, C. E., and Avril, B.: Distribution and
optical properties of CDOM in the Arabian Sea during the 1995 southwest monsoon, Deep-Sea Res. Pt. II, 45, 2195–2223, 1998. Del Vecchio, R. and Blough, N. V. : Spatial and seasonal distribution of chromophoric dissolved organic matter and dissolved organic carbon in the Middle Atlantic Bight, Mar. Chem. 89, 169–187, 2004.
Dittmar, T. and Kattner, G.: The biogeochemistry of the river and shelf ecosystem of the Arctic Ocean: a review, Mar. Chem., 83, 103–120, 2003
Emmerton, C. A., Lesack, L. F. W., and Marsh, P.: Lake abundance, potential water storage, and habitat distribution in the Mackenzie River Delta, western Canadian Arctic, Water Resour. Res., 43, W05419, doi:10.1029/2006WR005139, 2007.
Emmerton, C. A., Lesack, L. F. W., and Vincent, W. F.: Macken-zie River nutrient delivery to the Arctic Ocean and effects of the Mackenzie Delta during open water conditions, Glob. Bio-geochem. Cy., 22, GB1024, doi:10.1029/2006GB002856, 2008. Fellman, J. B., Spencer, R. G. M., Hernes, P. J., Edwards, R. T., D’Amore, D. V., and Hood, E.: The impacts of glacier runoff on the biodegradability and biochemical composition of terrigenous dissolved organic matter in near-shore marine ecosystems, Mar. Chem., 121, 112–122, 2010.
Foley, J. A.: Tipping points in the tundra, Science, 310, 627–628, 2005.
Gareis, J. A. L., Lesack, L. F. W., and Bothwell, M. L.: Attenuation of in situ UV radiation in Mackenzie Delta lakes with varying dissolved organic matter compositions, Water Resour. Res., 46, W09516, doi:10.1029/2009WR008747, 2010.
Gordeev, V. V.: Fluvial sediment flux to the Arctic Ocean, Geo-morphology, 80, 94–104, doi:10.1016/j.geomorph.2005.09.008, 2006.
Gu´eguen, C., Guo, L., Yamamoto-Kawai, M., and Tanaka, N.: Col-ored dissolved organic matter dynamics across the shelf-basin interface in the western Arctic Ocean, J. Geophys. Res. 112, C05038, doi:10.1029/2006JC003584, 2007.
Gu´eguen, C., Granskog, M. A., McCullough G., and Barber D. G.: Characterisation of colored dissolved organic matter in Hud-son Bay and HudHud-son Strait using parallel factor analysis, J. Mar. Syst., 88, 423–433, 2011.
J. Para et al.: UV/PAR radiation and DOM properties in surface coastal waters 2773
IPCC: Climate Change: The Physical Science Basis, Contribution of Working Group I to the Fourth Assessment Report of the IPCC (Cambridge University Press, Cambridge), chap. 7, 514– 515, 2007.
Jin, Z., Charlock, T., Smith Jr., W., and Rutledge, K.: A parameteri-zation of ocean surface albedo, Geophys. Res. Let., 31, L22301, doi:10.1029/2004GL021180, 2004.
Johannessen, S. C. and Miller, W. L.: Quantum yield for the photo-chemical production of dissolved inorganic carbon in seawater, Mar. Chem., 76, 271–283, 2001.
Kowalczuk, P., Cooper, W. J., Durako, M.J., Young, H., and Kahn, A. E.: Characterization of dissolved organic matter fluorescence in the South Atlantic Bight with use of PARAFAC model: inter-annual variability, Mar. Chem., 113, 182–196, 2009.
Kowalczuk, P., Cooper, W. J., Durako, M. J., Kahn, A. E., Gonsior, M., and Young, H.: Characterization of dissolved organic matter fluorescence in the South Atlantic Bight with use of PARAFAC model: Relationships between fluorescence and its components, absorption coefficients and organic carbon concentrations, Mar. Chem., 118, 22–36, 2010
Lawrence, D. M. and Slater, A. G.: A projection of severe nearsur-face permafrost degradation during the 21st century, Geophys. Res. Lett., 32, L24401, doi:10.1029/2005GL025080, 2005. Macdonald, R. W., Solomon, S. M., Cranston, R. E., Welch, H. E.,
Yunker, M. B., and Gobeil, C.:. A sediment and organic carbon budget for the Canadian Beaufort Sea, Mar. Geol., 144, 255–273, 1998.
Markager, S., Stedmon, C. A., and Søndergaard, M.,: Seasonal dynamics and conservative mixing of dissolved organic matter (DOM) in the temperate eutrophic estuary Horsens Fjord, Estuar. Coast. Shelf Sci., 92, 376–388, 2001.
Matsuoka, A., Hill, V., Huot, Y., Bricaud, A., and Babin, M.: Sea-sonal variability in the light absorption properties of western Arctic waters: parameterization of the individual components of absorption for ocean color applications, J. Geophys. Res., 116, C02007, doi:10.1029/2009JC005594, 2011.
Matsuoka, A., Bricaud, A., Benner, R., Para, J., Semp´er´e, R., Prieur, L., B´elanger, S., and Babin, M.: Tracing the transport of colored dissolved organic matter in water masses of the Southern Beau-fort Sea: relationship with hydrographic characteristics, Biogeo-sciences, 9, 925–940, doi:10.5194/bg-9-925-2012, 2012. Mucci, A., Lansard, B., Miller, L. A., and Papakyriakou, T. N.:
CO2 fluxes across the air-sea interface in the southeastern
Beaufort Sea: Ice-free period, J. Geophys. Res., 115, C04003, doi:10.1029/2009JC005330, 2010.
Nagata, T.: Production mechanisms of Dissolved Organic Matter, in Microbial Ecology of the Oceans, edited by: Kirchman, D. L., 121–152, 2000.
Nelson, N. B, Carlson, C. A., and Steinberg, D. K.: Production of chromophoric dissolved organic matter by Sargasso Sea mi-crobes, Mar. Chem., 89, 273–287, 2004.
O’Brien, M. C., Macdonald, R. W., Melling, H., and Iseki, K.: Par-ticle fluxes and geochemistry on the Canadian Beaufort Shelf: implications for sediment transport and deposition, Cont. Shelf Res., 26, 41–81, 2006.
Opsahl, S., Benner, R., and Amon, R.: Major flux of terrigenous dissolved organic matter through the Arctic Ocean, Limnol. Oceanogr., 44, 2017–2023, 1999.
Osburn, C. L., O’Sullivan, D. W., and Boyd, T. J.: Increases in the longwave photobleaching of chromophoric dissolved organic matter in coastal waters, Limnol. Oceanogr., 54, 145–159, 2009. Para, J., Coble, P. G., Charri`ere, B., Tedetti, M., Fontana, C., and Semp´er´e, R.: Fluorescence and absorption properties of chro-mophoric dissolved organic matter (CDOM) in coastal surface waters of the northwestern Mediterranean Sea, influence of the Rhˆone River, Biogeosciences, 7, 4083–4103, doi:10.5194/bg-7-4083-2010, 2010.
Raymond, P. A., McClelland, J. W., Holmes, R. M., and Zhuli-dov, A. V.: Flux and age of dissolved organic carbon ex-ported to the Arctic Ocean: A carbon isotopic study of the five largest Arctic rivers, Global Biogeochem. Cy., 21, GB4011, doi:10.1029/2007GB002934, 2007.
Retamal, L., Vincent, W. F., Martineau, C., and Osburn, C. L.: Com-parison of the optical properties of dissolved organic matter in two river in?uenced coastal regions of the Canadian Arctic, Es-tuar. Coast. Shelf Sci., 72, 261–272, 2007.
Retamal, L., Bonilla, S., and Vincent, W. F.: Optical gradients and phytoplankton production in the Mackenzie River and the coastal Beaufort Sea, Polar Biol., 31, 363–379, 2008.
Semp´er´e, R., Tedetti, M., Panagiotopoulos, C., Charri`ere, B., and Van Wambeke, F.: Distribution and bacterial availability of dis-solved neutral sugars in the South East Pacific, Biogeosciences, 5, 1165–1173, doi:10.5194/bg-5-1165-2008, 2008.
Smith, R. C. and Baker, K. S.: The analysis of ocean optical data. Proceedings of The Society of Photo-Optical Instrumentation Engineers, Ocean Optics VII, 489, 119–126, 1984.
Sohrin, R. and Semp´er´e, R.: Seasonal variation in total organic car-bon in the Northeast Atlantic in 2000–2001, J. Geophys. Res., 110, C10S90, doi:10.1029/2004JC002731, 2005.
Squires, M. M., Lesack, L. F. W., Hecky, R. E., Guildford, S. J., Ramlal, P., and Higgins, S. N.: Primary Production and Car-bon Dioxide Metabolic Balance of a Lake-Rich Arctic River Floodplain: Partitioning of Phytoplankton, Epipelon, Macro-phyte, and Epiphyton Production Among Lakes of the Macken-zie Delta, Ecosystems, 12, 853–872, doi:10.1007/s10021-009-9263-3, 2009.
Stedmon, C. A. and Bro, R.: Characterizing dissolved organic mat-ter fluorescence with parallel factor analysis: A tutorial, Limnol. Oceanogr. Methods, 6, 572–579, 2008.
Stedmon, C. A. and Markager, S.: The optics of chromophoric dis-solved organic matter (CDOM) in the Greenland Sea: An algo-rithm for differentiation between marine and terrestrially derived organic matter, Limnol. Oceanogr., 46, 2087–2093, 2001. Stedmon, C. A. and Markager, S.: Tracing the production and
degra-dation of autochthonous fractions of dissolved organic matter using fluorescence analysis, Limnol. Oceanogr., 50, 1415–1426, 2005.
Stedmon, C. A., Markager, S., and Kaas, H.: Optical properties and signatures of chromophoric dissolved organic matter (CDOM) in Danish coastal waters, Estuar. Coast. Shelf Sci., 51, 267–278, 2000.
Stedmon, C. A., Markager, S., and Bro, R.: Tracing dissolved organic matter in aquatic environments using a new ap-proach to fluorescence spectroscopy, Mar. Chem., 82, 239–254, doi:10.1016/S0304-4203(03)00072-0, 2003.
2774 J. Para et al.: UV/PAR radiation and DOM properties in surface coastal waters
organic matter in Baltic coastal sea ice: allochthonous or au-tochthonous origins?, Environ. Sci. Technol., 41, 7273–7279, 2007.
Stedmon, C. A., Amon, R. M. W., Rinehart, A. J., and Walker, S. A.: The supply and characteristics of colored dissolved organic matter (CDOM) in the Arctic Ocean: Pan Arctic trends and dif-ferences, Mar. Chem., 124, 108–118, 2011.
Tarnocai, C., Canadell, J. G., Schuur, E. A. G., Kuhry, P., Mazhi-tova, G., and Zimov, S.: Soil organic carbon pools in the north-ern circumpolar permafrost region, Glob. Biogeochem. Cy., 23, GB2023, doi:10.1029/2008GB003327, 2009.
Tedetti, M., Semp´er´e, R., Vasilkov, A., Charri`ere, B., N´erini, D., Miller, W. L., Kawamura, K., and Raimbault, P.: High penetra-tion of ultraviolet radiapenetra-tion in the south east Pacific waters, Geo-phys. Res. Lett., 34, L12610, doi:10.1029/2007GL029823, 2007. Tedetti, M., Guigue, C., and Goutx, M.: Utilization of a sub-mersible UV fluorometer for monitoring anthropogenic inputs in the Mediterranean coastal waters, Mar. Pollut. Bull., 60, 350– 362, 2010.
Walker, S. A., Amon, R. M. W., Stedmon, C., Duan, S., and Lou-chouarn, P.: The use of PARAFAC modeling to trace terrestrial dissolved organic matter and fingerprint water masses in coastal Canadian Arctic surface waters, J. Geophys. Res., 114, G00F06, doi:10.1029/2009JG000990, 2009.
Walvoord, M. A. and Striegl, R. G.: Increased groundwater to stream discharge from permafrost thawing in the Yukon River basin: potential impacts on lateral export of carbon and nitrogen, Geophys. Res. Lett., 34, L12402, doi:10.1029/2007GL030216, 2007.
Yamashita, Y. and Tanoue, E.: Chemical characterization of protein-like fluorophores in DOM in relation to aromatic amino acids, Mar. Chem., 82, 255–271, 2003.
Yamashita, Y., Jaff´e, R., Maie, N., and Tanoue, E.:Assessing the dynamics of dissolved organic matter (DOM) in coastal environ-ments by excitation and emission matrix fluorescence and par-allel factor analysis (EEM-PARAFAC), Limnol. Oceanogr., 53, 1900–1908, 2008.
Yamashita, Y., Cory R. M., Nishioka J., Kuma K., Tanoue, E., and Jaff´e, R.: Fluorescence characteristics of dissolved organic mat-ter in the deep wamat-ters of the Okhotsk Sea and the northwesmat-tern North Pacific Ocean, Deep-Sea Res. Pt. II, 57, 1478–1485, 2010. Yamashita, Y., Panton, A., Mahaffey, C., and Jaff´e, R.: Assess-ing the spatial and temporal variability of dissolved organic matter in Liverpool Bay using excitation–emission matrix flu-orescence and parallel factor analysis, Ocean Dyn., 61, 5, doi:10.1007/s10236-010-0365-4, 2011