Biogeosciences, 10, 4927–4936, 2013 www.biogeosciences.net/10/4927/2013/ doi:10.5194/bg-10-4927-2013
© Author(s) 2013. CC Attribution 3.0 License.
EGU Journal Logos (RGB)
Advances in
Geosciences
Open Access
Natural Hazards
and Earth System
Sciences
Open Access
Annales
Geophysicae
Open Access
Nonlinear Processes
in Geophysics
Open Access
Atmospheric
Chemistry
and Physics
Open Access
Atmospheric
Chemistry
and Physics
Open Access
Discussions
Atmospheric
Measurement
Techniques
Open Access
Atmospheric
Measurement
Techniques
Open Access
Discussions
Biogeosciences
Open Access Open Access
Biogeosciences
DiscussionsClimate
of the Past
Open Access Open Access
Climate
of the Past
Discussions
Earth System
Dynamics
Open Access Open Access
Earth System
Dynamics
Discussions
Geoscientific
Instrumentation
Methods and
Data Systems
Open Access
Geoscientific
Instrumentation
Methods and
Data Systems
Open Access
Discussions
Geoscientific
Model Development
Open Access Open Access
Geoscientific
Model Development
Discussions
Hydrology and
Earth System
Sciences
Open Access
Hydrology and
Earth System
Sciences
Open Access
Discussions
Ocean Science
Open Access Open Access
Ocean Science
Discussions
Solid Earth
Open Access Open Access
Solid Earth
DiscussionsThe Cryosphere
Open Access Open Access
The Cryosphere
DiscussionsNatural Hazards
and Earth System
Sciences
Open Access
Discussions
Technical Note: Comparison of storage strategies of sea surface
microlayer samples
K. Schneider-Zapp1, M. E. Salter2, P. J. Mann3, and R. C. Upstill-Goddard1
1Ocean Research Group, School of Marine Science and Technology, Newcastle University, Newcastle upon Tyne,
NE1 7RU, UK
2Department of Applied Environmental Science (ITM), Stockholm University, Svante Arrhenius v¨ag 8,
11418 Stockholm, Sweden
3Woods Hole Research Center, 149 Woods Hole Road, Falmouth, MA, USA
Correspondence to: K. Schneider-Zapp ([email protected])
Received: 1 February 2013 – Published in Biogeosciences Discuss.: 18 February 2013 Revised: 29 May 2013 – Accepted: 2 June 2013 – Published: 22 July 2013
Abstract. The sea surface microlayer (SML) is an
impor-tant biogeochemical system whose physico-chemical analy-sis often necessitates some degree of sample storage. How-ever, many SML components degrade with time so the devel-opment of optimal storage protocols is paramount. We here briefly review some commonly used treatment and storage protocols. Using freshwater and saline SML samples from a river estuary, we investigated temporal changes in surfac-tant activity (SA) and the absorbance and fluorescence of chromophoric dissolved organic matter (CDOM) over four weeks, following selected sample treatment and storage pro-tocols. Some variability in the effectiveness of individual protocols most likely reflects sample provenance. None of the various protocols examined performed any better than dark storage at 4◦C without pre-treatment. We therefore rec-ommend storing samples refrigerated in the dark.
1 Introduction
The sea surface microlayer (SML) is only tens to hundreds of micrometers deep, but represents a physically, chemically and biologically distinct environment. It contains unique mi-crobial communities, is a site for the synthesis and concentra-tion of organic matter components, including transparent ex-opolymer particles (TEP) implicated in marine snow forma-tion, and surface active substances (SAS) that cause damping of surface turbulence and subsequent suppression of air-sea gas exchange ( ´Cosovi´c, 2005; Upstill-Goddard et al., 2003;
Cunliffe et al., 2011; Wurl et al., 2011; Salter et al., 2011). SAS in seawater are predominantly natural phytoplankton exudates, such as polysaccharides, proteins and lipids, and their degradation products (Gaˇsparovi´c, 2012), with addi-tional contributions in coastal waters from terrestrial humic and fulvic acids. Production of SAS is thus seasonal and leads to strong seasonality of SML properties and air–sea gas exchange (Wurl et al., 2011).
readily available the measurements can be time-consuming, making storage a significant issue for at least some sam-ples. As some degree of SML sample storage is unavoidable, the development of storage protocols that minimise temporal degradation and contamination are essential.
There is currently little consensus regarding appropriate maximum storage times or recommended sample treatments for the routine SML analyses outlined above. Although ear-lier studies addressed sample storage for individual sea water components, reported results are sometimes conflicting and as far as we are aware the simultaneous evaluation of several storage protocols for several sea water analytes has not been adequately undertaken, and this is certainly so for the SML. To address this deficiency we examined the effects of sev-eral established storage protocols on the analysis of SA and CDOM absorbance and fluorescence in SML samples.
2 Review of storage methods
To set the context for our study it is appropriate here to briefly review some commonly used methods for preserving organic matter (OM) samples collected in natural waters.
Refrigeration in the dark at typically 4◦C is in com-mon use for CDOM samples (Coble et al., 1998; Baker, 2002; Stedmon et al., 2003; Wickland et al., 2007; Fell-man et al., 2009; Hood et al., 2009; Lapworth et al., 2009). However, while one study found no change in CDOM ab-sorption in samples refrigerated for less than 24 h (Mitchell et al., 2000), another reported fluorophore-specific declines in fluorescence intensity dependant upon sample provenance (Hudson et al., 2009). Hunter and Liss (1981) found small SA losses from samples dark-stored at 6◦C for up to a week,
but an increase of 20 % after 34 days. Freezing of filtered samples at −20◦C is also widely used for CDOM storage (Coble et al., 1998; Murphy et al., 2008; Conmy et al., 2009; Walker et al., 2009; Gao et al., 2010; Spencer et al., 2010; Yamashita et al., 2010b) but again sample provenance ap-pears to be important; highly coloured samples comprising mostly allochthonous OM tend to show greater changes dur-ing freeze/thaw than more optically clear autochthonous-dominated OM samples. Two studies of a range of fresh-waters found that after freeze/thaw, fluorescence intensities and adsorption coefficients showed both increases and de-creases (Spencer et al., 2007a; Hudson et al., 2009), although overall CDOM loss was observed and protein-, humic-, and fulvic-like fluorophore intensities all declined (Hudson et al., 2009). Both studies concluded that there were no simple rela-tionships between initial sample characteristics and changes during freeze/thaw and that correcting their data for this ef-fect was therefore not possible. On the other hand, Yamashita et al. (2010b) found CDOM absorbance to be unaffected by freezing, although FDOM data were compromised, and Gao et al. (2010) found that changes after freezing were less than 15 %. Other studies also found minimal effects of
freeze/thaw on OM optical properties (Conmy et al., 2009; Yamashita et al., 2010a), and Spencer et al. (2010) found that after freeze/thaw, changes in absorbance, spectral slope, spe-cific UV absorbance, and fluorescence were within analytical error and always less than±2 %.
Sample storage after chemical poisoning to arrest biolog-ical activity is another approach that has been commonly used in the literature, of which five types are common: (i) acidification to pH∼2–3 using HCl or H3PO4; (ii)
chloro-form (CHCl3); (iii) sodium azide (NaN3); (iv) mercuric
chlo-ride (HgCl2) (Kaplan, 1992; Kirkwood, 1992; Benner and
Hedges, 1993; Ferrari et al., 1996; Wiebinga and de Baar, 1998; Kattner, 1999; Gardolinski et al., 2001; Aufdenkampe et al., 2007; Hur et al., 2007; Bouillon et al., 2009; Stubbins et al., 2010); and (v) Formalin (Wurl et al., 2009). A note of caution is the possible modification of the analytes of in-terest but only the effect of acidification has been examined extensively, as it is often used to prevent microbial degrada-tion in CDOM samples and because lowering the pH reduces the tendency towards metal-DOM complexation. However, CDOM absorption has been observed to increase with in-creasing pH (Andersen et al., 2000) and acidification is also reported to change fluorescence intensities and to introduce spectral shifts. For example, Patel-Sorrentino et al. (2002) observed an increase in fluorescence intensity with increas-ing pH between 1 to 10–11 and a decrease at pH 12; Mobed et al. (1996) found a red shift in florescence intensity max-ima with increasing pH in soil-derived humics. The same study also reported a blue shift with increasing pH in aquatic derived DOM. Spencer et al. (2007a) found that pH signif-icantly affects CDOM and EEM measurements and that it is especially severe at extreme pH values. Based on this ev-idence the acidification of samples for CDOM absorbance and fluorescence measurements should be avoided.
While mercuric chloride is deliberately used to inhibit mi-crobial growth in some studies, there are consequent effects on CDOM (Kratzer et al., 2000; Helms et al., 2008; Spencer et al., 2009) and it has been shown to quench DOM fluores-cence (Fu et al., 2007; Yamashita and Jaffe, 2008). Sodium azide has been reported to have no effect (Ferrari et al., 1996; Astoreca et al., 2009) but also to cause up to 10 % increase in absorption (Tiltstone et al., 2002). Patel-Sorrentino et al. (2002) found that sodium azide had no measurable effect on the EEMs of two humic-like fluorophores. The use of toxic chemicals is also problematic from a practical standpoint. Chloroform is difficult to handle because of its volatility and its potential loss through plastic bottles (Kremling and Brug-mann, 1999), while mercuric chloride and sodium azide are very toxic to aquatic organisms and may have long term ad-verse environmental effects (hazardous waste).
Table 1. Treatments used for the SML samples. All samples were stored in the dark and, with the exception of treatment 7, at 4◦C.
No. Treatment Sampling location
1 No treatment Estuarine & riverine
2 Fixed with 1 % Formalin (final concentration) (Wurl et al., 2009) Estuarine 3 Poisoned with 6 µmol L−1 AgNO3 (Kim et al., 2008). The salt was
baked at 200◦C to remove remnants of surfactants before making up the poison
Estuarine
4 Filtered with silver filter Estuarine & riverine 5 Filtered with 0.2 µm surfactant free cellulose acetate (SFCA) filter
(Ku-jawinski et al., 2002)
Estuarine & riverine
6 Filtered with 0.2 µm surfactant free cellulose acetate (SFCA) filter and poisoned with HgCl2
Estuarine & riverine
7 Filtered with 0.2 µm surfactant free cellulose acetate (SFCA) filter and frozen at−20◦C
Estuarine & riverine
We tested the effects of different established storage proto-cols on SA, CDOM, and fluorescence.
3 Materials and methods
All sampling and laboratory equipment was acid-washed with 10 % HCl and rinsed three times with ultra-pure wa-ter (Milli-Q, Millipore System Inc., USA) prior to use. Glass equipment additionally was baked at 450◦C overnight. SML samples were collected from the Tyne estuary (NE UK) on 17 March 2011 (salinities 0 and 17.4), 12 May 2011 (salinity 17.0) and 1 June 2011 (salinity 15.8) using a Garret screen (Garrett, 1965) (mesh 16, wire diameter 0.36 mm, opening 1.25 mm) into “aged” plastic bottles (i.e. all leachable com-ponents removed) and transported to the laboratory. A 5 L sample was collected at each station over a duration of ap-proximately 2 hours. The Garrett screen was selected due to its ease of use even at high winds and its wide application in the literature. Although different sampling devices will result in slightly different samples due to differences in SML sam-ple depth (Cunliffe et al., 2013), there is also great variabil-ity between sampling locations and times which will equally affect storage results. These natural variations are consid-ered much higher than variations which are potentially in-troduced by the choice of the sampling method. Therefore we consider our results to be applicable for other sampling techniques as well.
In the laboratory, the samples were pumped using a peri-staltic pump and silicone perperi-staltic tubing into 15 mL ster-ile polypropylene plastic tubes or 20 mL glass bottles for later analysis. For treatments which involved filtration, the respective filter was inline. To make sample handling as con-sistent as possible, unfiltered samples were pumped through empty filter holders. Subsequently, for treatments involving poisoning, the poison was applied using pipettes before stor-ing at 4◦C or−20◦C, depending on the treatment. All sam-ples were collected in triplicate. For each treatment, 3
repli-cates×4 time points×3 variables (SA, CDOM, FDOM), i.e. 36, tubes/bottles were prepared (for treatments stored in both glass and plastic, 36 each).
The selected treatments are listed in Table 1 and are all in common use (see below). Filtering removes bac-teria and thereby reduces bio-degradation but it also re-moves particulate matter and hence a significant por-tion of SAS. Consequently it has been recommended to measure SA on unfiltered samples ( ´Cosovi´c, 2005). Poi-soning samples by various means arrests bio-degradation but can lead to cell lysis and the leaching of SAS (Lee and Fisher, 1992; Gardner et al., 1983). Our selected procedures examined the net result of all of these. Poison-ing by AgNO3and HgCl2were examined. Acidification
pro-cesses were not considered due to the problems found in pre-vious studies (Sect. 2).
For all protocols, the first sample (t0) was analysed as soon as possible after treatment (i.e. the same or following day). All samples were kept in the dark and all, except treatment 7 which was kept frozen at−20◦C, were kept at 4◦C
follow-ing common practice (Coble et al., 1998; Baker, 2002; Sted-mon et al., 2003; Wickland et al., 2007; Fellman et al., 2009; Hood et al., 2009; Lapworth et al., 2009). Subsequent anal-yses were carried out after one, two, and four weeks. Treat-ments 1 and 6 were stored both in glass and polypropylene bottles to examine the comparative influences of these ma-terials. All others, i.e. treatments 2–5 and 7, were stored in polypropylene only.
Table 2. Characteristics of identified PARAFAC components. Maximal excitation and emission wavelengths are given, secondary excitation
maxima are shown in parentheses. Description contains previously assigned characteristics and names of similar components as shown in the References column.
Comp. Exλ(nm) Emλ(nm) Description References
1 265 533 Humic-like terrestrial DOM Murphy et al. (2008)
2 <250 (305) 425 Humic-like, low molecular weight Murphy et al. (2008), Fellman et al. (2010) 3 <250 (365) 479 Humic-like, high molecular weight Fellman et al. (2010)
4 265 429 Reduced, humic-like group Cory and McKnight (2005)
5 280 342 Tryptophan-like, amino acids free or bound Murphy et al. (2008), Fellman et al. (2010)
K. Schneider-Zapp et al.: Comparison of storage strategies of sea surface microlayer samples 7
Wurl, O., Miller, L., R¨ottgers, R., and Vagle, S.: The distribution and fate of surface-active substances in the sea-surface micro-layer and water column, Mar. Chem., 115, 1–9, 2009.
Wurl, O., Wurl, E., Miller, L., Johnson, K., and Vagle, S.: Forma-tion and global distribuForma-tion of sea-surface microlayers, Biogeo-sciences, 8, 121–135, doi:10.5194/bg-8-121-2011, 2011. Yamashita, Y. and Jaffe, R.: Characterizing the interactions
be-tween trace metals and dissolved organic matter using excitation-emission matrix and parallel factor analysis, Envir. Sci. Tech., 42, 7374–7379, 2008.
Yamashita, Y., Cory, R., Nishioka, J., Kuma, K., Tanoue, E., and Jaffe, R.: Fluorescence characteristics of dissolved organic mat-ter in the deep wamat-ters of the Okhotsk Sea and the northwest-ern North Pacific Ocea, Deep-Sea Research II, 57, 1478–1485, 2010a.
Yamashita, Y., Maie, N., Briceno, and Jaffe, R.: Optical char-acterization of dissolved organic matter in tropical rivers of the Guayana Shield, Venezuela, J. Geophys. Res.-Biogeo, 115, G00F10, doi:10.1029/2009JG000987, 2010b.
Zuev, B. K., Chudinova, V. V., Kovalenko, V. V., and Yagov, V. V.: The Conditions of Formation of the Chemical Composition of the Sea Surface Microlayer and Techniques for Studying Organic Matter in It, Geochem. Int., 39, 702–710, 2001.
polypropylene
glass
0.64 0.66 0.68 0.7 0.72 0.74 0.76 0.78
0 5 10 15 20 25 30
surfactant activity eq mg/l T−X−100
time / days SA
glass polypropylene
38 40 42 44 46 48 50 52
0 5 10 15 20 25 30
250nm : 365nm ratio
time / days CDOM E2:E3
Fig. 1. Surfactant activity (SA) and CDOME2:E3 vs. storage time for estuarine SML samples stores in glass and plastic, SA (top) exemplary for the situation without change, and CDOME2:E3
(bottom) as the only example where there is an influence.
Fig. 1. Surfactant activity (SA) and CDOME2:E3vs. storage time
for estuarine SML samples stores in glass and plastic, SA (top) ex-emplary for the situation without change, and CDOME2:E3
(bot-tom) as the only example where there is an influence.
(1000 rpm). Alternating voltage scans of 10 mV at 75 Hz pro-duced a current which was measured. Each response was corrected for the added NaCl solution and expressed as an equivalent T-X-100 concentration.
CDOM absorbance and fluorescence (Spencer et al., 2007b) were determined by UV/VIS spectrophotometry
(Varian Cary 100 Bio) and UV/VIS spectrofluorometry (Var-ian Cary Eclipse Fluorescence Spectrophotometer), respec-tively (Varian Inc, USA). Both used 10 mm path length quartz cuvettes, rinsed three times with ultra-pure water and once with sample before each measurement. Ultra-pure water blanks were measured at the start and end of each run. Absorbance was measured over the wavelength range 800 nm–200 nm in 1 nm steps. Acquired spectra were cor-rected for drift by subtracting the mean 700 nm to 800 nm absorption (samples are transparent in that range) and the blank spectrum was subtracted. Spectral slopes S (Helms et al., 2008) and the 250 nm to 365 nm absorption ratio (also called E2:E3) were used to indicate dissolved
or-ganic matter (DOM) composition (or “quality”). E2:E3
tracks changes in DOM molecular size and S is an index of average DOM characteristics (chemistry, source, diage-nesis). Both are largely independent of CDOM concentra-tion (Helms et al., 2008). For estimating S we used non-linear regression on the wavelength region 350 nm to 400 nm. CDOM fluorescence excitation-emission matrices (EEMs) were collected over excitation wavelengths 250 nm–450 nm in 5 nm steps and emission wavelengths 280 nm–600 nm in 4 nm steps. EEMs were averaged over 0.1 s. Blank scans were subtracted from sample EEM matrices, which were then corrected for inner filter and instrument effects (Cory et al., 2010). HgCl2quenches DOM fluorescence (Fu et al.,
2007; Yamashita and Jaffe, 2008), hence we did not mea-sure the fluorescence of HgCl2 poisoned samples. In
to-tal, 186 resulting EEMs were modelled with parallel factor analyses (PARAFAC; Stedmon and Bro, 2008). Five differ-ent fluorophores were iddiffer-entified using split-half validation and residual analyses (Table 2).
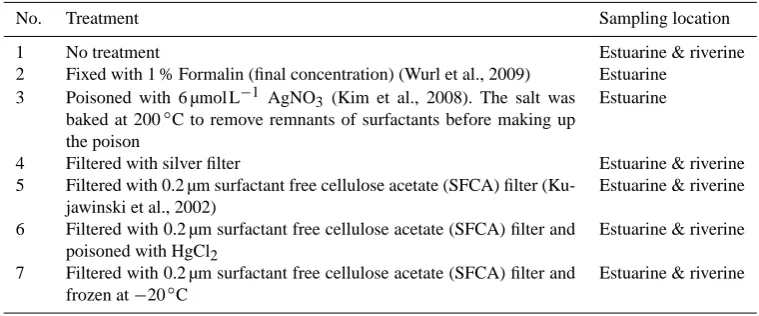
[image:4.595.48.286.210.566.2]K. Schneider-Zapp et al.: Comparison of storage strategies of sea surface microlayer samples 4931
Surfactant activity
no treatment (1) 20
10
0
−10
−20
0 5 10 15 20 25 30
* 20
10
0
−10
−20
0 5 10 15 20 25 30
unfiltered, poisened with formalin (2) 20
10
0
−10
−20
0 5 10 15 20 25 30
unfiltered, poisened with AgNO3 (3)
relati
v
e
change
/
%
20
10
0
−10
−20
0 5 10 15 20 25 30
silver filter (4) nucleopore filter (5) * 20
10
0
−10
−20
0 5 10 15 20 25 30
* 20
10
0
−10
−20
0 5 10 15 20 25 30
nucleopore filter, poisoned with HgCl2 (6)
* 20
10
0
−10
−20
0 5 10 15 20 25 30
frozen, nucleopore filter (7)
[image:5.595.101.497.65.355.2]time / days
Fig. 2.Relative change of surfactant activity (SA) in respect to “No treatment” att0vs. storage time for SML samples collected from the Tyne estuary for different treatments as detailed in Tab. 1. Differences att0are caused by treatment effects. Treatments are labelled in each figure and marked with a star if compatible with no change over time.
Fig. 2. Relative change of surfactant activity (SA) in respect to “No treatment” att0vs. storage time for SML samples collected from the
Tyne estuary for different treatments as detailed in Table 1. Differences att0are caused by treatment effects. Treatments are labelled in each
figure and marked with a star if compatible with no change over time.
least squares. An ANOVA then tested if the parameter “treat-ment” had no influence. Statistics were calculated using the “R” software package. For every analysis, the statistics were checked using Q-Q plots and the distribution of residuals. Results which did not pass were discarded. Except for the statistical tests which operated on the original values, results were normalised to those for no treatment att0 to facilitate direct comparisons of changes during storage. Errors are ex-pressed as the standard deviation of the triplicate analyses.
4 Results and discussion
We found that in all instances except CDOM E2:E3 for samples treated with HgCl2, storage in either glass or
polypropylene did not significantly affect our analytical re-sults (SAp=0.45, CDOMS p=0.55, CDOME2:E3for silver filterp=0.74). Figure 1 shows the comparison graph-ically, for SA as example for the cases with no influence, and for CDOME2:E3as the only case where there is an
influ-ence.
The selected treatments produced varying SA responses (Fig. 2). Formalin (treatment 2) produced an initial increase of 10 % att0 , which may reflect additional DOM leached
from dying cells. If so, it is evidently essentially complete
immediately following the addition. The filtered frozen sam-ple (treatment 7) initially showed lower SA, likely due to par-ticulate matter removal, whereas the unfrozen filtered sample (treatment 5) did not. This could be explained by clogging, causing a change in the effective filter pore size. Poisoning apparently partly compensated surfactant removal by filter-ing by introducfilter-ing leached material (treatments 4 and 6). The untreated sample showed a maximal change of−10 %. Only the untreated sample (p=0.52), frozen (p=0.17) and poi-soning with HgCl2(p=0.06) are compatible with no change
over time.
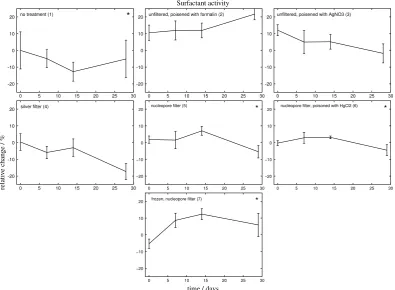
CDOM responses are shown in Figs. 3 and 4. Formalin in-troduced significant absorption even in blank water samples, which precludes its use in CDOM storage protocols. HgCl2
significantly changed the absorption at small wavelengths: the 250 nm to 365 nm absorption ratio changed 10-fold (off scale in Fig. 4). Silver filtration and freezing also led to large changes. AgNO3gave the best performance with changes up
CDOM slope parameterS 80 60 40 20 0 −20
0 5 10 15 20 25 30
no treatment (1)
80 60 40 20 0 −20
0 5 10 15 20 25 30
unfiltered, poisened with AgNO3 (3)
80 60 40 20 0 −20
0 5 10 15 20 25 30
silver filter (4)
relati v e change / % 80 60 40 20 0 −20
0 5 10 15 20 25 30
nucleopore filter (5)
80 60 40 20 0 −20
0 5 10 15 20 25 30
nucleopore filter, poisoned with HgCl2 (6)
80 60 40 20 0 −20
0 5 10 15 20 25 30
frozen, nucleopore filter (7)
[image:6.595.61.536.83.323.2]time / days
Fig. 3.Relative change of CDOM slope parameterSin respect to “No treatment” att0vs. storage time for SML samples collected from the Tyne estuary for different treatments as detailed in Tab. 1. Differences att0are caused by treatment effects. Treatments are labelled in each figure.
250 nm to 365 nm absorption ratio (E2:E3)
60 50 40 30 20 10 0 −10
0 5 10 15 20 25 30
no treatment (1)
60 50 40 30 20 10 −10 0
0 5 10 15 20 25 30
unfiltered, poisened with AgNO3 (3)
60 50 40 30 20 10 0 −10
0 5 10 15 20 25 30
silver filter (4)
relati v e change / % 60 50 40 30 20 10 0 −10
0 5 10 15 20 25 30
nucleopore filter (5)
60 50 40 30 20 10 0 −10
0 5 10 15 20 25 30
frozen, nucleopore filter (7)
[image:6.595.62.538.413.656.2]time / days
Fig. 4.Relative change of 250 nm to 365 nm absorption ratio (E2:E3) in respect to no treatments att0vs. storage time for SML samples collected from the Tyne estuary for different treatments as detailed in Tab. 1. Differences att0are caused by treatment effects. Treatments are labelled in each figure. Note thatHgCl2is off scale and thus not shown.
Fig. 3. Relative change of CDOM slope parameterSin respect to “No treatment” att0vs. storage time for SML samples collected from the
Tyne estuary for different treatments as detailed in Table 1. Differences att0are caused by treatment effects. Treatments are labelled in each
figure.
10 K. Schneider-Zapp et al.: Comparison of storage strategies of sea surface microlayer samples
CDOM slope parameterS 80 60 40 20 0 −20
0 5 10 15 20 25 30
no treatment (1)
80 60 40 20 0 −20
0 5 10 15 20 25 30
unfiltered, poisened with AgNO3 (3)
80 60 40 20 0 −20
0 5 10 15 20 25 30
silver filter (4)
relati v e change / % 80 60 40 20 0 −20
0 5 10 15 20 25 30
nucleopore filter (5)
80 60 40 20 0 −20
0 5 10 15 20 25 30
nucleopore filter, poisoned with HgCl2 (6)
80 60 40 20 0 −20
0 5 10 15 20 25 30
frozen, nucleopore filter (7)
time / days
Fig. 3.Relative change of CDOM slope parameterSin respect to “No treatment” att0vs. storage time for SML samples collected from the Tyne estuary for different treatments as detailed in Tab. 1. Differences att0are caused by treatment effects. Treatments are labelled in each figure.
250 nm to 365 nm absorption ratio (E2:E3)
60 50 40 30 20 10 0 −10
0 5 10 15 20 25 30
no treatment (1)
60 50 40 30 20 10 −10 0
0 5 10 15 20 25 30
unfiltered, poisened with AgNO3 (3)
60 50 40 30 20 10 0 −10
0 5 10 15 20 25 30
silver filter (4)
relati v e change / % 60 50 40 30 20 10 0 −10
0 5 10 15 20 25 30
nucleopore filter (5)
60 50 40 30 20 10 0 −10
0 5 10 15 20 25 30
frozen, nucleopore filter (7)
time / days
Fig. 4. Relative change of 250 nm to 365 nm absorption ratio (E2:E3) in respect to no treatments att0vs. storage time for SML samples collected from the Tyne estuary for different treatments as detailed in Tab. 1. Differences att0are caused by treatment effects. Treatments are labelled in each figure. Note thatHgCl2is off scale and thus not shown.
Fig. 4. Relative change of 250 nm to 365 nm absorption ratio (E2:E3) in respect to no treatments att0vs. storage time for SML samples
collected from the Tyne estuary for different treatments as detailed in Table 1. Differences att0are caused by treatment effects. Treatments
K. Schneider-Zapp et al.: Comparison of storage strategies of sea surface microlayer samples 4933
Surfactant activity
relati
v
e
change
/
%
0 5 10 15 20 25 30
−25 −20 −15 −10 −5 0 5 10 15
0.55 0.6 0.65 0.7 0.75 0.8 estuarine (S = 17.4) 17.03. no treatment *
0 5 10 15 20 25 30
−25 −20 −15 −10 −5 0 5 10 15
0.55 0.6 0.65 0.7 0.75 0.8 riverine (S = 0) 17.03. no treatment *
0 5 10 15 20 25 30
−25 −20 −15 −10 −5 0 5 10 15
0.5 0.55 0.6 0.65 0.7 estuarine (S = 17) 12.05. no treatment *
0 5 10 15 20 25 30
−25 −20 −15 −10 −5 0 5 10 15
0.7 0.75 0.8 0.85 0.9 0.95 1 estuarine (S = 15.8) 01.06. no treatment
surf
actant
acti
vity
/
eq.
mg/l
T
-X-100
/
%
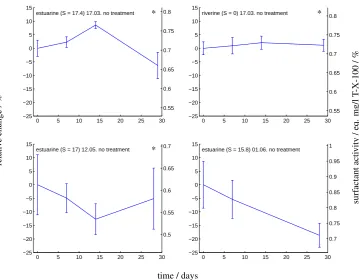
[image:7.595.120.480.89.369.2]time / days
Fig. 5. SA vs. storage time for untreated SML samples collected from the Tyne estuary at two different locations (estuarine and riverine, sampling days and salinitiesSare stated in the plots) and on different days. Note that the left axis shows relative change, while the right axis shows absolute values. Data compatible with no change over time is marked with a star.
Fig. 5. SA vs. storage time for untreated SML samples collected from the Tyne estuary at two different locations (estuarine and riverine,
[image:7.595.326.526.491.580.2]sampling days and salinitiesSare stated in the plots) and on different days. Note that the left axis shows relative change, while the right axis shows absolute values. Data compatible with no change over time is marked with a star.
Table 3. Statistical evaluation of no effect of storage time (pvalue). Tests were run separately for each treatment (as detailed in Table 1) and variable. Forp <0.05 time is considered to have a significant influence. Unmeasured data are shown as n/a; statistics that did not pass the quality control as “–”.
Treatment SA CDOMS CDOME2:E3
1 0.52 0.12 0.05
2 0.004 n/a n/a
3 0.004 – 0.14
4 0.002 0.14 0.21
5 0.10 – –
6 0.06 0.70 0.58
7 0.17 0.36 0.10
[image:7.595.68.267.501.603.2]Table 3 shows the results of the statistical test against no change over time (disregarding initial change compared to the untreated sample) for all variables and treatments. Overall, none of the sample storage protocols examined per-formed any better than “no treatment”. Table 4 shows the results for the statistical test against “no treatment”. Nearly all treatments are significantly different (for SA only silver
Table 4. Statistical evaluation of no effect of treatment (pvalue). Each treatment as detailed in Table 1 was separately tested against “No treatment”. Forp <0.05 the treatment is considered to be sig-nificantly different from “No treatment”.
Treatment SA CDOMS CDOME2:E3
2 0.002 0.97 0.12
3 0.000 n/a n/a
4 0.80 0.000 –
5 0.000 – 0.000
6 0.000 – –
7 – 0.000 0.000
filter (4), and for CDOM only Formalin (2) are not signifi-cantly different). For no treatment all investigated variables are compatible, thus all pre-treatments significantly modify the samples.
4934 K. Schneider-Zapp et al.: Comparison of storage strategies of sea surface microlayer samples
-40 -30 -20 -10 0 10
0 5 10 15 20 25 30
relative change / %
time / days
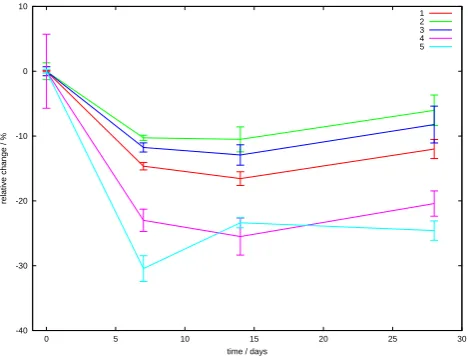
[image:8.595.51.287.65.245.2]1 2 3 4 5
Fig. 6. Relative change of the five different fluorescence compo-nents as detailed in Tab. 2 vs. storage time for the untreated sample. Fig. 6. Relative change of the five different fluorescence
compo-nents as detailed in Table 2 vs. storage time for the untreated sam-ple.
in SA; none of the others showed any significant tempo-ral change (p=0.12,p=0.63, andp=0.53, respectively). Initial changes due to the treatments (e.g. SAS leaching due to poisoning) also showed significant scatter for the differ-ent sampling locations and times, indicating that treatmdiffer-ent effects cannot be easily predicted (data not shown).
Different SAS components degrade differently. Figure 6 shows relative changes in fluorescence components in the untreated sample. Tryptophan-like substances (component 5) and reduced humic-like groups (component 4) appar-ently degrade more rapidly than humic-like substances (components 1–3).
Findings of previous studies for CDOM and FDOM (Sect. 2) support the notion that changes in sample charac-teristics during storage can vary greatly, dependent not only on the selected sample treatment and storage time, but also on the initial sample composition. Our comparison of SA and CDOM changes of the same samples shows that SA and CDOM do not always behave similarly. Consequences for the subsequent analysis of SML samples stored accord-ing to various protocols may therefore be difficult to pre-dict precisely with any great confidence. However within er-ror changes over time for untreated samples during the first 14 days of storage are not significant for most samples.
5 Conclusions
A storage experiment using SML samples of varying salini-ties and seven different storage protocols showed that mea-sured surfactant activity and CDOM absorption and fluores-cence all depended on sample provenance as well as initial sample treatment and subsequent storage times. Moreover, all analyses showed significant scatter between triplicates
and none of the several protocols examined performed any better than that of “no treatment”. This highlights the diffi-culty of devising adequate storage protocols for SML sam-ples. If all variables are considered, none of the tested pro-tocols were compatible with “no treatment”. This is proba-bly due to the potential problem of organic material leaching from dying cells on poisoning and the likely removal of sig-nificant particulate organic matter on filtration. Therefore we must conclude that where the storage of samples for SAS and CDOM analysis is necessitated by circumstances, such samples should remain untreated and be stored at 4◦C in the dark for as short a time as possible. For storage of 7 days we found this protocol to result in an error of less than 12 % in SA compared to samples analysed immediately following collection and for most samples, temporal changes are not significant within the first 14 days of storage.
Acknowledgements. We acknowledge and appreciate funding made available by the German Research Foundation (DFG; research fellowship to K. Schneider-Zapp), the UK Natural Environment Research Council (NERC; Grant number NE/IO15299/1), and the School of Marine Science and Technology, Newcastle University.
Edited by: G. Herndl
References
Andersen, D., Alberts, J., and Takacs, M.: Nature of natural organic matter (NOM) in acidified and limed surface waters, Water Res., 34, 266–278, 2000.
Astoreca, R., Rousseau, V., and Lancelot, C.: Coloured dissolved organic matter (CDOM) in Southern North Sea waters: Optical characterization and possible origin, Estuarine, Coast. Shelf Sci., 85, 633–640, 2009.
Aufdenkampe, A., Mayorga, E., Hedges, J., Llerena, C., Quay, P., Gudeman, J., Krusche, A., and Richey, J.: Organic matter in the Peruvian headwaters of the Amazon: Compositional evolu-tion from the Andes to the lowland Amazon mainstem, Organ. Geochem., 38, 337–364, 2007.
Baker, A.: Fluorescence excitation-emission matrix characteriza-tion of river waters impacted by a tissue mill effluent, Envir. Sci. Tech., 36, 1377–1382, 2002.
Benner, R. and Hedges, J.: A test of the accuracy of freshwater DOC measurements by high-temperature catalytic oxidation and UV-promoted persulfate oxidation, Mar. Chem., 41, 161–165, 1993. Bouillon, S., Abril, G., Borges, A. V., Dehairs, F., Govers, G., Hughes, H. J., Merckx, R., Meysman, F. J. R., Nyunja, J., Os-burn, C., and Middelburg, J. J.: Distribution, origin and cycling of carbon in the Tana River (Kenya): a dry season basin-scale sur-vey from headwaters to the delta, Biogeosciences, 6, 2475–2493, doi:10.5194/bg-6-2475-2009, 2009.
Coble, P., Del Castillo, C., and Avril, B.: Distribution and optical properties of CDOM in the Arabian Sea during the 1995 South-west Monsoon, Deep-Sea Res., Part 2, 45, 2195–2223, 1998. Conmy, R., Coble, P., Cannizzaro, J., and Heil, C.: Influence of
Cory, R. M. and McKnight, D. M.: Fluorescence Spectroscopy Re-veals Ubiquitous Presence of Oxidized and Reduced Quinones in Dissolved Organic Matter, Environ. Sci. Technol., 39, 8142– 8149, doi:10.1021/es0506962, 2005.
Cory, R. M., Miller, M. P., McKnight, D. M., Guerard, J. J., and Miller, P. L.: Effect of instrument-specific response on the analy-sis of fulvic acid fluorescence spectra, Limnol. Oceanogr. Meth., 8, 67–78, 2010.
´
Cosovi´c, B.: Surface-Active Properties of the Sea Surface Mi-crolayer and Consequences for Pollution in the Mediter-ranean Sea, in: The MediterMediter-ranean Sea, vol. 5 part K of The Handbook of Environmental Chemistry, pp. 541–553, Springer Berlin/Heidelberg, doi:10.1007/b107150, 2005.
´
Cosovi´c, B. and Vojvodi´c, V.: The application of ac polarography to the determination of surface-active substances in seawater, Lim-nol. Oceanogr., 27, 361–369, 1982.
Cunliffe, M., Upstill-Goddard, R. C., and Murrell, J. C.: Microbiol-ogy of aquatic surface microlayers, FEMS Microbiol. Rev., 35, 233–246, doi:10.1111/j.1574-6976.2010.00246.x, 2011. Cunliffe, M., Engel, A., Frka, S., Gaˇsparovi´c, B., Guitart, C.,
Mur-rell, J. C., Salter, M., Stolle, C., Upstill-Goddard, R., and Wurl, O.: Sea surface microlayers: A unified physicochemical and bi-ological perspective of the air–ocean interface, Prog. Oceanogr., 109, 104–116, doi:10.1016/j.pocean.2012.08.004, 2013. Fellman, J., Hood, E., Edwards, R., and D’Amore, D.: Changes
in the concentration, biodegradability, and fluorescent proper-ties of dissolved organic matter during stormflows in coastal temperate watersheds, J. Geophys. Res.-Biogeo, 114, G01021, doi:10.1029/2008JG000790, 2009.
Fellman, J. B., Hood, E., and Spencer, R. G. M.: Fluorescence spec-troscopy opens new windows into dissolved organic matter dy-namics in freshwater ecosystems: A review, Limnol. Oceanogr., 55, 2452–2462, doi:10.4319/lo.2010.55.6.2452, 2010.
Ferrari, G., Dowell, M., Grossi, S., and Targa, C.: Relationship be-tween the optical properties of chromophoric dissolved organic matter and total concentration of dissolved organic carbon in the southern Baltic Sea region, Mar. Chem., 55, 299–316, 1996. Frew, N. M., Nelson, R. K., Bock, E. J., McGillis, W. R., Edson,
J. B., and Hara, T.: Spatial variations in surface microlayer sur-factants and their role in modulating air-sea exchange, in: Gas Transfer at Water Surfaces, edited by Donelan, M. A., Saltzman, E. S., Wanninkhof, R., and Drennan, W. M., vol. 127 of Geo-physical Monograph Series, 153–159, AGU Press, Washington DC, 2002.
Fu, P., Wu, F., Liu, C., Wang, F., Li, W., Yue, L., and Guo, Q.: Fluorescence characterization of dissolved organic matter in an urban river and its complexation with Hg(II), Appl. Geochem., 22, 1668–1679, 2007.
Gao, L., Fan, D., Li, D., and Cai, J.: Fluorescence characteristics of chromophoric dissolved organic matter in shallow water along the Zhejiang coasts, southeast China, Marine Environmental Re-search, 69, 187–197, 2010.
Gardner, W. D., Hinga, K. R., and Marra, J.: Observations on the degradation of biogenic material in the deep ocean with implica-tions on accuracy of sediment trap fluxes, J. Mar. Res., 41, 195– 214, 1983.
Gardolinski, P., Hanrahan, G., Achterberg, E., Gledhill, M., Tappin, A., House, W., and Worsfold, P.: Comparison of sample storage protocols for the determination of nutrients in natural waters,
Wa-ter Res., 35, 3670–3678, 2001.
Garrett, W. D.: Collection of slick-forming materials from the sea surface, Limnol. Oceanogr., 10, 602–605, 1965.
Gaˇsparovi´c, B.: Decreased production of surface-active organic substances as a consequence of the oligotrophication in the northern Adriatic Sea, Est. Coast. Shelf Sci., 115, 33–39, doi:10.1016/j.ecss.2012.02.004, 2012.
Harvey, G. W. and Burzell, L. A.: A simple microlayer method for small samples, Limnol. Oceanogr., 17, 156–157, 1972.
Helms, J. R., Stubbins, A., Ritchie, J. D., Minor, E. C., Kieber, D. J., and Mopper, K.: Absorption spectral slopes and slope ratios as indicators of molecular weight, source, and photobleaching of chromophoric dissolved organic matter, Limnol. Oceanogr., 53, 955–969, doi:10.4319/lo.2008.53.3.0955, 2008.
Hood, E., Fellman, J., Spencer, R., Hernes, P., Edwards, R., Di-Amore, D., and Scott, D.: Glaciers as a source of ancient and labile organic matter to the marine environment, Nature, 462, 1044–1048, 2009.
Hudson, N., Baker, A., and Reynolds, D.: Fluorescence analysis of dissolved organic matter in natural, waste and polluted waters – A review, River. Res. Applic., 23, 631–649, 2007.
Hudson, N., Baker, A., Reynolds, D., Carliell-Marquet, C., and Ward, D.: Changes in freshwater organic matter flu-orescence intensity with freezing/thawing and dehydra-tion/ rehydration, J. Geophys. Res.-Biogeo, 114, G00F08, doi:10.1029/2008JG000915, 2009.
Hunter, K. A. and Liss, P. S.: Polarographic measurement of surface-active material in natural waters, Water Res., 15, 203 – 215, doi:10.1016/0043-1354(81)90113-5, 1981.
Hur, J., Jung, N., and Shin, J.: Spectroscopic distribution of dis-solved organic matter in a dam reservoir impacted by turbid storm runoff, Environ. Monitor. Assess., 133, 53–67, 2007. Kaplan, L.: Comparison of high-temperature and persulfate
oxida-tion methods for determinaoxida-tion of dissolved organic carbon in freshwaters, Limnol. Oceanogr., 37, 1119–1125, 1992.
Kattner, G.: Storage of dissolved inorganic nutrients in seawater: poisoning with mercuric chloride, Mar. Chem., 67, 61–66, 1999. Kim, J. Y., Lee, C., Cho, M., and Yoon, J.: Enhanced inactivation of E. coli and MS-2 phage by silver ions combined with UV-A and visible light irradiation, Water Res., 42, 356–362, 2008. Kirkwood, D.: Stability of solutions of nutrient salts during storage,
Mar. Chem., 38, 151–164, 1992.
Kratzer, S., Bowers, D., and Tett, P.: Seasonal changes in colour ratios and optically active constituents in the optical Case-2 wa-ters of the Menai Strait, North Wales, Int. J. Remote Sens., 21, 2225–2246, 2000.
Kremling, K. and Brugmann, L.: 2. Filtration and storage, in: Meth-ods of seawater analysis, edited by Grashoff, K., Kremling, K., and Ehrhardt, M., Wiley-TCH, Germany, 3rd Edn., 1999. Kujawinski, E. B., Farrington, J. W., and Moffett, J. W.: Evidence
for grazing-mediated production of dissolved surface-active ma-terial by marine protists, Mar. Chem., 77, 133–142, 2002. Lapworth, D., Gooddy, D., Allen, D., and Old, G.: Understanding
groundwater, surface water, and hyporheic zone biogeochemical processes in a Chalk catchment using fluorescence properties of dissolved and colloidal organic matter, J. Geophys. Res.-Biogeo, 114, G00F02, doi:10.1029/2009JG000921, 2009.
1992.
Mitchell, B., Bricaud, A., Carder, K., Cleveland, J., Feraari, G., Gould, R., Kahru, M., Kishino, M., Maske, H., Moisan, T., Moore, L., Nelson, N., Phinney, D., Reynolds, R., Sosik, H., Stramski, D., Tassan, S., Trees, C., Weidemann, A., Wieland, J., and Vodacek, A.: Determination of spectral absorption co-efficients of particles, dissolved material and phytoplankton for discrete water samples, in: Ocean Optics Protocols for Satellite Ocean Color Sensor Validation, Revision 2, edited by Fargion, G. and Mueller, J. L., chap. 12, 125–153, NASA Goddard Space Flight Center, Greenbelt, 2000.
Mobed, J., Hemmingsen, S., Autry, J., and McGown, L.: Fluores-cence characterisation of IHSS humic substances: total lumines-cence spectra with absorbance correction, Envir. Sci. Tech., 30, 3061–3066, 1996.
Murphy, K., Stedmon, C., Waite, T., and Ruiz, G.: Distinguish-ing between terrestrial and autochthonous organic matter sources in marine environments using fluorescence spectroscopy, Mar. Chem., 108, 40–58, 2008.
Patel-Sorrentino, N., Mounier, S., and Benaim, J.: Excitation-emission fluorescence matrix to study pH influence on organic matter fluorescence in the Amazon basin rivers, Water Res., 36, 2571–2581, 2002.
Salter, M. E., Upstill-Goddard, R. C., Nightingale, P. D., Archer, S. D., Blomquist, B., Ho, D. T., Huebert, B., Schlosser, P., and Yang, M.: Impact of an artificial surfactant release on air-sea gas fluxes during Deep Ocean Gas Exchange Experiment II, J. Geo-phys. Res., 116, C11 016, doi:10.1029/2011JC007023, 2011. Spencer, R. G, Bolton, L., and Baker, A.: Freeze/thaw and pH
ef-fects on freshwater dissolved organic matter fluorescence and ab-sorbance properties from a number of UK locations, Water Res., 41, 2941–2950, 2007a.
Spencer, R. G., Baker, A., Ahad, J. M., Cowie, G. L., Ganeshram, R., Upstill-Goddard, R. C., and Uher, G.: Dis-criminatory classification of natural and anthropogenic wa-ters in two U.K. estuaries, Sci. Total Environ., 373, 305–323, doi:10.1016/j.scitotenv.2006.10.052, 2007b.
Spencer, R. G, Stubbins, A., Hernes, P., Baker, A., Mopper, K., Aufdenkapme, A., Dyda, R., Mwamba, V., Mangangu, A., Wabakanghanzi, J., and Six, J.: Photochemical degrada-tion of dissolved organic matter and dissolved lignin phenols from the Congo River, J. Geophys. Res.-Biogeo, 114, G03010, doi:10.1029/2009JG000968, 2009.
Spencer, R. G, Hernes, P., Ruf, R., Baker, A., Dyda, R., Stub-bins, A., and Six, J.: Temporal controls on dissolved or-ganic matter and lignin biogeochemistry in a pristine tropical river, Democratic Republic of Congo, J. Geophys. Res.-Biogeo, doi:10.1029/2009JG001180, 2010.
Stedmon, C. A. and Bro, R.: Characterizing dissolved organic mat-ter fluorescence with parallel factor analysis: a tutorial, Limnol. Oceanogr., 6, 572–579, 2008.
Stedmon, C. A., Markagera, S., and Bro, R.: Tracing dissolved or-ganic matter in aquatic environments using a new approach to fluorescence spectroscopy, Mar. Chem., 82, 239–254, 2003.
Stubbins, A., Spencer, R., Chen, H., Hatcher, P., Mopper, K., Hernes, P., Mwamba, V., Mangangu, A., Wabakanghanzi, J., and Six, J.: Illuminated darkness: Molecular signatures of Congo River dissolved organic matter and its photochemical alteration as revealed by ultrahigh precision mass spectrometry, Limnol. Oceanogr., 55, 1467–1477, 2010.
Tiltstone, G., Moore, G., Sorensen, K., Rottgers, R., Jor-gensen, P., Vicente, V., and Ruddick, K.: Regional val-idation of MERIS chlorophyll products in North Sea coastal waters, REVAMP Inter-calibration report, EVG 2001-00049, https://earth.esa.int/workshops/mavt 2003/ MAVT-2003 802 REVAMPprotocols3.pdf, 2002.
Upstill-Goddard, R. C., Frost, T., Henry, G. R., Franklin, M., Mur-rell, J. C., and Owens, N. J. P.: Bacterioneuston control of air– water methane exchange determined with a laboratory gas ex-change tank, Global Biogeochem. Cy., 17, 19.1–19.15, 2003. Walker, S., Amon, R., Stedmon, C., Duan, S., and Louchouarn, P.:
The use of PARAFAC modeling to trace terrestrial dissolved or-ganic matter and fingerprint water masses in coastal Canadian Arctic surface waters, J. Geophys. Res.-Biogeo, 114, G00F06, doi:10.1029/2009JG000990, 2009.
Wickland, K., Neff, J., and Aiken, G.: DOC in Alaskan boreal forests: sources, chemical characteristics, and biodegradability, Ecosystems, 10, 1323–1340, 2007.
Wiebinga, C. and de Baar, H.: Determination of the distribution of dissolved organic carbon in the Indian sector of the Southern Ocean, Mar. Chem., 61, 185–201, 1998.
Wurl, O., Miller, L., R¨ottgers, R., and Vagle, S.: The distribution and fate of surface-active substances in the sea-surface microlayer and water column, Mar. Chem., 115, 1–9, 2009.
Wurl, O., Wurl, E., Miller, L., Johnson, K., and Vagle, S.: Forma-tion and global distribuForma-tion of sea-surface microlayers, Biogeo-sciences, 8, 121–135, doi:10.5194/bg-8-121-2011, 2011. Yamashita, Y. and Jaffe, R.: Characterizing the interactions
be-tween trace metals and dissolved organic matter using excitation-emission matrix and parallel factor analysis, Envir. Sci. Tech., 42, 7374–7379, 2008.
Yamashita, Y., Cory, R., Nishioka, J., Kuma, K., Tanoue, E., and Jaffe, R.: Fluorescence characteristics of dissolved organic mat-ter in the deep wamat-ters of the Okhotsk Sea and the northwesmat-tern North Pacific Ocea, Deep-Sea Res. II, 57, 1478–1485, 2010a. Yamashita, Y., Maie, N., Briceno, and Jaffe, R.: Optical
char-acterization of dissolved organic matter in tropical rivers of the Guayana Shield, Venezuela, J. Geophys. Res.-Biogeo, 115, G00F10, doi:10.1029/2009JG000987, 2010b.