www.biogeosciences.net/12/163/2015/ doi:10.5194/bg-12-163-2015
© Author(s) 2015. CC Attribution 3.0 License.
Deploying four optical UAV-based sensors over grassland:
challenges and limitations
S. K. von Bueren1,*, A. Burkart2,*, A. Hueni3, U. Rascher2, M. P. Tuohy1, and I. J. Yule1 1Institute of Agriculture & Environment, Massey University, Palmerston North, New Zealand
2Institute of Bio- and Geosciences, IBG-2: Plant Sciences, Forschungszentrum Jülich GmbH, Jülich, Germany 3Remote Sensing Laboratories, University of Zurich, Zurich, Switzerland
*These authors contributed equally to this work.
Correspondence to: A. Burkart ([email protected])
Received: 1 February 2014 – Published in Biogeosciences Discuss.: 7 March 2014 Revised: 25 November 2014 – Accepted: 28 November 2014 – Published: 9 January 2015
Abstract. Unmanned aerial vehicles (UAVs) equipped with lightweight spectral sensors facilitate non-destructive, near-real-time vegetation analysis. In order to guarantee robust scientific analysis, data acquisition protocols and processing methodologies need to be developed and new sensors must be compared with state-of-the-art instruments. Four differ-ent types of optical UAV-based sensors (RGB camera, con-verted near-infrared camera, six-band multispectral camera and high spectral resolution spectrometer) were deployed and compared in order to evaluate their applicability for veg-etation monitoring with a focus on precision agricultural ap-plications. Data were collected in New Zealand over rye-grass pastures of various conditions and compared to ground spectral measurements. The UAV STS spectrometer and the multispectral camera MCA6 (Multiple Camera Array) were found to deliver spectral data that can match the spectral measurements of an ASD at ground level when compared over all waypoints (UAV STS: R2=0.98; MCA6: R2= 0.92). Variability was highest in the near-infrared bands for both sensors while the band multispectral camera also over-estimated the green peak reflectance. Reflectance factors de-rived from the RGB (R2=0.63) and converted near-infrared (R2=0.65) cameras resulted in lower accordance with refer-ence measurements. The UAV spectrometer system is capa-ble of providing narrow-band information for crop and pas-ture management. The six-band multispectral camera has the potential to be deployed to target specific broad wavebands if shortcomings in radiometric limitations can be addressed. Large-scale imaging of pasture variability can be achieved by either using a true colour or a modified near-infrared camera.
Data quality from UAV-based sensors can only be assured, if field protocols are followed and environmental conditions allow for stable platform behaviour and illumination.
1 Introduction
In the last decade, the use of unmanned aerial vehicles (UAVs) as remote sensing platforms has become increasingly popular for a wide range of scientific disciplines and appli-cations. With the development of robust, autonomous and lightweight sensors, UAVs are rapidly evolving into stand-alone remote sensing systems that deliver information of high spatial and temporal resolution in a non-invasive man-ner. UAV systems are particularly promising for precision agriculture where spatial information needs to be available at high temporal frequency and spatial resolution in order to identify in-field variability (Stafford, 2000; Seelan et al., 2003; Lelong et al., 2008; Nebiker et al., 2008; Link et al., 2013). Zhang and Kovacs (2012) provide a comprehensive review of unmanned aerial systems applied in precision agri-culture.
leading to an economical use of resources. The use of UAV-based sensors to detect water stress and quantify biomass and nitrogen content in crops and grasses has been demonstrated (Berni et al., 2008, 2009; Kawamura et al., 2011). Yield fore-casting in wheat (Jensen et al., 2007) and rice (Swain et al., 2010), rangeland management (Rango et al., 2009), leaf area index (LAI) and green normalized difference vegetation in-dex (NDVI) estimation in winter wheat (Hunt et al., 2010) and site-specific vineyard management (Turner, 2011; Prim-icerio et al., 2012b) have been accomplished using unmanned aerial platforms.
Proximal remote sensing methods can be used to detect pasture and crop biophysical parameters such as biomass, dry matter, fibre content, organic matter digestibility and macronutrient availability (nitrogen, phosphorus and potas-sium). Pasture monitoring approaches capable of measuring biophysical variables over the whole farm at a high spa-tial resolution allow for site-specific management decisions and optimum nutrient management (Sanches et al., 2012). While vegetation indices have been frequently applied for biomass and dry matter estimation (Mutanga, 2004; Duan et al., 2011; Vescovo et al., 2012), waveband-specific algo-rithms have been developed to estimate macronutrients (Mu-tanga and Skidmore, 2007; Pullanagari et al., 2012a, b).
In a pasture management context in New Zealand, where air- and spaceborne remote sensing methods are often lim-ited by frequent cloud cover, UAV-based remote sensing can potentially overcome some of those limitations. Recent de-velopments in commercially available lightweight and small digital cameras and multispectral sensors support precision nutrient management. However, these sensors need to be characterized and validated against state-of-the-art reference instruments. The extraction of quantitative information relies on thorough calibration procedures, good instrument charac-terization and a high standard of field operation.
Various studies have specifically evaluated multispectral sensors and consumer-grade digital cameras and assessed their potential for vegetation monitoring. The use of a con-ventional, ground-based broadband digital RGB camera has shown limited success in estimating green biomass on short-grass prairie, suggesting that narrow-band sensors are more promising for application over such complex ecosystems (Vanamburg et al., 2006). An image processing workflow for three consumer digital cameras has been developed by Lebourgeois et al. (2012) and they have suggested that the cameras have a high potential for terrestrial remote sensing of vegetation due to their versatility and multispectral ca-pabilities. Vegetation indices derived from visible and near-infrared imagery acquired by two compact digital cameras were found to generate strong relationships with crop bio-physical parameters and to be practical for monitoring of temporal changes in crop growth (Sakamoto et al., 2012). Kelcey and Lucieer (2012) developed a processing chain to improve the imagery acquired with the same six-band mul-tispectral sensor that was used in the current study. They
showed that image quality can be improved through appli-cation of sensor correction techniques to facilitate subse-quent image analysis. A novel, UAV-based lightweight high-resolution spectrometer, which was tested in the field for the first time in the current study, was introduced by Burkart et al. (2013). Nijland et al. (2014) evaluated the use of near-infrared (NIR) and RGB cameras for the use of vegetation monitoring and plant phenology trend detection and found that the NIR-converted cameras were outperformed by stan-dard RGB cameras. Poor band separation and the limited dy-namic range of the NIR camera system limited the use of the sensors for vegetation monitoring in a controlled laboratory and in a field experiment.
Studies usually deploy a single UAV sensing system over an area of interest. But because different agricultural ap-plications and environmental frameworks demand specific capabilities of an UAV remote sensing system, the current study uses four different sensors over the same experimental area to evaluate each sensor’s suitability for applied grass-land monitoring. From preliminary experiments, it was ev-ident that the UAV system, including platform and sensor, need to be specifically matched to the vegetation parameter to be investigated. The present study used two compact digi-tal cameras (RGB and NIR), a six-band multispectral camera (visible/near-infrared – VNIR) and a high-resolution spec-trometer (VNIR) mounted on two different UAV platforms to acquire spectral information over dairy pastures in order to characterise each instrument in terms of radiometric quality and accuracy of spectral information obtainable, as compared to a ground reference instrument. Handling and limitations of the UAVs, flight planning, field procedures and the capabil-ities of the different sensors are discussed as a prospective guideline for upcoming UAV sensor-based research. Results are evaluated with a focus on inter-sensor comparability, as-pects of field data collection using UAVs and the sensor’s capabilities for monitoring green vegetation.
1.1 Experimental site
The experimental flight campaign was conducted in Febru-ary 2013 on a Massey University dairy farm near Palmerston North, New Zealand, (No. 1 Dairy, located at lat.−40.376, long. 175.606). No. 1 Dairy is a fully operational dairy farm with an effective area of 119.7 ha. UAV flights were per-formed over four different paddocks with distinct character-istics from bare soil to dry and irrigated ryegrass pasture. At the time of data acquisition between 11:00 and 15:00 LT no clouds were visible.
1.2 UAV systems
Table 1. UAV platforms.
Name QuadKopter Falcon-8
Manufacturer MikroKopter Ascending Technologies
Weight [g] 1900 1800
Max. Payload [g] 1000 500
Power source LiPo, 4200 mAh, 14.8 V Lipo, 6400 mAh, 11.1 V
Endurance [min] 12 15
GPS navigation Ublox LEA 6s GPS chip Ublox LEA 6T
Features Open Source Gyro-stabilized camera mount Stabilized camera mount, live video link, motor redundancy
Sensors MCA6 UAV STS, RGB, Canon IR
Germany. The Falcon-8 uses the AscTec Autopilot Control V1.68 software. It has two identical exchangeable gimbals manufactured by AscTec, one for the Sony camera the other one for the spectrometer and Canon camera. Both gimbals are dampened and actively stabilized in pitch and roll. The MikroKopter UAV was fitted with an AV130 Standard Gim-bal produced by Photo Higher. The gimGim-balled camera mounts levelled out any platform movement to ensure the sensors were pointing in nadir direction to the ground at all times during the flight. The main difference between the Falcon-8 and the MikroKopter platforms is the payload restriction, which precludes the Falcon-8 from lifting sensors heavier than 0.5 kg, thus making it necessary to use the MikroKopter UAV to lift the Mini-MCA6 sensor. Both UAVs with their payloads were intensively tested on multiple flights before the study.
1.3 UAV sensors
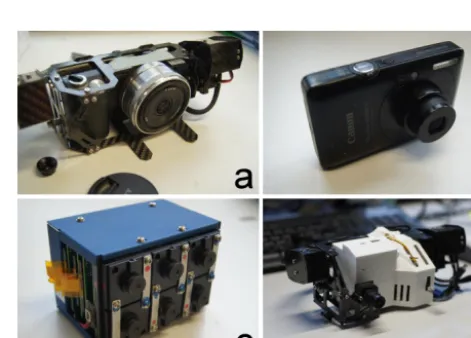
Four UAV sensors (Fig. 1) were tested and compared in terms of their ability to produce reflectance data over pastures. All of the sensors were lighter than 1 kg including batteries and were either modified or specifically designed for use on re-motely controlled platforms. The sensors share a spectral range in the VNIR which is considered the most relevant region of the electromagnetic spectrum for agricultural re-search applications (Lebourgeois et al., 2008). In terms of spatial and spectral resolution (Fig. 2), the sensors differ sig-nificantly. Table 2 lists their relevant properties.
Mini-MCA6 (MCA6): the Mini-MCA6 (Multispectral Camera Array) is a six-band multispectral camera (Tetra-cam, Chatsworth, CA, USA) that can acquire imagery in six discrete wavebands. A camera-specific image alignment file is provided by the manufacturer. Exchangeable filters in the range of 400 to 1100 nm can be fitted to six identical monochromatic cameras. Table 3 lists the filter setup used during the study. The camera firmware allows pre-setting all imaging related parameters such as exposure time, shutter release interval and image format and size. Six two giga-byte CompactFlash memory cards store up to 800 images (10 bit RAW format, full resolution). With an opening angle of 38.3◦×31.0◦, the camera has a relatively narrow field of
Figure 1. UAV-based sensors: (a) Sony Nex5n RGB camera (b)
Canon PowerShot IR camera (c) MCA6 multispectral camera (d) Spectrometer (UAV STS).
view as opposed to the Canon and Sony cameras. The camera was set to a 2 ms exposure time and was run on a 2 s shutter release interval with images saved in the 10 bit RAW format. Positioning of the camera was achieved by hovering the UAV over the vegetation target for at least 30 s per waypoint.
STS spectrometer (UAV STS): the spectrometer was adapted for UAV-based remote sensing at the Research Cen-tre Jülich. Its design is based on the STS VIS spectrometer (Ocean Optics, Dunedin, FL, USA) with the addition of a micro-controller to enable remote triggering and saving of spectral data. The spectrometer operated on an independent power source and its low weight and fine spectral resolution made it ideal for use on an UAV. The full specifications, cal-ibration efforts and validation of the STS spectrometer are presented in Burkart et al. (2013). An identical spectrometer, on the ground, acquired spectra of incoming radiance every time the airborne sensor was triggered. Spectra were saved on a micro SD card.
[image:3.612.310.546.213.382.2]Figure 2. Spectral sensitivity of the four sensors. Spectral bands are
indicated by different colours.
the common Bayer matrix (Bayer, 1976; Hirakawa et al., 2007) and hot mirror used in consumer digital cameras.
Canon PowerShot camera: the Canon PowerShot SD780 IS is a consumer digital camera that has been professionally (LDP LLC, Carlstadt, US) converted to acquire near-infrared imagery. The near-infrared filter has been replaced with a red-light-blocking filter. Again, the spectral response of the camera is based on the Bayer pattern colour filter array. Cus-tomized CHDK (Canon Hack Development Kit) firmware allows running the camera in a continuous capture mode at specific time intervals (2 s, user defined). Camera acquisition was set to automatic as time constraints and UAV batteries did not allow for accurate manual configuration of white bal-ance, aperture, ISO and shutter speed. Images were saved as JPEGs. A live video link from the UAV’s on-board camera enabled precise positioning of the RGB and infrared cameras over the ryegrass pastures. The main difference to the MCA6 is the inability to adjust filter settings and the camera’s band-widths. According to manufacturer information each band has an approximate width of 100 nm.
1.4 Ground-based sensors
ASD HandHeld 2 based reference sensor: ground-based spectral measurements were acquired with an ASD HandHeld 2 portable spectroradiometer (Analytical Spectral Devices, Inc., Boulder, Colorado, US). The device covers a spectral range from 325 nm to 1075 nm which makes it suitable for comparison with all UAV sensors flown in this study. At 700 nm the device has a spectral resolution of 3 nm and the field of view equates to 25◦. A Spectralon® panel (Spectralon®, Labsphere, Inc., North Sutton, NH, USA) was used to acquire white reference measurements before each target measurement. Each target was measured 10 times from 1 m distance while moving over the area of interest.
1.5 Flight planning and data acquisition procedure
Taking into account the operational requirements of each sensor and flying platform, a detailed flight plan was devel-oped. Eight sampling locations defined by waypoints were
selected from overview images and supported by an in situ visual assessment of the paddock. A focus was put on cov-ering a wide range of pasture qualities from dry to fully ir-rigated ryegrass pastures. Waypoints were selected in pad-dock areas with homogeneous pasture cover. This ensured that each waypoint can be considered representative for the area of the paddock it is located in, and it aided dealing with the different sensor footprint sizes (Table 4).
Each sampling location was marked with a tarpaulin square, which was clearly visible in all spectral bands of the aerial images. In order to avoid interference effects of the markers with the UAV STS measurements, they were re-moved before acquisition of spectra. Next to the first way-point, a calibration site with coloured tarpaulin squares was set-up and measured with the ASD HandHeld 2.
The sensors were flown over the targets in the following order: (1) RGB camera for an overview shot, (2) IR camera for an overview shot, (3) MCA6 over calibration sites (black, grey, white and red tarpaulins black foam material, bare soil) and waypoints and (4) UAV spectrometer over waypoints. Overview images cover all sampling locations in an area with a single shot from 100 to 150 m flying height. MCA6 images were taken from 25 m above the ground. UAV STS data were collected from a height of 10–15 m, and 15 spec-tra were taken over each waypoint. During the experiment, the Falcon-8 was flown in semi-autonomous GPS mode. Co-ordinates of the sampling locations were recorded with a low-accuracy GPS (Legend, HTC, Taoyuan, Taiwan). The Falcon-8 used those coordinates to autonomously reach the marker locations. Over each sampling location, the flight mode was then switched to manual and the UAV was po-sitioned over the target as accurately as possible using a live video link. The UAV STS and the live camera were on the same stabilized gimbal and aligned in a way, that the cen-tre of the FPV camera approximates the UAV STS’s field of view. The QuadKopter was flown in manual mode during the entire experiment. In test flights preceding this experiment, it was found that the GPS on board of the MikroKopter was not accurate enough to position the sensor over a waypoint.
Flights were conducted consecutively to minimize vari-ability due to changing illumination and vegetation status. Figure 3 depicts raw data from the imaging sensors be-fore any processing has been applied. Bebe-fore the flight of the UAV spectrometer, ASD ground reference measurements were taken at each waypoint.
1.6 Data processing
Data from each sensor underwent calibration and correction procedures.
Table 2. Sensor properties.
Name Sony Nex5n RGB Canon Powershot IR MCA6 STS
Company Sony – modified Canon – modified Tetracam Ocean Optics – modified Type RGB camera integrated VIS+Infrared camera Multispectral Imager with Spectroradiometer with additional
in the Falcon-8 UAV 6 bands of 10 nm width electronics for remote control Field of View 73.7◦×53.1◦ 57.2◦×40◦ 38.3◦×31.0◦ 12◦
Spectral bands 3 3 6 256
Spectral range Blue, Green, Red Blue, Green, IR 450–1000 nm 338–824 nm
Image size 4912×3264 4000×3000 1280×1024 n/a
Image format JPEG JPEG RAW n/a
Dynamic Range 8 bit 8 bit 10 bit 14 bit
Weight [g] 500 100 790 216
Handling Wireless trigger, live view Interval mode Interval mode Wireless trigger, live view
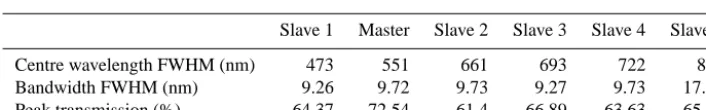
Table 3. MCA6 filter specifications.
Slave 1 Master Slave 2 Slave 3 Slave 4 Slave 5
Centre wavelength FWHM (nm) 473 551 661 693 722 831
Bandwidth FWHM (nm) 9.26 9.72 9.73 9.27 9.73 17.81
Peak transmission (%) 64.37 72.54 61.4 66.89 63.63 65.72
show the target area. As a result, between 6 and 15 images per target were found to be suitable for further image pro-cessing (total of 109 images) and two images showing the tarpaulin areas and bare soil were selected for reflectance factor calibration. From there, RAW image processing was done in Matlab (The MathWorks Inc., 2011). Both the cali-bration images and the vegetation target images were noise corrected and vignetting effects were removed for each of the six cameras (Yu, 2004; Olsen et al., 2010; Kelcey and Lu-cieer, 2012). A sensor correction factor was applied to each filter based on filter sensitivity factory information (Kelcey and Lucieer, 2012).
UAV STS: as described in Burkart et al. (2013) a temperature-based dark current correction (Kuusk, 2011) and an inter-calibration of the air- and ground-based spectrome-ter were applied before derivation of reflectance factors.
Sony RGB Camera: the red, green and blue bands were calibrated to a reflectance factor with the empirical line method (Smith and Milton, 1999; Baugh and Groeneveld, 2008) relating the ASD reflectance over the coloured refer-ence tarpaulins (Fig. 3) to real reflectance (Aber et al., 2006). Canon infrared camera: the camera was corrected using the same method as for the RGB camera, but with the centre wavelengths adapted to the infrared sensitive pixels.
The images that show the tarpaulin and the bare soil were selected as calibration images and processed separately. The white and the red tarpaulins were excluded from analysis due to pixel saturation and high specular reflection. For each of the calibration surfaces (black, grey, black foam and bare soil) a subset image area was defined from which the pixel values for the empirical line method were derived.
For each calibration target, ten ASD reference spectra were convolved to the spectral response of the Mini-MCA6 (see Spectral Convolution). The empirical line method was applied to establish band-specific calibration coefficients. Using those coefficients, the empirical line method was ap-plied to each vegetation target image on a pixel-by-pixel ba-sis, thus converting digital numbers of the image pixels to a surface reflectance factor.
In order to extract the footprint area over which ground ASD and UAV spectrometer data had been acquired, the rel-evant image area was identified and extracted from each im-age by identifying the markers in the imim-age. Footprints were matched between sensors by defining a 0.3 by 0.3 m area be-low the waypoint marker as the region of interest. An average reflectance factor was calculated for each footprint resulting in between 6 and 15 values per sample location for the MCA6 images. Standard deviations, mean and median were calcu-lated for each waypoint.
ASD HandHeld 2 ground reference sensor: ASD Hand-Held 2 spectral binary files were downloaded and converted to reflectance using the HH2Sync software package (Version 1.30, ASD Inc.). Spectral data were then imported into the spectral database SPECCHIO (Hueni et al., 2009).
[image:5.612.121.474.260.315.2]Table 4. Optical sensor footprint properties.
UAV STS MCA6 Canon IR Sony RGB ASD
Footprint shape Circular Rectangular Rectangular Rectangular Circular
Footprint size [Sensor height (m)] Ø 2.1 m [10] 17.3×13.9 m [25] 109.0×72.8 m [100] 149.9×99.9 m [100] Ø 0.44 m [1]
Number of pixels n/a 1280×1024 4000×3000 4912×3264 n/a
Ground resolution (m) n/a 0.0135 0.0273 0.0305 n/a
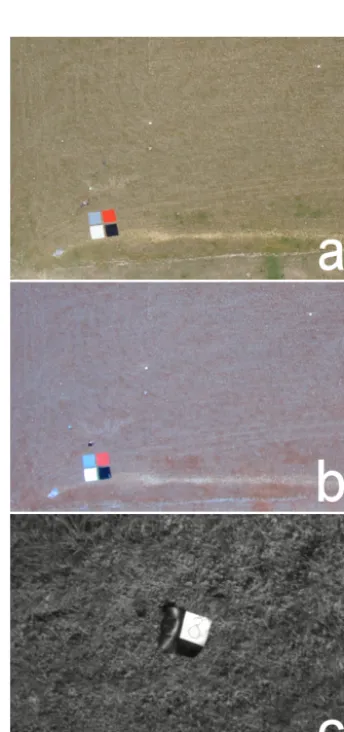
Figure 3. Raw data from the imaging sensors (a) RGB camera at
100 m altitude, (b) IR camera at 100 m altitude, (c) MCA6 at 25 m altitude (red band). The images show the region of interest cropped from a larger image. White points represent the tarpaulin waypoint markers.
convolution range (nm) of each band was based on±3σ of the Gaussian function and applied at the wavelength posi-tions where an ASD band occurred, i.e. at every nanometre. It must be noted that the results of this convolution cannot truly emulate the actual system response of the STS as the ASD sampled input spectra are already a discrete represen-tation of the continuous electromagnetic spectrum and are
hence already inherently smoothed by the measurement pro-cess of the ASD.
In a similar manner, MCA6 bands were simulated, but hav-ing replaced the Gaussian assumption of the SRFs with the spectral transmission values (Table 3) digitized from ana-logue figures supplied by the filter manufacturer (Andover Corporation, Salem, US).
Rk= m P
j=n
cjRj m P
j=n
cj
, (1)
where Rk=reflectance factor of Ocean Optics band k,
Rj=reflectance factor of ASD bandj,cj=weighting
coef-ficient based on the Ocean Optics STS, spectral responsivity at wavelength of ASD bandj,n:m=convolution range of Ocean Optics bandk.
2 Results
MCA6 and UAV STS: calibrated reflectance factors of the UAV spectrometer and the MCA6 were compared to calcu-lated ASD reflectance values using linear regression analysis. The UAV STS and the ASD HandHeld 2 were compared over the whole STS spectrum, while the MCA6 was compared to the ASD in its six discrete bands.
[image:6.612.81.253.164.530.2]Figure 4. Reflectance of the spectral sensors ASD (black), MCA6 (blue) and UAV STS (red) as measured over the exemplary waypoints 2
and 8. SD in dotted lines for the ASD and UAV STS and with error bars for the 6 bands of the MCA6.
Table 5. Correlation matrix of the optical sensors (R2). Values were calculated for corresponding bands of each sensor pair over all way-points. Number of images (n) is given in brackets.
RGB IR MCA6 UAV STS
RGB 1
IR 0.913 (16) 1
MCA6 0.377 (16) 0.945 (16) 1
UAV STS 0.681 (24) 0.891 (24) 0.826 (48) 1 ASD 0.674 (24) 0.647 (24) 0.924 (48) 0.978 (3856)
red edge, both UAV sensors detected a lower signal in the same region of the spectrum.
The mean MCA6-derived spectra showed an increase in reflectance in the green peak region of the vegetation spec-trum that is approximately 0.05 % higher than in the same re-gion of the UAV spectrometer. The slope between the green and the red bands is positive for both sensors demonstrat-ing the dried, stressed state of the vegetation at waypoint 2. While MCA6 bands show low correlations with the UAV STS and the ASD for the 551 nm and the 661 nm bands, its values are in line with the other sensors in the red-edge re-gion of the spectra.
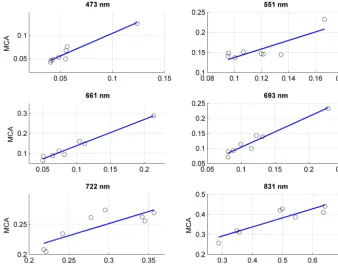
The MCA6 correlates significantly with ASD-derived re-flectance (R20.92, Fig. 5, Table 5) when compared over all eight waypoints and over all six-bands (n=48). Shortcom-ings of spectral accuracy of the MCA6 are revealed when comparing band reflectance values over different sample lo-cations and per waypoint (Fig. 6). The green band (551 nm) achieves lowest correlations with ASD convolved reflectance values (R2=0.68), with MCA6 reflectance factors overesti-mated for all waypoints. The remaining five bands show cor-relations withR2between 0.70 (722 nm) and 0.97 (661 nm). Overall, the MCA6 overestimates bands below the red edge, while it shows low deviations from the STS- and the ASD-derived reflectance values for the red-edge bands. Due to the low number of waypoints, the blue-, green- and red-band correlations need to be interpreted with caution. With an
Figure 5. Reflectance comparison of UAV-based sensors to
con-volved ASD-derived reflectance showing data over all eight sam-ple locations and spectra (MCA6n=48, STSn=120). MCA6 vs. ASD (blue):R2=0.92, slope of linear regression: 0.6691, offset: 0.0533. STS vs. ASD (red):R2=0.98, slope of linear regression: 0.6522, offset: 0.0142.
R2of 0.98, the UAV spectrometer strongly correlates to the reflectance derived from the ASD when compared over all waypoints (Table 4). Even though the trend of the spectra is similar to the ASD ground truth, differences are visible in the magnitude of the reflectance mainly in the near-infrared.
RGB and NIR camera: as can be seen in Table 4, the cor-relation between the RGB and IR cameras results in anR2
[image:7.612.309.544.246.433.2]Figure 6. Comparison of reflectance values between MCA6 and convolved ASD reflectance for each MCA6 band. 473 nm:R2=0.93, regression slope (RS): 0.9783; 551 nm:R2=0.68, RS: 1.0654; 661 nm:R2=0.97, RS: 1.311; 693 nm:R2=0.95, RS: 1.0225; 722 nm: R2=0.7, RS: 0.4009; 831 nm:R2=0.8, RS: 0.4516.
3 Discussion
MCA6: when compared to the UAV spectrometer and the ground reference data, the MCA6 filters performed well in the red-edge region of the electromagnetic spectrum. This observation is supported by the CMOS sensor relative sen-sitivity which is over 90 % in the red-edge and the near-infrared bands according to factory information (Tetracam Inc.). The largest deviations were observed in the green band, where the MCA6 consistently overestimates vegetation re-flectance factors. In sample locations with low biomass cover and/or stressed pastures, this results in a negative slope be-tween the red bands. The sensor’s performance is further im-paired when high soil background reflectance is present, as is the case for the first three waypoints and the bare soil cal-ibration target. While the green peak in the UAV STS and ASD measurements is barely visible over waypoint 2 but pro-nounced for waypoint 8, the MCA does not pick up on that feature. Green-band reflectance is overestimated for the drier pasture, while deviations from the other sensors’ measure-ments over irrigated, greener pasture are lower. Those differ-ences must be put down to radiometric inconsistencies in the MCA6 and potential calibration issues and it suggests that with the current filter setup, the MCA6 cannot be regarded as suitable for remote sensing of biochemical constituents and fine-scale monitoring of vegetation variability. Another com-plexity can be seen in the near-infrared regions of the derived
spectra. For the UAV STS, MCA6 and the ASD, the variabil-ity of measured reflectance factors increases. This discrep-ancy is likely to arise from a combination of areas of dif-ferent spatial support in terms of the sensor’s field-of view (FOV) and calibration biases (sensor and reflectance calibra-tion). Further investigation into sensor performance over tar-gets with complex spectral behaviour must be conducted in order to evaluate the spectral performance of those bands. The number of waypoints visited was not high enough to fully assess the performance of the four lower MCA6 bands as can be seen in Fig. 6. Due to the statistical distribution of the data points, a definite statement on the performance of those bands is not possible. The empirical line method used for reflectance calibration introduces further errors because only one calibration image was acquired over the entire mea-surement procedure. Reflectance factor reliability can be im-proved by more frequent acquisition of calibration images.
main source of discrepancies between the ASD and STS measurements can be attributed to inconsistencies in foot-print matching due to using a live feed from a camera that can only approximate the spectrometer’s field of view. By choosing homogeneous surfaces and averaging over multi-ple measurements, parts of the problems arising from foot-print were addressed in this study. However the matching of the footprint of two different spectrometers can go beyond comparing circles and rectangles due their optical path as re-cently shown by MacArthur et al. (2012). A more thorough inter-comparison of the ASD and the particular Ocean Optics device employed on the UAV will be required in the future.
RGB and NIR cameras: an empirical line calibration was used for the reflectance factor estimation of both consumer RGB and infrared-modified cameras. Although correlations between the digital cameras and the high-resolution spec-trometers exist, they must be treated with caution. This is due to the unknown radiometric response of the cameras, band overlaps and the inherent differences between simple digital cameras and numerical sensors. Both cameras pro-vide imagery with high on-ground resolution, thus enabling identification of in-field variations. In terms of the NIR cam-era, the wide bandwidth and limited information on the spec-tral response call for cautious use and further evaluation if the camera is to be used for quantitative vegetation monitor-ing. At this stage, this study can only suggest that the sen-sor might be used for support of visual paddock assessment and broadband vegetation indices. Nevertheless, the results demonstrate the opportunities these low-budget sensors offer for simple assessment of vegetation status over large areas using UAVs. If illumination conditions enable an empirical line calibration, reasonable three-band reflectance results can be calculated. Further improvements of radiometric image quality can be expected from fixed settings of shutter speed, ISO, white balance and aperture, as well as for the use of the RAW format. A calibration of lens distortion and vignetting parameters could further increase the quality, especially in the edges of the image (Yu, 2004). However, operational ef-ficiency increases with automatic camera settings which only varied minimally due to the stable illumination conditions at the time of the study.
The empirical line method that was used for reflectance calibration was based on some simplifications. Variations in illumination and atmospheric conditions require frequent calibration image acquisition in order to produce accurate ra-diometric calibration results. Due to the conservative man-agement of battery power and thus relatively short flight times, only one MCA6 flight was conducted to acquire an im-age of the calibration tarpaulins and the bare soil. The same restriction applies to the quality of the radiometric calibra-tion of the RGB and IR camera. The use of colour tarpaulin surfaces as calibration targets has implications on the qual-ity of the achieved reflectance calibration in this study. Al-though they provide low-cost and easy-to-handle calibration surfaces, they are not as spectrally flat as would be needed for
a sensor calibration with minimum errors. Moran et al. (2001, 2003) have investigated the use of chemically treated canvas tarpaulins and painted targets in terms of their suitability as stable reference targets for image calibration to reflectance and introduce measures to ensure optimum calibration re-sults. They concluded that specially painted tarps could pro-vide more suitable calibration targets for agricultural appli-cations.
Discrepancies in measured reflectance factors between the UAV STS, the MCA6 and the ASD arise from a combina-tion of factors. Foremost, inherent differences in their spec-tral and radiometric properties lead to variations in measured reflectance factors. Deviations in footprint matching between the STS spectrometer and the ground measurements, al-though kept to a minimum, lead to areas of different spa-tial support and cannot be fully eliminated. Another dimen-sion to this complexity is added by the UAVs and the camera gimbals. Although platform movements were minimal due to the stable environmental conditions and the compensation of any small platform instabilities by the camera gimbals, a small variability in measured radiant flux must be attributed to uncertainties in sensor viewing directions. For a com-plete cross-calibration between the UAV-based and ground sensors, these potential error sources need to be quantified. Within the context of evaluating sensors for their usabil-ity and potential for in-field monitoring of vegetation, those challenges were not addressed in the current study.
In-field data acquisition and flight procedures, one of the key challenges in accommodating four airborne sensors over the same area of interest is accurate footprint matching and minimizing any errors that are introduced by this complexity. Camera gimbals, on board GPS software, piloting skills and waypoint selection maximized footprint matching between sensors. The Falcon-8 UAV was capable of a very stable hover flight over the area of interest while the MikroKopter UAV required manual piloting to ensure that it hovered over the area of interest. The tarpaulin markers were invaluable as a visual aid both during piloting of the UAVs and during sub-sequent image processing for identifying the footprint areas in each image. Because of the need to select waypoints that were representative for a large area of the paddock, the sta-ble hovering behaviour of the Falcon-8 ensured that the UAV spectrometer’s footprint was comparable to the other sen-sors’ field of view. Although the described measures and pre-cautions enabled confident matching of footprints, they can only be applied when working in homogeneous areas of pas-ture and vegetation cover. Confounding factors, such as soil background influence, large variations in vegetation cover in-side the footprint area and strong winds that destabilise the platform, will compromise accurate footprint matching.
the wind speed at which a flight must be interrupted is con-siderably lower. Platform stability, altitude control and foot-print matching accuracy between sensors are compromised under high winds. The fact that two different UAV plat-forms had been used potentially introduces more variabil-ity that cannot be quantified. However, the aforementioned payload restrictions make the use of two different platforms inevitable. Due to the fast progress in UAV platform devel-opment, this intricacy is likely to be irrelevant in the future as platforms become more versatile and adaptable to accom-modate various sensor requirements.
Technical specifications of UAVs: both UAVs were pow-ered with lithium polymer (LiPo) batteries. A fully charged battery enabled flying times of approximately 10 min for the payload carried. With only four batteries available for each UAV, this lead to a data acquisition time frame of about 40 min per flying platform. However, because turbulence, unplanned take offs and landings and inaccurate GPS posi-tions frequently required revisiting a waypoint, the total num-ber of sample locations that could be investigated between 11:00 and 15:00 LT when illumination conditions were most favourable, was low. This makes thorough flight planning, marking of waypoints and efficient collection of ground ref-erence data essential. Due to the non-availability of power outlets and the time it takes to fully recharge a LiPo battery, battery life limits the time frame in which airborne data can be collected. At the time of the study, higher powered LiPo batteries were still too heavy, thus neutralizing a gain in flight time due to the high weight of the more powerful battery. Those restrictions can slow down data acquisition consider-ably and the number of ground sampling locations is limited. In the future, improvements in platform stability and elec-tronics as well as higher powered batteries will enable larger ground coverage by UAVs. Using in-field portable charging options such as powered from car batteries can significantly enhance the endurance of rotary wing UAVs.
The evaluated UAV sensors differ in their suitability for deployment in vegetation monitoring and more specifically pasture management applications. While high spectral ac-curacy is essential for quantifying parameters such as nutri-tional status in crops and pastures, the high spatial resolution imaging ability of digital cameras can be used to assess pad-docks and fields with regard to spatial variations that may not be visible to a ground observer.
Usability of sensors: the UAV STS spectrometer with its high spectral resolution can be used to derive narrow-band vegetation indices such as the PRI (photochemical re-flectance index) (Suarez et al., 2009) or TSAVI (transformed soil adjusted vegetation index) (Baret et al., 1989). Fur-thermore, its narrow bands facilitate identification of wave-bands that are relevant for agricultural crop characterization (Thenkabail et al., 2002). Once those centre wavelengths have been identified, a more broadband sensor such as the MCA6 could target crop and pasture characteristics with spe-cific filter setups provided the MCA6 performance can be
en-hanced in terms of radiometric reliability. The consumer dig-ital cameras seem to be useful for derivation of broadband vegetation indices such as the green NDVI (Gitelson et al., 1996) or the GRVI (Motohka et al., 2010). Identification of wet and dry areas in paddocks and growth variations are fur-ther applications that such cameras can cover. Imaging sen-sors that identify areas in a paddock that need special atten-tion are extremely useful, and although they do not provide the high spectral resolution of the UAV STS spectrometer, they do give a visual indication of vegetation status.
Challenges and limitations: deploying UAVs is a promis-ing new approach to collect vegetation data. As opposed to ground-based proximal sensing methods, UAVs offer non-destructive and efficient data collection and less accessible areas can be imaged relatively easy. Moreover, UAVs can po-tentially provide remote sensing data when aircraft sensors and satellite imagery are unavailable. However, three main factors can cause radiometric inconsistencies in the measure-ments: sensors, flying platforms and the environment.
The sensors mounted on the UAVs introduce the largest level of uncertainty in the data. Radiometric aberrations across the camera lenses can be addressed by a flat field-correction of the images.
Further factors are camera settings. In this study, shutter speed, exposure time and ISO were set on automatic because of the clear sky and stable illumination conditions. However, to facilitate extraction of radiance values and quantitative in-formation on the vegetation, these settings need to be fixed for all the flights in order to make the images comparable.
The RAW image format is recommended when attempting to work with absolute levels of radiance as it applies the least alterations to pixel digital numbers.
Furthermore, footprint matching between sensors with dif-ferent sizes and shapes is challenging. While it is straight-forward for imaging cameras with rectangular shaped foot-prints, matching measurements between the UAV STS, ASD and the imaging sensors can only be approximated. While footprint shape is fixed, the size can be influenced by the fly-ing altitude above ground.
However, it is also important to be aware of any bidi-rectional effects that are introduced as a result of the cam-era lens’ view angle and illumination direction (Nicodemus, 1965).
The environment also needs to be considered for the col-lection of robust radiometric data. Even if all other factors are perfect, winds or wobbling of the platform caused by, e.g., a motor imbalance or a bad GPS position hold can cause the sensor to direct its FOV to the wrong spot. In terms of the imaging cameras this is again simple to check after im-age download whereas the UAV STS data might possibly not show any deviations in the data.
With a good knowledge of the sensors characteristics and the necessary ground references an UAV operator will be able to acquire satisfying data sets, if the environmental con-ditions are opportune. Based on a tested UAV with known uncertainties in GPS and gimbal accuracy the data set can be quality flagged and approved for further analysis.
4 Conclusions
UAVs are rapidly evolving into easy-to-use sensor platforms that can be deployed to acquire fine-scale vegetation data over large areas with minimal effort. In this study, four op-tical sensors, including the first available UAV-based micro-spectrometer were flown over ryegrass pastures and cross-compared. Overall, the quality of the reflectance measure-ments of the UAV sensors is dependent on thorough data ac-quisition processes and accurate calibration procedures. The novel high-resolution STS spectrometer operates reliably in the field and delivers spectra that show high correlations to ground reference measurements. For vegetation analysis, the UAV STS holds potential for feature identification in crops and pastures as well as the derivation of narrow-band veg-etation indices. Further investigations and cross-calibrations are needed, mainly with regard to the near-infrared measure-ments in order to establish a full characterization of the sys-tem. It was also demonstrated that the six-band MCA6 cam-era can be used as a low spectral resolution multispectral sen-sor with the potential to deliver high-resolution multispectral imagery. In terms of its poor radiometric performance in the green and near-infrared filter regions, it is evident that the sensor needs further testing and correction efforts to elim-inate the error sources of these inconsistencies. Over sam-ple locations with low vegetation cover and strong soil back-ground interference, the MCA6 image data needs to be pro-cessed with caution. Individual filters must be assessed fur-ther, with a focus on the green and NIR regions of the elec-tromagnetic spectrum. Any negative effects that depreciate data quality, such as potentially unsuitable calibration targets (coloured tarpaulins) need to be identified and further exam-ined in order to guarantee high quality data. If those issues can be addressed and the sensor is equipped with relevant fil-ters, the MCA6 can become a useful tool for crop and pasture monitoring. The modified Canon infrared and the RGB Sony camera have proven to be easy-to-use sensors that deliver in-stant high-resolution imagery covering a large spatial area. No spectral calibration has been performed on those sensors,
but factory spectral information allowed converting digital numbers to a ground reflectance factor. Near-real-time as-sessment of variations in vegetation cover and identification of areas of wetness/dryness as well as calculation of broad-band vegetation indices can be achieved using these cameras. A number of issues have been identified during the field ex-periments and data processing. Exact footprint matching be-tween the sensors was not achieved due to differences in the FOVs of the sensors, instabilities in UAV platforms during hovering and potential inaccuracies in viewing directions of the sensors due to gimbal movements. Although those dif-ferences in spatial scale reduce the quality of sensor inter-comparison, it must be stated that under field conditions a complete match of footprints between sensors is not achiev-able. For the empirical line calibration method that was ap-plied to the MCA6 and the digital cameras, we propose the use of spectrally flat painted panels for radiometric calibra-tion rather than tarpaulin surfaces. To reduce complexity of the experiment and keep the focus on the practicality of de-ploying multiple sensors on UAVs, the influence of direc-tional effects has been neglected.
The field protocols developed allow for straightforward field procedures and timely coordination of multiple UAV-based sensors as well as ground reference instruments. The more autonomously the UAV can fly, the more focus can be put on data acquisition. Piloting UAVs in a field where ob-stacles such as power lines and trees are present requires the full concentration of the pilot and at least one support per-son to observe the flying area. Due to technical restrictions, the total area that can be covered by rotary wing UAVs is still relatively small, resulting in a point sampling strategy. Higher powered, lightweight batteries on UAVs can allow for more frequent calibration image acquisition and the coverage of natural calibration targets, thus improving the radiometric calibration. Differences in UAV specifications and capabili-ties lead to the UAVs having a specific range of applications that they can undertake reliably.
hours of data acquisition and thus enable the adjustment of management strategies based on highly current information.
Acknowledgements. The research was supported by a Massey
Uni-versity doctoral scholarship granted to S. von Bueren and a travel grant from COST ES0903 EUROSPEC to A. Burkart. The authors acknowledge the funding of the CROP.SENSe.net project in the context of Ziel 2-Programmes NRW 2007–2013 “Regionale Wet-tbewerbsfähigkeit und Beschäftigung (EFRE)” by the Ministry for Innovation, Science and Research (MIWF) of the state of North Rhine–Westphalia (NRW) and European Union Funds for regional development (EFRE) (FKZ 005-1012-0001) while collaborating on the preparation of the manuscript.
All of us were shocked and saddened by the tragic death of Stefanie von Bueren on 25 August. We remember her as an enthusiastic adventurer and aspiring researcher.
Edited by: M. Rossini
This publication is supported by COST – www.cost.eu
References
Aber, J. S., Aber, S. W., Pavri, F., Volkova, E., and Penner II, R. L.: Small-format aerial photography for assessing change in wetland vegetation, Cheyenne Bottoms, Kansas, Transactions of the Kansas Academy of Science, 109, 47–57, doi:10.1660/0022-8443(2006)109[47:sapfac]2.0.co;2, 2006.
Baret, F., Guyot, G., and Major, D. J.: TSAVI: A Vegetation Index Which Minimizes Soil Brightness Effects On LAI And APAR Estimation, Geoscience and Remote Sensing Symposium, 1989, IGARSS’89, 12th Canadian Symposium on Remote Sensing, In-ternational, 1355–1358, 1989.
Baugh, W. M. and Groeneveld, D. P.: Empirical proof of the empirical line, Int. J. Remote Sens., 29, 665–672, doi:10.1080/01431160701352162, 2008.
Bayer, B. E.: Color imaging array, 1976.
Berni, J., Zarco-Tejada, P., Surez, L., González-Dugo, V., and Fer-eres, E.: Remote sensing of vegetation from uav platforms us-ing lightweight multispectral and thermal imagus-ing sensors, The International Archives of the Photogrammetry, Remote Sensing and Spatial Information Sciences, XXXVII, 2008.
Berni, J. A. J., Zarco-Tejada, P. J., Suarez, L., and Fereres, E.: Ther-mal and Narrowband Multispectral Remote Sensing for Vege-tation Monitoring From an Unmanned Aerial Vehicle, Ieee T. Geosci. Remote, 47, 722–738, doi:10.1109/Tgrs.2008.2010457, 2009.
Burkart, A., Cogliati, S., Schickling, A., and Rascher, U.: A novel UAV-based ultra-light weight spectrometer for field spectroscopy, Sensors Journal, IEEE, 14, 62–67, doi:10.1109/jsen.2013.2279720, 2013.
Carrara, M., Comparetti, A., Febo, P., and Orlando, S.: Spatially variable rate herbicide application on durum wheat in Sicily, Biosys. Eng., 87, 387–392, 2004.
Chávez, J. L., Pierce, F. J., Elliott, T. V., Evans, R. G., Kim, Y., and Iversen, W. M.: A remote irrigation monitoring and control
sys-tem (RIMCS) for continuous move syssys-tems. Part B: Field testing and results, Precis. Agric., 11, 11–26, 2010.
Duan, M., Gao, Q., Wan, Y., Li, Y., Guo, Y., Ganzhu, Z., Liu, Y., and Qin, X.: Biomass estimation of alpine grasslands under dif-ferent grazing intensities using spectral vegetation indices, Can. J. Remote Sens., 37, 413–421, 2011.
Gitelson, A. A., Kaufman, Y. J., and Merzlyak, M. N.: Use of a green channel in remote sensing of global vegetation from EOS-MODIS, Remote Sens. Environ., 58, 289–298, 1996.
Hirakawa, K., Wolfe, P. J., and Ieee: Spatio-spectral color filter array design for enhanced image fidelity, in: 2007 Ieee International Conference on Image Processing, Vols 1–7, IEEE International Conference on Image Processing ICIP, 645–648, 2007.
Hueni, A., Nieke, J., Schopfer, J., Kneubühler, M., and Itten, K. I.: The spectral database SPECCHIO for improved long-term usability and data sharing, Comput. Geosci., 35, 557–565, doi:10.1016/j.cageo.2008.03.015, 2009.
Hunt, E. R., Hively, W. D., Fujikawa, S. J., Linden, D. S., Daughtry, C. S. T., and McCarty, G. W.: Acquisition of NIR-Green-Blue Digital Photographs from Unmanned Aircraft for Crop Monitor-ing, Remote Sens., 2, 290–305, doi:10.3390/Rs2010290, 2010. Jensen, T., Apan, A., Young, F., and Zeller, L.: Detecting the
at-tributes of a wheat crop using digital imagery acquired from a low-altitude platform, Comput. Electron. Agr., 59, 66–77, doi:10.1016/j.compag.2007.05.004, 2007.
Kawamura, K., Sakuno, Y., Tanaka, Y., Lee, H.-J., Lim, J., Kurokawa, Y., and Watanabe, N.: Mapping herbage biomass and nitrogen status in an Italian ryegrass (Lolium multiflorum L.) field using a digital video camera with balloon system, J. Appl. Remote Sens., 5, 053562, doi:10.1117/1.3659893, 2011. Kelcey, J. and Lucieer, A.: Sensor Correction of a 6-Band
Mul-tispectral Imaging Sensor for UAV Remote Sensing, Remote Sens., 4, 1462–1493, 2012.
Kenta, T. and Masao, M.: Radiometric calibration method of the general purpose digital camera and its application for the vegetation monitoring, Land Surf. Remote Sens., 8524, doi:10.1117/12.977211, 2012.
Kuusk, J.: Dark Signal Temperature Dependence Correction Method for Miniature Spectrometer Modules, J. Sens., 2011, 608157, 2011.
Lebourgeois, V., Bégué, A., Labbé, S., Mallavan, B., Prévot, L., and Roux, B.: Can commercial digital cameras be used as multi-spectral sensors? A crop monitoring test, Sensors, 8, 7300–7322, 2008.
Lebourgeois, V., Begue, A., Labbe, S., Houles, M., and Mar-tine, J. F.: A light-weight multi-spectral aerial imaging sys-tem for nitrogen crop monitoring, Precis. Agric., 13, 525–541, doi:10.1007/s11119-012-9262-9, 2012.
Lelong, C. C. D., Burger, P., Jubelin, G., Roux, B., Labbe, S., and Baret, F.: Assessment of unmanned aerial vehicles imagery for quantitative monitoring of wheat crop in small plots, Sensors, 8, 3557–3585, doi:10.3390/S8053557, 2008.
MacArthur, A., MacLellan, C. J., and Malthus, T.: The fields of view and directional response functions of two field spectroradiome-ters, IEEE Geosci. Remote Sens., 50, 3892–3907, 2012. Moran, M. S., Bryant, R. B., Clarke, T. R., and Qi, J. G.:
Deploy-ment and calibration of reference reflectance tarps for use with airborne imaging sensors, Photogram. Eng. Rem. S., 67, 273– 286, 2001.
Moran, S., Fitzgerald, G., Rango, A., Walthall, C., Barnes, E., Bausch, W., Clarke, T., Daughtry, C., Everitt, J., Escobar, D., Hatfield, J., Havstad, K., Jackson, T., Kitchen, N., Kustas, W., McGuire, M., Pinter, P., Sudduth, K., Schepers, J., Schmugge, T., Starks, P., and Upchurch, D.: Sensor development and radio-metric correction for agricultural applications, Photogram. Eng. Rem. S., 69, 705–718, 2003.
Motohka, T., Nasahara, K. N., Oguma, H., and Tsuchida, S.: Ap-plicability of green-red vegetation index for remote sensing of vegetation phenology, Remote Sensing, 2, 2369–2387, 2010. Mutanga, O.: Hyperspectral remote sensing of tropical grass
qual-ity and quantqual-ity, Hyperspectral remote sensing of tropical grass quality and quantity, x+195 pp.-x+195 pp., 2004.
Mutanga, O. and Skidmore, A. K.: Red edge shift and biochemi-cal content in grass canopies, ISPRS J. Photogram., 62, 34–42, doi:10.1016/j.isprsjprs.2007.02.001, 2007.
Nebiker, S., Annen, A., Scherrer, M., and Oesch, D.: A Light-weight Multispectral Sensor for Micro UAV – Opportunities for Very High Resolution Airborne Remote Sensing, XXI ISPRS Congress. Beijing, China, 2008.
Nijland, W., de Jong, R., de Jong, S. M., Wulder, M. A., Bater, C. W., and Coops, N. C.: Monitoring plant con-dition and phenology using infrared sensitive consumer grade digital cameras, Agr. Forest Meteorol., 184, 98–106, doi:10.1016/j.agrformet.2013.09.007, 2014.
Olsen, D., Dou, C., Zhang, X., Hu, L., Kim, H., and Hildum, E.: Radiometric Calibration for AgCam, Remote Sens., 2, 464–477, doi:10.3390/rs2020464, 2010.
Primicerio, J., Di Gennaro, S. F., Fiorillo, E., Genesio, L., Lugato, E., Matese, A., and Vaccari, F. P.: A flexible unmanned aerial vehicle for precision agriculture, Precis. Agric., 13, 517–523, doi:10.1007/s11119-012-9257-6, 2012a.
Primicerio, J., Di Gennaro, S. F., Fiorillo, E., Genesio, L., Lugato, E., Matese, A., and Vaccari, F. P.: A flexible unmanned aerial vehicle for precision agriculture, Precis. Agric., 13, 1–7, 2012b. Pullanagari, R. R., Yule, I. J., Hedley, M. J., Tuohy, M. P., Dynes,
R. A., and King, W. M.: Multi-spectral radiometry to esti-mate pasture quality components, Precis. Agric., 13, 442–456, doi:10.1007/s11119-012-9260-y, 2012a.
Pullanagari, R. R., Yule, I. J., Tuohy, M. P., Hedley, M. J., Dynes, R. A., and King, W. M.: In-field hyperspectral proximal sensing for estimating quality parameters of mixed pasture, Precis. Agric., 13, 351–369, doi:10.1007/s11119-011-9251-4, 2012b.
Rango, A., Laliberte, A., Herrick, J. E., Winters, C., Havstad, K., Steele, C., and Browning, D.: Unmanned aerial vehicle-based re-mote sensing for rangeland assessment, monitoring, and manage-ment, J. Appl. Remote Sens., 3, 033542, doi:10.1117/1.3216822, 2009.
Sakamoto, T., Gitelson, A. A., Nguy-Robertson, A. L., Arke-bauer, T. J., Wardlow, B. D., Suyker, A. E., Verma, S. B., and Shibayama, M.: An alternative method using digital cameras for continuous monitoring of crop status, Agr. Forest Meteorol., 154, 113–126, doi:10.1016/j.agrformet.2011.10.014, 2012.
Sanches, I. D., Tuohy, M. P., Hedley, M. J., and Mackay, A. D.: Sea-sonal prediction of in situ pasture macronutrients in New Zealand pastoral systems using hyperspectral data, Int. J. Remote Sens., 34, 276–302, doi:10.1080/01431161.2012.713528, 2012. Seelan, S. K., Laguette, S., Casady, G. M., and Seielstad, G. A.:
Remote sensing applications for precision agriculture: A learn-ing community approach, Remote Sens. Environ., 88, 157–169, 2003.
Smith, G. M. and Milton, E. J.: The use of the empirical line method to calibrate remotely sensed data to reflectance, Int. J. Remote Sens., 20, 2653–2662, doi:10.1080/014311699211994, 1999. Stafford, J. V.: Implementing precision agriculture in the 21st
cen-tury, J. Agr. Eng. Res., 76, 267–275, 2000.
Suarez, L., Zarco-Tejada, P. J., Berni, J. A. J., Gonzalez-Dugo, V., and Fereres, E.: Modelling PRI for water stress detection using radiative transfer models, Remote Sens. Environ., 113, 730–744, doi:10.1016/j.rse.2008.12.001, 2009.
Swain, K. C., Thomson, S. J., and Jayasuriya, H. P. W.: Adaption of an unmanned helicopter for low altitude remote sensing to esti-mate yield and total biomass of a rice crop, Trans. ASABE, 53, 21–27, 2010.
Thenkabail, P. S., Smith, R. B., and De Pauw, E.: Evaluation of narrowband and broadband vegetation indices for determining optimal hyperspectral wavebands for agricultural crop character-ization, Photogram. Eng. Rem. S., 68, 607–621, 2002.
Turner, D. J.: Development of an Unmanned Aerial Vehicle (UAV) for hyper-resolution vineyard mapping based on visible, multi-spectral and thermal imagery, School of Geography & Environ-mental Studies Conference 2011, 2011.
Van Alphen, B. and Stoorvogel, J.: A methodology for precision ni-trogen fertilization in high-input farming systems, Precis. Agric., 2, 319–332, 2000.
Vanamburg, L. K., Trlica, M. J., Hoffer, R. M., and Weltz, M. A.: Ground based digital imagery for grassland biomass estimation, Int. J. Remote Sens., 27, 939–950, doi:10.1080/01431160500114789, 2006.
Vescovo, L., Wohlfahrt, G., Balzarolo, M., Pilloni, S., Sottocornola, M., Rodeghiero, M., and Gianelle, D.: New spectral vegetation indices based on the near-infrared shoulder wavelengths for re-mote detection of grassland phytomass, Int. J. Rere-mote Sens., 33, 2178–2195, doi:10.1080/01431161.2011.607195, 2012. Yu, W.: Practical anti-vignetting methods for digital cameras, IEEE
Transactions on Consumer Electronics, 50, 975–983, 2004. Zhang, C. and Kovacs, J. M.: The application of small unmanned