Chemistry Publications
Chemistry
2010
Low-temperature adsorption of H2S on Ag(111)
Selena M. Russell
Iowa State University, selena.m.russell@gmail.com
Da-Jiang Liu
Iowa State University
Maki Kawai
RIKEN Advanced Science Institute
Yousoo Kim
RIKEN Advanced Science Institute
Patricia A. Thiel
Iowa State University, thiel@ameslab.gov
Follow this and additional works at:
http://lib.dr.iastate.edu/chem_pubs
Part of the
Biological and Chemical Physics Commons
,
Materials Science and Engineering
Commons
, and the
Physical Chemistry Commons
The complete bibliographic information for this item can be found at
http://lib.dr.iastate.edu/
chem_pubs/8
. For information on how to cite this item, please visit
http://lib.dr.iastate.edu/
howtocite.html
.
Low-temperature adsorption of H2S on Ag(111)
Abstract
H
2S forms a rich variety of structures on Ag(111) at low temperature and submonolayer coverage. The
molecules decorate step edges, exist as isolated entities on terraces, and aggregate into clusters and islands,
under various conditions. One type of island exhibits a (×)R25.3° unit cell. Typically, molecules in the
clusters and islands are separated by about 0.4 nm, the same as the S–S separation in crystalline H
2S. Density
functional theory indicates that hydrogen-bonded clusters contain two types of molecules. One is very similar
to an isolated adsorbed H
2S molecule, with both S–H bonds nearly parallel to the surface. The other has a
S–H bond pointed toward the surface. The potential energy surface for adsorption and diffusion is very
smooth.
Keywords
Ames Laboratory, adsorption, density functional theory, diffusion, hydrogen bonds, intermolecular forces,
island structure, molecular clusters, potential energy surfaces, silver, sulphur compounds
Disciplines
Biological and Chemical Physics | Materials Science and Engineering | Physical Chemistry
Comments
the following article appeared in
The Journal of Chemical Physics
133, no. 12 (2010): 124705, doi:
10.1063/
1.3481481
.
Rights
Copyright 2010 American Institute of Physics. This article may be downloaded for personal use only. Any
other use requires prior permission of the author and the American Institute of Physics.
Low-temperature adsorption of H2S on Ag(111)
Selena M. Russell, Da-Jiang Liu, Maki Kawai, Yousoo Kim, and P. A. Thiel
Citation: J. Chem. Phys. 133, 124705 (2010); doi: 10.1063/1.3481481
View online: http://dx.doi.org/10.1063/1.3481481
View Table of Contents: http://jcp.aip.org/resource/1/JCPSA6/v133/i12
Published by the AIP Publishing LLC.
Additional information on J. Chem. Phys.
Journal Homepage: http://jcp.aip.org/Journal Information: http://jcp.aip.org/about/about_the_journal
Top downloads: http://jcp.aip.org/features/most_downloaded
Low-temperature adsorption of H
2S on Ag
„
111
…
Selena M. Russell,1,a兲Da-Jiang Liu,2Maki Kawai,3,4Yousoo Kim,3and P. A. Thiel1,2
1
Department of Chemistry, Iowa State University, Ames, Iowa 50011, USA
2
Ames Laboratory, Iowa State University, Ames, Iowa 50011, USA
3
RIKEN Advanced Science Institute, Wako, Saitama 351-0198, Japan
4
Department of Advanced Materials Science, The University of Tokyo, Chiba 277-8561, Japan
共Received 10 May 2010; accepted 2 August 2010; published online 28 September 2010兲
H2S forms a rich variety of structures on Ag共111兲at low temperature and submonolayer coverage. The molecules decorate step edges, exist as isolated entities on terraces, and aggregate into clusters and islands, under various conditions. One type of island exhibits a 共
冑
37⫻冑
37兲R25.3° unit cell. Typically, molecules in the clusters and islands are separated by about 0.4 nm, the same as the S–S separation in crystalline H2S. Density functional theory indicates that hydrogen-bonded clusters contain two types of molecules. One is very similar to an isolated adsorbed H2S molecule, with both S–H bonds nearly parallel to the surface. The other has a S–H bond pointed toward the surface. The potential energy surface for adsorption and diffusion is very smooth. ©2010 American Institute of Physics.关doi:10.1063/1.3481481兴I. INTRODUCTION
Investigations of sulfur and sulfur-containing molecules, adsorbed on metal surfaces, are motivated by applications that range from catalysis to self-assembled monolayers. Con-cerning the specific interaction of H2S with Ag共111兲, almost all previous studies have focused on using H2S as a source of adsorbed S. In those studies, dissociative adsorption was achieved using high pressure and/or elevated surface tem-perature when H2S was in the gas phase,1–7or using electro-chemical methods when H2S was in liquid solution.7,8 In contrast, the present paper deals with the state of the mol-ecule that is obtained by adsorption at low pressure and at temperatures共T兲of 5–30 K.
Previous experiments have shown that H2S adsorbs and desorbs without dissociation on Ag共111兲at low pressure, i.e., in ultrahigh vacuum-type experiments.9 The sticking coeffi-cient is near unity at 80 K, and desorption occurs at T⬇100 K.9 Density functional theory 共DFT兲 calculations have shown that H2S has an adsorption energy 共Ea兲 of 0.17 eV on Ag共111兲, and that the adsorbed molecule nearly retains its gas phase geometry.10The structural parameters in the gas phase are 0.135 nm for the S–H bond length, and 93° for the internal bond angle, whereas the adsorbed molecule has parameters of 0.136 nm and 92°, respectively.10The iso-lated H2S molecule adsorbs with S on top of a Ag atom, and with both S–H bonds parallel to the surface.10
Unlike H2S, molecular H2O on metal surfaces has been studied extensively, and it is useful to review those findings. The isolated H2O molecule on Ag共111兲 is quite similar to H2S, with the O atom at an on-top adsorption site, O–H bonds parallel to the surface, and Ea= 0.15 eV.11In general, on hexagonal metal surfaces, water forms hydrogen-bonded clusters that consist of buckled hexamers.12–17 The
impor-tance of hydrogen bonding in the structures of H2O aggre-gates on Ag共111兲 has been confirmed by detailed scanning tunneling microscopy 共STM兲 and DFT studies of Morgen-stern, Michaelideset al.15–26
Like H2O, H2S forms H bonds in the gas, liquid, and solid states. However, its H bond is only about half as strong as that of H2O,27and its internal molecular geometry is con-siderably different: The S–H bond is longer than the O–H bond共0.133 nm vs. 0.095 nm兲, and its internal bond angle is smaller 共92.2° versus 104.5°兲. Given these differences, it is unclear a priori whether H2S will form hydrogen-bonded clusters on Ag共111兲, and if so, what their geometry will be.
II. EXPERIMENTAL AND COMPUTATIONAL DETAILS
All STM imaging were done at 4.7 K with a low tem-perature STM共Omicron GmbH, Germany兲in an UHV cham-ber with base pressure below 6.7⫻10−9 Pa. In an attached chamber, the Ag共111兲sample共MaTecK GmbH兲was cleaned by repeated cycles of Ar+ sputtering 共1 keV, ⬃10 A, 10 min兲 and annealing 共⬃890 K, 10 min兲. The clean sample was transferred to the STM stage and cooled to the operating temperature. The surface was exposed to H2S gas through a dosing tube located just outside the STM cryostat. That area was at room temperature so during exposure, the sample was not cooled actively. During exposure the sample warmed to 20–30 K, depending on the time it was out of the cryostat
共and hence, on exposure time兲. STM imaging typically began within 20 min after exposure ended, when the sample tem-perature had restabilized at 4.7 K. H2S purity was checked with a mass spectrometer in the STM chamber.
STM images were acquired over a range of bias voltages from⫺140 to 112 mV, and a range of tunneling currents up to 1.0 nA. Based on previous STM studies of H2O on Ag共111兲,17,19,24and also on Pt共111兲 共Ref.28兲and Pd共111兲,29 these conditions are not sufficient to induce dissociation. In a兲Electronic addresses: selena.m.russell@gmail.com and
smrussel@iastate.edu.
THE JOURNAL OF CHEMICAL PHYSICS133, 124705共2010兲
0021-9606/2010/133共12兲/124705/8/$30.00 133, 124705-1 © 2010 American Institute of Physics
addition, there was no evidence of diffusion or rearrange-ment during imaging if the bias potential was about 100 mV or less.
Data from three types of experiments are described in this paper. In the first, the sample was placed in front of the gas doser for about 1 s at 20 K, after which STM images were acquired continuously over a 3 h period, and intermit-tently over the following 72 h. Second, the sample was placed in front of the H2S doser for 10 s at about 30 K, and STM images were acquired over the following 2 h. Third, the same 10 s exposed sample was allowed to age for 17 h at 4.7 K, after which images were acquired again over an 8 h period. After the 1 s exposure, 2%–3% of the surface was covered by features attributable to H2S. After the 10 s expo-sure, 20%–30% of the surface was covered, both immedi-ately after exposure and after aging. The surface that resulted from the two exposures will be referred to as “lowH
2S
rel ” and
“higherH 2S
rel
” respectively. Here the relative coverage,rel, is simply based on the area of the STM images covered by adsorbate-related features. In the STM images, lateral共x and y兲distances were calibrated using the atomic separation of Ag共111兲, 0.289 nm.
After deposition to higherH 2S
rel , aging, and scanning, the
sample was allowed to warm to 200 K. When checked again with STM, the surface was clean, consistent with expecta-tions from previous work, showing that adsorption and de-sorption at low temperature are reversible共nondissociative兲.9 Total energy calculations were performed using theVASP code30–33with the Perdew–Burke–Ernzerhof共PBE兲 approxi-mations of the exchange-correlation functional.34 The electron-ion interactions were described by an improved ver-sion of the projector augmented wave 共PAW兲 method for transition metals.35 The surface was modeled by periodic slabs of varying thickness separated by 1.2 nm of vacuum, using the theoretical lattice constant 0.4149 nm. The energy cutoff was 280 eV. Molecules were adsorbed on one side of the slab, and an external potential was applied to correct the artificial dipole interactions induced by the adsorbate in the direction perpendicular to the surface,36when necessary. Re-sults quoted below were obtained from averages of slab thickness varying from four to seven layers, with varying supercell sizes up to 4⫻4 共16 atoms in each layer兲. In the calculations, absolute coverages共abs兲are relevant, and these are defined as the ratio of the density of H2S molecules to Ag atoms in the surface plane. STM images were simulated us-ing the Tersoff–Hamann method.37 The simulated images were obtained from the partial charge density of the sample within⫾0.1 eV of the Fermi level, and the isodensity surface at a density 1% of the average bulk density. This would correspond experimentally to an ideal point tip with spheri-cal tip wave function about 0.4 nm above the surface, with low tunneling bias.
The main intermolecular interactions between H2S mol-ecules in a cluster should be hydrogen bond interactions, which can be reasonably described by DFT. For example, the PBE value for H2O dimer interactions is about 0.02 eV higher than the benchmark number from high level quantum chemistry calculations.38 It should be noted that the DFT-PBE error could be as high as 0.05 eV for highly nonlinear H
bonds.39However, DFT at the generalized gradient approxi-mation 共GGA兲 level is not suitable for dispersion interac-tions, which may play a more important role for larger com-plex structures. In this paper, we report results only for small clusters where hydrogen bond interactions dominate.
III. RESULTS
A. Step edges
Figure1共a兲shows an atomic-scale image of a region of a Ag共111兲 terrace. Arrows show the close-packed directions. This serves to define the crystallographic directions in all other STM images.
[image:5.612.353.521.45.368.2]Figure1共b兲shows the smooth, straight appearance that is typical of a clean Ag共111兲 step at 4.7 K. The appearance FIG. 1.共a兲Clean Ag共111兲substrate. Raw image at 1.00 nA,⫺100 mV, and 3.6⫻3.7 nm2. Close-packed directions are shown for reference, and they
apply to all other images. Note that there is some deviation from ideal hexagonal packing, which is due to slight miscalibration of the XY piezo-electrics in the STM scanner. This distortion is corrected whenever distances are reported in this paper.关共b兲–共f兲兴Images are differentiated.共b兲Clean sur-face step. 0.92 nA, 284 mV, 27.8⫻28.6 nm2.关共c兲and共d兲兴Step edges at low H2S
rel , 0.20 nA, 10 mV, and scales of 27.8⫻28.6 nm2, and 11.1
⫻11.4 nm2, respectively. In panel共c兲, the inset shows a line profile of the
topography image illustrating the peak-to-peak separation of protrusions along the step edges: 0.37, 0.41, and 0.36 nm.共e兲Step edge at higherH
2S
rel
before aging, 0.84 nA,⫺50 mV, and 27.8⫻28.6 nm2. A portion of the main
image, indicated by the box, is shown at higher magnification共image size of 2.6⫻2.7 nm2兲to highlight the isolated protrusions.共f兲Step edge at higher Hrel2Safter aging, 0.78 nA,⫺100 mV, and 27.8⫻28.6 nm2. A portion of the
main image, indicated by the box, is shown at higher magnification
共0.70 nA, 28 mV, and 11.1⫻11.4 nm2兲to highlight an example of an
is-land, which has partially filled in the area between step edges, as discussed in the text.
changes considerably when H2S adsorbs, as shown in Fig. 1共c兲for lowH
2S
rel . Clearly, molecules saturate the step edges.
At higher magnification, as in Fig. 1共d兲, a double row of protrusions is visible along the step edge. The protrusions are separated by 0.42⫾0.09 nm, as shown in the inset in Fig. 1共d兲. Other data to be presented in this paper will repeatedly show protrusions with similar nearest-neighbor separation of 0.4 nm, in various environments. This robust feature is rea-sonably assigned as a H2S molecule hydrogen-bonded to one or more other molecules. See TableI.
At higherH 2S
rel
, protrusions still cover the step edges, as in Fig.1共e兲. They have the same separation as at low H
2S
rel ,
although they comprise a wider band. After aging at higher Hrel2S, one sees islands extending outward from step edges, as in Fig.1共f兲. The growth of these islands indicates consider-able diffusion of H2S during aging, even at 4.7 K. If two step edges border a narrow terrace, as in the center of Fig.1共f兲, the islands may bridge the terrace. Taken together, these data indicate that H2S adsorbs preferentially at step edges, and the steps can serve to nucleate islands on the terraces. These are reminiscent of observations for H2O on this surface.20
B. H2S on terraces: Isolated molecules
At higherH 2S
rel
, before aging, many isolated protrusions can be seen on the terraces as in Fig. 1共e兲. These features may be isolated H2S molecules. DFT lends some insight about whether this assignment is reasonable. Our calcula-tions indicate that the adsorption energy of a H2S molecule is 0.15 eV. This is in good agreement with Alfonso’s value, 0.17 eV,10 and in reasonable agreement with the value of 0.25 eV derived from experimental temperature-programed desorption 共using major simplifying assumptions兲.9 The slight difference between the two DFT values, 0.15 and 0.17 eV, is mainly due to the different PAW potential used
共and therefore different lattice constant兲 plus the denser k-point grids in this paper. Regarding the molecule’s con-figuration, our DFT calculations confirm the results of Alfonso,10 i.e., the fact that in its most stable form, the S atom is nearly at an on-top site, one of the H atoms nearly at a bridge site, and the other H atom nearly at a fcc or hcp site. This configuration is shown in Figs. 2共a兲 and 2共b兲.
Simulation of STM images, based on DFT, shows that the molecule’s shape 共assuming a static position兲 is essentially circular, as shown in Fig.2共c兲.
For quantitative STM dimensions, calculations show that the measured area per molecule should be about 0.18 nm2 assuming a static position. The measured area of the isolated features in Fig.1共e兲is only slightly larger, about 0.23 nm2, which is probably within the acceptable limit of such a com-parison.
We also use DFT to test adsorption of a H2S monomer with the S atom initially near a fcc or a bridge site, using a
共2⫻2兲supercell andH 2S
abs = 1/4. These initial conditions
re-sult in metastable adsorption with very similar configurations and energies. The S atom is slightly higher, the H atoms are slightly lower than at the on-top site, and Ea is about 0.031 eV less favorable. These metastable adsorption con-figurations are near the transition states for diffusion of H2S molecules, implying a diffusion barrier of about 0.031 eV.
[image:6.612.120.485.84.223.2]关Strictly speaking, this is a lower estimate. The transition state is a saddle point which should have a higher energy than a nearby metastable adsorption site. However, due to the TABLE I. Sizes and separations of protrusions in STM images. The values are all derived from raw data, i.e.,
with no image processing. The a-b-c notation for the isolated triangular clusters is defined in Fig.5共c兲. Uncer-tainties equal one standard deviation.
Identity/environment of the protrusion
Closest separation between protrusions
共nm兲
Step edge, low coverage 0.45⫾0.06
Step edge, higher coverage, before aging 0.38⫾0.05 Step edge, higher coverage, after aging 0.38⫾0.05
Isolated pinwheel clusters 0.39⫾0.07
Isolated triangular clusters 0.41⫾0.02AB
0.52⫾0.02BC
0.49⫾0.03CA
Irregular islands with quasihexagonal internal packing 0.40⫾0.05
共冑37⫻冑37兲R25.3° islands 0.43⫾0.16
FIG. 2.关共a兲and共b兲兴Configuration of a H2S monomer on Ag共111兲optimized
using DFT. The red sphere is a S atom, the green spheres are H atoms, and the gray spheres are Ag atoms. Results are obtained using a five-layer slab and 4⫻4 supercell.共c兲Simulated STM image using the Tersoff–Hamann method.
124705-3 Low-temperature adsorption of H2S on Ag共111兲 J. Chem. Phys.133, 124705共2010兲
[image:6.612.352.521.516.701.2]flatness of the potential energy surface, the difference is hard to discern from numerical calculations. Our calculation of the restricted one-dimension minimal energy pathway shows no higher barrier beyond numerical uncertainties, using a
共2⫻2⫻5兲 supercell. Furthermore, studies of various systems—our own and others’40—lead us to expect that the real value does not exceed this estimate by more than 10%.兴 A rough, nudged elastic band calculation of the minimal energy diffusion path yields a diffusion barrier of 0.036 eV, very close to the difference in adsorption energies between the metastable and stable configurations, 0.031 eV. This is a very small diffusion barrier, suggesting that the potential en-ergy surface is quite smooth, and that thermal diffusion at low temperature is not unreasonable. This will be discussed more fully in Sec. IV.
C. H2S on terraces: Pinwheel and triangular clusters
at lowH 2S rel
Under the same conditions where the steps are decorated at lowH
2S
rel 关
Figs.1共c兲and1共d兲兴, wide terraces also exhibit clusters. These clusters are very uniform, as shown in Fig. 3共a兲, with a diameter of 3.0⫾0.2 nm2. All the clusters ex-hibit internal protrusions arranged in a chiral pinwheel pat-tern, which is evident at high magnification in Figs.3共b兲and 3共c兲. It is faintly visible in the raw image关Fig.3共b兲兴 but is more pronounced in the differentiated image 关Fig. 3共c兲兴. Within experimental uncertainty, the individual protrusions in the pinwheel clusters have the same separation as the step-edge protrusions, i.e., 0.39⫾0.07 nm共see TableI兲. The pin-wheel clusters do not transform or coarsen, over a period of tens of hours in UHV at 4.7 K. The coverage of pinwheel clusters under these conditions is 0.0033 nm−2, which is very low compared with the density of Ag atoms, 14.4 nm−2. Thus, it is conceivable that these clusters nucleate at defects or impurities, although if that is the case, the nucleation cen-ter exerts no influence on the molecular structure within the cluster.
The H2S pinwheel clusters can dissociate under certain tunneling conditions. They undergo increasing dissociation in the sequence in Fig. 4, leaving many small fragments finally in Fig. 4共c兲. The small fragments, which we call tri-angular clusters, are shown at closer view and are also rep-resented schematically in Fig.5. Each triangular cluster con-sists of three unequal protrusions 关labeled 共a兲–共c兲 in the schematic兴.
[image:7.612.88.257.50.241.2]These asymmetric triangular clusters share the same ori-entation. This was a reproducible observation. In other words, dissociation of a pinwheel cluster always produces FIG. 3. Isolated pinwheel clusters on terraces at lowHrel2S. 共a兲1.00 nA,
100 mV, and 55.6⫻57.2 nm2, differentiated.共b兲 Untreated STM image,
[image:7.612.352.521.56.573.2]1.00 nA, 50 mV, and 4.9⫻5.0 nm2.共c兲Differentiated form of共b兲.
FIG. 4. Dissociation of pinwheel H2S clusters.共a兲 1.00 nA, 50 mV,共b兲
1.00 nA, 100 mV, and共c兲0.500 nA, 10 mV. All are 55.6⫻57.2 nm2and
differentiated.
triangular clusters that were aligned with one another, even though their alignment with respect to the parent pinwheel was variable. This alignment could be produced by long-range interactions modulated by the well-known surface electronic state of Ag共111兲,41,42or by an asymmetry in the tip itself, which could induce a common spatial orientation dur-ing the dissociation process. The latter possibility is bol-stered by a recent observation that spontaneous 共 uninten-tional兲 tip asymmetry can induce preferential molecular orientation in asymmetric alkanethiols adsorbed on Au.43 Be-cause of the reproducibility described above, we do not be-lieve that the parallel alignment of the triangular H2S clusters reflects an artifact in the imaging process itself, i.e., a mul-tiple tip.
Morgenstern and co-workers15,17–19 observed similar
共but not identical兲 triangular features, for ⬃0.05 bilayers H2O and D2O on Cu共111兲 and Ag共111兲 at 17 K. They ini-tially suggested that these features were trimers of H2O molecules.15 However, upon further investigation and by comparison with DFT, they later identified the feature as a nine-molecule cluster, i.e., a nonamer.17 The nonamers con-sisted of a hexamer of “bilayer ice” with three additional H2O molecules at the periphery, hydrogen-bonded to the al-ternating, lower H2O molecules of the hexamer. STM of these triangular features on Ag共111兲showed a peak-to-peak distance of 0.56 nm and an internal angle of 60°, with each protrusion at the same height. In contrast, the triangular clus-ters of H2S represented in Fig.4are smaller, the protrusions form an irregular triangle, and the protrusions are not at the same height. For example, the lengths of the sides of the
triangle 关as defined in Fig. 5共c兲兴 are AB= 0.41⫾0.02 nm,
BC= 0.52⫾0.02 nm, and CA= 0.49⫾0.03 nm—all signifi-cantly smaller than the 0.56 nm of H2O. Given that the S–H bond of H2S in the gas phase is 40% longer than the O–H bond of H2O 共and that the hydrogen bond is weaker兲, one wouldnotexpect a hexamer or nonamer of H2S to besmaller than the corresponding cluster of H2O. Therefore, it is un-likely that our triangular clusters are hydrogen-bonded hex-amers or nonhex-amers.
Using DFT, we searched for clusters that might be com-patible with the data. Clusters are necessarily stabilized by short-range, attractive interactions. For large intermolecular separations共0.9–6 nm兲, periodically arranged H2S molecules actually repulse one another since Eadecreases steadily with increasing coverage, from 0.15 eV at H
2S
abs = 1/16, to
0.085 eV atH 2S
abs = 1/3. Next examining shorter
intermolecu-lar separations, we find adimerwith Ea= 0.35 eV, implying an attractive interaction of about 0.35–共2⫻0.15兲= 0.05 eV. The distance between the two S atoms is 0.39 nm共0.38 nm in-plane兲. Its configuration is shown in Fig.6共a兲, and its pre-dicted shape in STM is shown in Fig. 6共b兲.
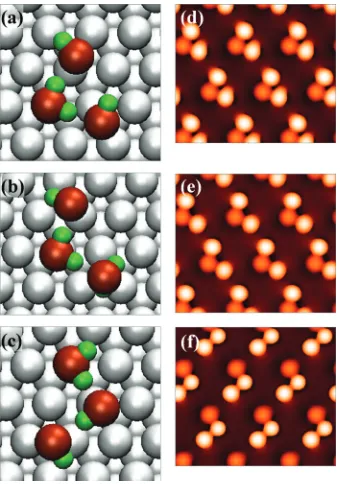
For a H2S trimer, Ea is around 0.52 eV, implying 0.07 eV total attraction between molecules. We find three trimer configurations that have the same energy, to within a few meV, and these are shown in Figs.7共a兲–7共c兲. They have several features in common. First, they have two hydrogen bonds共S – H¯S bonds兲that link the molecules. Second, one molecule in each trimer is similar to an isolated H2S mol-ecule, with its S–H bonds nearly parallel to the surface and the S almost directly above a Ag atom. Third, each of the other two molecules has a S–H bond pointing down toward the surface. Fourth, the isolated-like molecules are always closer to the surface than the downward-pointing molecules, with the S atoms being 0.28–0.29 and 0.38–0.42 nm above the Ag atom plane, respectively. Fifth, the S–S separations in the S – H¯S bonds span a wide range, from about 0.34 to 0.57 nm in-plane, or about 0.37–0.57 true distance. Sixth, the S – H¯S bond angles are 161°–178°, i.e., the hydrogen bonds are nearly linear. Finally, the predicted STM images are shown in Figs.7共d兲–7共f兲. In all trimers, the isolated-like molecule appears lower and slightly broader than the other two. In summary, these seven features are common to all the minimum-energy trimers that we have found.
[image:8.612.87.257.45.330.2]There are also some differences among the trimers found in DFT. In the first two types 关Figs. 7共a兲 and 7共b兲兴, the isolated-like molecule is at the center, and it contributes all the hydrogen to the S – H¯S bonds. Both these types of FIG. 5. Isolated triangular clusters at low H
2S
rel . 共a兲 Untreated image at
0.12 nA, 5 mV, and共b兲differentiated form of共a兲. Upper image sizes: 6.7
⫻11.4 nm2. Lower image sizes: 2.1⫻2.1 nm2.共c兲 Schematic of
protru-sions in triangular clusters.
FIG. 6.共a兲Configuration of a H2S dimer on Ag共111兲optimized using DFT.
The red spheres are S atoms, the green spheres are H atoms, and the gray spheres are Ag atoms. Results are obtained using a five-layer slab and 4
⫻4 supercell.共b兲Simulated STM image using the Tersoff–Hamann method.
124705-5 Low-temperature adsorption of H2S on Ag共111兲 J. Chem. Phys.133, 124705共2010兲
[image:8.612.351.520.49.128.2]trimers are nearly isosceles triangles. In the third type, shown in Fig. 7共c兲, the isolated-like molecule is at one end of the trimer 共top of figure兲 instead of in the center. Of the three trimers, the third type fits the experimental shape best be-cause it is the most irregular. The S–S distances for this trimer, from DFT, are 0.34, 0.36, and 0.54 nm 共projected onto the surface plane兲. These can be compared to the ob-served values of 0.41⫾0.02, 0.49⫾0.03, and 0.52⫾0.02 nm in the triangular clusters. Only one of the three values matches exactly. Nonetheless, the DFT calcula-tions make it plausible to interpret the triangular clusters as some type of noncyclic H2S trimer.
In trimers 共a兲–共c兲, molecules with S–H bonds pointing toward the Ag surface occupy a variety of sites. Referring to Fig. 7, these sites range from semi-on-top—as in the top molecule of trimers共a兲and共b兲, and the middle molecule of trimer共c兲; to a nearly perfect twofold bridge site—as for the bottom molecule of types 共a兲 and 共c兲; to a nearly perfect threefold hollow site—i.e., the bottom molecule of type共b兲. This, plus the wide range of S–S separations, indicates that the intermolecular hydrogen bonds give rise to preferred lo-cal configurations, but these configurations are quite flexible and adaptable. The isolated-like molecule is more site-specific than the other two because it is always found in an on-top site. In other words, the potential energy surface for the downward-pointing molecules is very smooth indeed.
D. H2S on terraces: Extended islands at higherH2S rel
Initially after adsorption at ⬃30 K and at higher H 2S
rel ,
the molecules form large and irregularly shaped islands that coexist with many small, isolated protrusions. The islands themselves have protrusions arranged in an irregular
hexagonal-like packing, as shown in Fig.8. The protrusions in these islands have the same nearest-neighbor separation, 0.40⫾0.05 nm, as the protrusions along the step edges in Figs.1共c兲and1共d兲, and in the pinwheel clusters in Figs.3共b兲 and 3共c兲. We hence assign them as H2S molecules that are fixed in place by H-bonding with other molecules. These islands coexist with isolated protrusions on terraces which, as discussed already, are assigned as individual H2S mol-ecules.
With aging at 4.7 K, the features on the terraces change to those shown in Fig.9. The individual H2S molecules dis-appear. The islands with quasihexagonal packing of H2S molecules also disappear, indicating that they must be meta-stable. They are replaced by islands that differ in several respects. One difference is found at the edges of the islands: instead of being irregular, the edges of the new islands some-times consist of linear segments共facets兲, as shown in Fig.9. Second is the internal structure, which exhibits a
[image:9.612.89.259.48.290.2]共
冑
37⫻冑
37兲R25.3° unit cell. This is shown in more detail in Fig.10. The rows of protrusions highlighted by the rectangle in Fig. 10共b兲 have a lateral separation of 0.43⫾0.16 nm, similar to that of other features 共cf. Table I兲. Perhaps the most prominent features are dark triangles, which have alter-nating orientations, as shown in the inset in Fig.9共b兲. FIG. 7. 关共a兲–共c兲兴Configurations of a H2S trimers on Ag共111兲optimized [image:9.612.352.521.49.393.2]using DFT. The red spheres are S atoms, the green spheres are H atoms, and the gray spheres are Ag atoms. Results are obtained using a five-layer slab and 4⫻4 supercell. 关共d兲–共f兲兴 Simulated STM image using the Tersoff– Hamann method.
FIG. 8. H2S islands at higher H2S
rel before aging. Tunneling conditions:
0.6611 nA and⫺77.98 mV. Images are differentiated.共a兲33.4⫻34.3 nm2
and共b兲area marked in共a兲, 5.4⫻5.6 nm2.
IV. DISCUSSION
A. Molecular diffusion
One main experimental observation is that clusters of H2S molecules can form upon adsorption at 20 K for low
H2S
rel 共pinwheel clusters兲, and upon adsorption at 30 K for highH
2S
rel 共irregular hexagonal islands兲. In addition, the latter clusters can rearrange over a time scale of about 20 h at 4.7 K into 共
冑
37⫻冑
37兲R25.3° islands, and simultaneously, individual H2S molecules disappear. This requires that indi-vidual molecules can diffuse, while clusters can dissociate and/or rearrange at these temperatures, over the correspond-ing experimental time scales. Is this plausible? The clearest situation may be the aging experiment since there T andH2S
rel
are both constant. From Fig. 1共e兲, a fair estimate is that a molecule must travel a distance of at least 1 nm during ag-ing, corresponding to about 12 hops for a random walker. Assuming a frequency factor of 1014 s−1, which is toward the high end, allows an estimate of the upper limit of the diffusion barrier, Ed, of 0.02 eV. This value would also be consistent with the fact that the adsorbate structures are static on the time scale of STM imaging 共2 h兲 at 4.7 K. As dis-cussed in Sec. III B, we have calculated from DFT that the
diffusion barrier is 0.03 eV. Hence, both experiment and DFT support a small barrier of a few tens of meV.
Let us compare this with diffusion of H2O on Ag共111兲. The upper limit of Ed for H2O on Ag共111兲 has been esti-mated, from experimental data, at 0.2 eV.20 From DFT, an alternate estimate for Edis given by the difference in adsorp-tion energies between the most-favorable site and next-most-favorable site, as discussed in Sec. III B. This difference is 0.050 eV from the present work, and 0.04 eV from others’.44 If we focus on values of Ed for H2O and H2S derived only from our calculations共to make the comparison as consistent as possible兲, then the two values of Edare fairly close: 0.050 and 0.031 eV, respectively. This similarity in Edparallels the similarity in adsorption energies for isolated H2O and H2S: 0.14 and 0.15 eV, respectively, from our calculations.
B. Molecular interactions
From the experimental data, the lateral separation of pro-trusions in clusters on terraces, or along step edges, is con-sistently close to 0.4 nm共see TableI兲. The nearest-neighbor S–S separations in crystalline H2S are 0.40 and 0.42 nm.45
共This is considerably longer than the O–O separation in crys-talline H2O, 0.28 nm.46兲Therefore, we suggest that protru-sions separated by 0.4 nm are individual molecules, at least some of which are linked by hydrogen bonds.
[image:10.612.89.254.48.382.2]Our DFT calculations show that two types of molecules should be expected in H-bonded clusters: Molecules similar to isolated, adsorbed H2S, and molecules with one S–H bond pointing down into the surface. The latter are farther from FIG. 9. H2S islands at higherH2S
rel after aging. Parameters are共a兲1.3 nA,
112 mV, 100⫻100 nm2and共b兲1.0 nA,⫺140 mV, 55.6⫻57.2 nm2and the
inset detail of the large island, 7.3⫻6.1 nm2. Images are differentiated.
[image:10.612.353.520.49.312.2]Differentiation does not distort original features or introduce new features; it only extenuates the original features. Axis vectors are along the close-packed directions as shown in Fig.1共a兲. Note that in Fig. 9共a兲, there is a double tip effect that makes the lower right edges of islands appear to contain a double step, but this is not real.
FIG. 10. Fine structure of the共冑37⫻冑37兲R25.3° lattice inside the largest island in Fig.9共a兲. Vectors show the close-packed directions as in Figs.1共a兲
and9.共a兲Raw image at 1.0 nA, 50 mV, 11.1⫻11.4 nm2.共b兲Same as image 共a兲after Fourier transform共FT兲filtering.共c兲Raw image at 1.0 nA, 46 mV, and 11.1⫻11.4 nm2.共d兲Same as image共c兲after FT filtering.共e兲
Differen-tiated version of共d兲, 7.8⫻8.0 nm2, containing a rhombus showing the unit
cell.共f兲FT of共e兲.
124705-7 Low-temperature adsorption of H2S on Ag共111兲 J. Chem. Phys.133, 124705共2010兲
the surface than the former, and are predicted to be higher
共brighter兲 in STM images, regardless of whether these mol-ecules are hydrogen acceptors关as in Figs.7共a兲 and7共b兲兴or hydrogen donors 关Fig. 7共c兲兴. The molecules with one S–H bond pointing toward the surface have especially low site-specificity. The DFT calculations indicate that clusters of three molecules, linked by two hydrogen bonds, are stable relative to isolated molecules. The triangular clusters ob-served in experiment共Fig.5兲might be such clusters.
Larger clusters and islands also form. While we are not able to propose specific models at this time, the fact that the potential energy surface is very smooth makes coincidence lattices and metastable structures very plausible. One such extended structure has a 共
冑
37⫻冑
37兲R25.3° unit cell. The same unit cell has been reported for H2O on Pt共111兲, and a hydrogen-bonded structure was proposed.47–49 However, the proposed structure does not match the features in our STM images, indicating that the molecular arrangement within the unit cell may be different for H2S than for H2O. Indeed, one would expect the molecular arrangement to be different, given the large difference in the O–O and S–S bond lengths in the solid ices共0.40–0.42 and 0.28 nm, respectively兲.V. CONCLUSIONS
H2S forms a rich variety of structures on Ag共111兲at low temperature and at submonolayer coverage. The molecules decorate step edges, exist as isolated entities on terraces, and aggregate into clusters and islands, under the various condi-tions of our experiments. The typical molecular separation in the clusters and islands is 0.4 nm, the same as that in crys-talline H2S. The potential energy surface for adsorption and diffusion is very smooth.
Note added in proof. We recently became aware of a paper describing a new model for the 共
冑
37⫻冑
37兲R25.3° structure of H2O on Pt共111兲 on STM images and DFT calculations.50ACKNOWLEDGMENTS
We thank James W. Evans, Gordon J. Miller, and Jakoah Brgoch for useful discussions and helpful insights. We thank Hyung-Joon Shin and Kenta Motobayashi for assistance with the experiments. The experimental component of this work was supported financially by three sources: the NSF under Grant No. CHE-0809472, a Grant-in-Aid for Scientific Re-search on Priority Areas “Electron Transport Through a Linked Molecule in Nano-scale,” and a Grant-in-Aid for Sci-entific Research共S兲 “Single Molecule Spectroscopy using Probe Microscope” from the Ministry of Education, Culture, Sports, Science, and Technology共MEXT兲of Japan. The the-oretical component of this work was supported by the Divi-sion of Chemical Sciences, BES, U.S. Department of Energy
共U.S. DOE兲.
1F. Cabané-Brouty, J. Chim. Phys. Phys.-Chim. Biol. 62, 1056共1965兲. 2F. Cabané-Brouty, J. Chim. Phys. Phys.-Chim. Biol. 62, 1045共1965兲.
3J. Bénard, J. Oudar, and F. Cabané-Brouty,Surf. Sci. 3, 359共1965兲. 4J. Perdereau and G. E. Rhead,Acta Metall. 16, 1267共1968兲. 5G. Rovida and F. Pratesi,Surf. Sci. 104, 609共1981兲.
6G. G. Tibbetts, J. M. Burkstrand, and J. C. Tracy,Phys. Rev. B15, 3652 共1977兲.
7R. Heinz and J. P. Rabe,Langmuir 11, 506共1995兲.
8G. D. Aloisi, M. Cavallini, M. Innocenti, M. L. Foresti, G. Pezzatini, and
R. Guidelli,J. Phys. Chem. B 101, 4774共1997兲.
9Y. Yu, St. J. Dixon-Warren, and N. Astle,Chem. Phys. Lett. 312, 455 共1999兲.
10D. R. Alfonso,Surf. Sci. 602, 2758共2008兲.
11J. Carrasco, A. Michaelides, and M. Scheffler, J. Chem. Phys. 130,
184707共2009兲.
12P. A. Thiel and T. E. Madey,Surf. Sci. Rep. 7, 211共1987兲. 13M. A. Henderson,Surf. Sci. Rep. 46, 1共2002兲.
14A. Hodgson and S. Haq,Surf. Sci. Rep. 64, 381共2009兲.
15K. Morgenstern and K.-H. Rieder,J. Chem. Phys. 116, 5746共2002兲. 16A. Michaelides,Faraday Discuss. 136, 287共2007兲.
17A. Michaelides and K. Morgenstern,Nature Mater. 6, 597共2007兲. 18M. Mehlhorn and K. Morgenstern,New J. Phys. 11, 093015共2009兲. 19K. Morgenstern and J. Nieminen,J. Chem. Phys. 120, 10786共2004兲. 20K. Morgenstern,Surf. Sci. 504, 293共2002兲.
21K. Morgenstern and J. Nieminen,Phys. Rev. Lett. 88, 066102共2002兲. 22J. Nieminen, S. Lahti, S. Paavilainen, and K. Morgenstern,Phys. Rev. B
66, 165421共2002兲.
23H. Gawronski, K. Morgenstern, and K.-H. Rieder,Eur. Phys. J. D 35,
349共2005兲.
24H. Gawronski, J. Carrasco, A. Michaelides, and K. Morgenstern,Phys.
Rev. Lett. 101, 136102共2008兲.
25M. Mehlhorn, H. Gawronski, and K. Morgenstern,Phys. Rev. Lett. 101,
196101共2008兲.
26M. Mehlhorn, J. Carrasco, A. Michaelides, and K. Morgenstern,Phys.
Rev. Lett. 103, 026101共2009兲.
27J. A. Platts, S. T. Howard, and B. R. F. Bracke,J. Am. Chem. Soc. 118,
2726共1996兲.
28K. Motobayashi, C. Matsumoto, Y. Kim, and M. Kawai,Surf. Sci. 602,
3136共2008兲.
29T. Mitsui, M. K. Rose, E. Fomin, D. F. Ogletree, and M. Salmeron,
Science 297, 1850共2002兲.
30G. Kresse and J. Hafner,Phys. Rev. B 49, 14251共1994兲. 31G. Kresse and J. Hafner,Phys. Rev. B 47, 558共1993兲. 32G. Kresse and J. Furthmüller,Phys. Rev. B 54, 11169共1996兲. 33G. Kresse and J. Furthmüller,Comput. Mater. Sci. 6, 15共1996兲. 34J. P. Perdew, K. Burke, and M. Ernzerhof,Phys. Rev. Lett. 77, 3865
共1996兲.
35A. Kiejna, G. Kresse, J. Rogal, A. De Sarkar, K. Reuter, and M.
Schef-fler,Phys. Rev. B 73, 035404共2006兲.
36J. Neugebauer and M. Scheffler,Phys. Rev. B 46, 16067共1992兲. 37J. Tersoff and D. R. Hamann,Phys. Rev. B 31, 805共1985兲.
38E. E. Dahlke and D. G. Truhlar,J. Phys. Chem. B 109, 15677共2005兲. 39J. Ireta, J. Neugebauer, and M. Scheffler,J. Phys. Chem. A 108, 5692
共2004兲.
40A. Michaelides,Appl. Phys. A: Mater. Sci. Process. 85, 415共2006兲. 41M. Ternes, M. Pivetta, F. Patthey, and W.-D. Schneider,Prog. Surf. Sci.
85, 1共2010兲.
42M. L. Merrick, W. Luo, and K. A. Fichthorn,Prog. Surf. Sci. 72, 117 共2003兲.
43H. L. Tierney, private communication共2010兲.
44A. Michaelides, V. A. Ranea, P. L. de Andres, and D. A. King,Phys. Rev.
Lett. 90, 216102共2003兲.
45E. Sándor and S. O. Ogunade,Nature共London兲 224, 905共1969兲. 46A. Glebov, A. P. Graham, A. Menzel, and J. P. Toennies,J. Chem. Phys.
106, 9382共1997兲.
47D. E. Eisenberg and W. Kauzmann,The Structure and Properties of
Wa-ter共Oxford University Press, New York, 1969兲.
48G. Zimbitas, S. Haq, and A. Hodgson, J. Chem. Phys. 123, 174701 共2005兲.
49J. Harnett, S. Haq, and A. Hodgson,Surf. Sci. 528, 15共2003兲. 50S. Nie, P. J. Feibelman, N. C. Bartelt, and K. Thürmer,Phys. Rev. Lett.
105, 026102共2010兲.