RESEARCH
The genome-wide transcriptional
regulatory landscape of ecdysone
in the silkworm
Dong Cheng
1, Tingcai Cheng
1,2*, Xi Yang
1, Quan Zhang
1, Jianfeng Fu
1, Tieshan Feng
1, Jiao Gong
1and Qingyou Xia
1,2Abstract
Background: The silkworm, Bombyx mori, a typical representative of metamorphic insects, is of great agricultural and economic importance. The steroid hormone ecdysone (20-hydroxyecdysone, 20E) is the central regulator of insect developmental transitions, and its nuclear receptors are crucial for numerous biological processes, including repro-duction, metabolism, and immunity. However, genome-wide DNA regulatory elements and the ecdysone receptor (EcR) that control these programs of gene expression are not well defined.
Results: In this study, we investigated the alterations in three types of histone modification in silkworm embryonic cells treated with 20E by chromatin immunoprecipitation sequencing (ChIP-seq). We identified enhancers using histone modifications and derived genome-wide ecdysone-dependent enhancer activity maps in the silkworm. We found enhancers enriched for monomethylation of histone H3 Lys4 (H3K4me1) that showed dynamic changes in acetylation of histone H3 Lys27 (H3K27ac) after 20E treatment and functioned to regulate the transcription of specific genes. EcR regulated transcription by binding not only to proximal promoters but also to the distal enhancers of tar-get genes. Moreover, only 52.65% EcR peaks contained ecdysone response element (EcRE) motif, suggesting that EcR regulates the expression of target genes not only by binding directly to EcRE, but also by binding with other transcrip-tion factor.
Conclusions: Our findings provide novel insights into the complex regulatory landscape of hormone-responsive cell activity and a basis for understanding the complex transcriptional regulatory processes of ecdysone.
Keywords: Histone modification, Enhancer, Ecdysone receptor, Regulatory element, Silkworm
© The Author(s) 2018. This article is distributed under the terms of the Creative Commons Attribution 4.0 International License (http://creat iveco mmons .org/licen ses/by/4.0/), which permits unrestricted use, distribution, and reproduction in any medium, provided you give appropriate credit to the original author(s) and the source, provide a link to the Creative Commons license, and indicate if changes were made. The Creative Commons Public Domain Dedication waiver (http://creat iveco mmons .org/ publi cdoma in/zero/1.0/) applies to the data made available in this article, unless otherwise stated.
Background
Spatial–temporal specificity in gene expression is achieved according to information in cis-acting DNA regulatory elements including insulators, promoters, and enhancers [1, 2]. Enhancers have emerged as key cis-regulatory elements, independent of their orientation or distance, to affect gene transcription [3–5]. An emerging view is that enhancers can recruit transcription factors (TFs) to specific binding sites, and specific combinations of TFs and their co-activators and co-repressors result in
gene activation or repression [6, 7]. In addition, enhanc-ers are becoming increasingly appreciated as the sites of functional variation within the genome that contrib-ute to diverse diseases [4]. However, the vast majority of enhancers in animal genomes and their spatiotemporal activities are unknown as suggested by the small number of gene expression patterns that have been linked to spe-cific enhancers [8, 9]. Thus, there is substantial interest in identifying enhancers and in elucidating how they con-trol activity-dependent gene transcription.
Post-translational modifications of histones, such as acetylation and methylation of lysine residues of histone H3, play important roles in regulating gene expression by altering the chromatin structure [10]. Genome-wide
Open Access
*Correspondence: chengtc@swu.edu.cn
1 State Key Laboratory of Silkworm Genome Biology, Southwest
University, Chongqing 400715, China
mapping of histone modifications has revealed highly stereotypical patterns, with different marks enriched at regulatory elements [8, 9, 11–13]. For example, in mammals and insects, trimethylation of histone H3 Lys4 (H3K4me3) and acetylation of histone H3 Lys27 (H3K27ac) have been associated with active promot-ers [10, 14], and monomethylation of histone H3 Lys4 (H3K4me1) and H3K27ac have been detected in active enhancers [10, 15, 16]. Therefore, histone-modified marks allow the genome-wide prediction of regulatory elements.
Although enhancer elements are known to be associ-ated with certain histone modifications, the relationship of these modifications with gene expression has not been clearly defined [17–19]. H3K4me1 modification-based prediction of enhancers has been widely used, but a sig-nificant percentage of the enhancers were inactive when tested in reporter assays, suggesting that many of them might not function to promote activity-regulated tran-scription [10, 20]. Moreover, several lines of evidence indicate that H3K4me1 can mark active enhancers as well as those in a poised state [15, 21]. Poised enhancers con-tain information about the future developmental poten-tial of cells, as well as their ability to respond to external stimuli [22–24]. Several studies have shown that the subset of H3K4me1-enriched enhancers that also have H3K27ac enrichment are actively engaged in regulating transcription. In addition, H3K27ac has been shown to be a reliable marker for active enhancers in mammalian systems and in Drosophila [15, 22]. These studies sug-gested that the presence of the H3K27ac modification might mark enhancers and that putative enhancers dis-play an increase in H3K27ac in response to stimuli that are functionally engaged in regulating gene transcription. This may be useful in identifying functionally relevant activity-dependent enhancers.
The silkworm, Bombyx mori, a typical representative of metamorphic insects, is of great agricultural and eco-nomic importance [25]. The steroid hormone ecdysone (20-hydroxyecdysone, 20E) plays an important role dur-ing major developmental transitions and is crucial for various important biological processes in metamorphic insects [26–28]. The molecular mechanisms underly-ing the transduction of a hormonal signal into a tran-scriptional response have been well studied [29–33]. The active form of ecdysone binds to a heterodimer of the ecdysone receptor (EcR) and ultraspiracle (USP) to form a functional receptor and triggers the transcrip-tion of primary and secondary response genes in spe-cific tissues [26, 34]. The EcR/USP complex binds to ecdysone response elements (EcREs), specific sequences near ecdysone-responsive target genes, to regulate gene transcription [35]. However, functional studies of
cis-regulatory elements have been restricted to a small number of sequences that were originally identified by promoter analysis of ecdysone-induced genes. For exam-ple, Hsp27, Eip28/29, Fbp1, and Sgs-4 are induced directly by ecdysone and contain an EcRE in their basal promoter region [36–38]. The total number of identified ecdysone-responsive enhancers is not comparable to the hundreds of genes that are regulated by the hormone in different cell types. Because of the lack of a comprehensive map of cis-regulatory elements, it has remained unclear how a single hormone via its nuclear receptor can elicit dif-ferent regulatory and physiological responses in difdif-ferent cell types [39]. While the interactions between ecdysone and its responsive transcription factors have been well characterized at the molecular level [30], the mechanism of EcR regulation of ecdysone-responsive gene expres-sion at the genome level remains unclear.
In this study, we carried out chromatin immunopre-cipitation sequencing (ChIP-seq) with antibodies for EcR and three different histone marks to identify ecdysone-responsive regulatory elements, using silkworm embry-onic (BmE) cells treated with 20E. We then correlated the histone profiles with genome-wide gene expression levels obtained by RNA sequencing (RNA-seq), to infer functional states of histone modifications and to link the regulatory elements to their target genes. We expected this integrative analysis to provide novel insights into the complex regulatory landscape of hormone-responsive cell activity.
Results
Identification and characterization of H3K4me1, H3K4me3, and H3K27ac sites
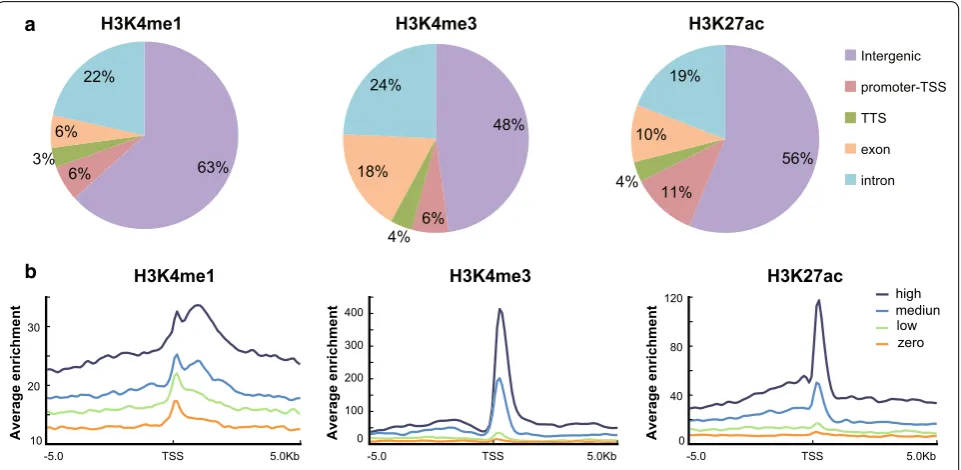
To investigate genome-wide alterations in histone modi-fications and to identify ecdysone-responsive enhancers in silkworm BmE cells, we performed ChIP-Seq using antibodies against H3K4me1, H3K4me3, and H3K27ac before and after 20E treatment. Previous studies have shown that H3K4me3 is an active mark that is often found in the proximal promoter region, while H3K4me1 is generally associated with enhancers located in the dis-tal promoter region [18, 19]. H3K27ac has been shown to selectively mark active regions. In total, we identi-fied 10,768 H3K4me3 peaks, 7266 H3K4me1 peaks, and 17,487 H3K27ac peaks after 20E treatment, respectively (Additional file 1).
of H3K4me1, only 37% (2688) of the peaks intersected with genes or their proximal promoters, and most peaks appeared in the intergenic regions, which is consist-ent with the fact that H3K4me1 is generally associated with distal cis-regulatory elements [40]. H3K27ac was mainly distributed in the intergenic and proximal pro-moter regions, between H3K4me1 and H3K4me3. The genomic distribution of all of three histone marks did not show significant changes after 20E treatment (Additional file 2a), which suggests that the genomic distribution of these histone marks is quite stable.
Composite profiles of each histone modification around the transcription start site (TSS) were gener-ated according to the expression level of the correspond-ing gene (Fig. 1b). H3K27ac and H3K4me3 signals were enriched around the TSS and were positively correlated with the gene expression levels. In contrast, H3K4me1 signal was lower in the 2 kb upstream or downstream of the TSS, and the peak signals were also positively corre-lated with the gene expression levels. No differences in the distribution patterns of these histone modifications were observed after 20E treatment (Additional file 2b). The distribution profiles of H3K27ac, H3K4me3, and H3K4me1 in our ChIP-seq analysis were consistent with the well-known distribution pattern of histone modifica-tions, indicating strong reliability of our ChIP-seq data [41, 42].
Genome‑wide changes in histone modifications induced by treatment with 20E
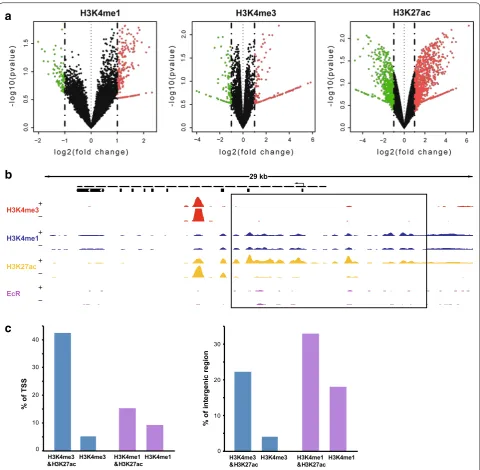
To examine whether histone modification statuses were altered throughout the genome by treatment with 20E, we firstly report the overlap of called peaks between 20E-treated BmE cells (“Treated”) and DMSO-treated BmE cells (“Control”). The results showed that about 60% of H3K4me1 sites overlapped before and after 20E treatment, and corresponding to 95.4% of H3K4me3 sites and 84% of H3K27ac sites. It’s worth noting that the number of altered H3K4me1 sites was similar to altered H3K27ac sites. Besides, histone modification signals were searched between 20E-treated and DMSO-treated BmE cells, and the differences in signals based on direct overlap of called peak were evaluated (Fig. 2a). A number of regions with altered signals of H3K27ac by 20E treat-ment were observed. On the other hand, there were few regions in which the signals of H3K4me3 and H3K4me1 were altered by 20E treatment. For example, compared to H3K4me3 and H3K4me1, H3K27ac was increased at the nuclear receptor HR3 locus (Fig. 2b). The HR3 is essen-tial for developmental switches during insect develop-ment and metamorphosis regulated by ecdysone [43, 44]. A substantial increase in H3K27ac at the HR3 regulatory regions was correlated with an increase in HR3 mRNA (Gene ID: BMgn009688). These results suggested that H3K27ac changed more dynamically after 20E treatment,
-5.0 TSS 5.0Kb
10 20 30
Average enrichment
H3K4me1
-5.0 TSS 5.0Kb
0 100 200 300 400
Average enrichment
H3K4me3
-5.0 TSS 5.0Kb
0 40 80 120
Average enrichmen
t
H3K27ac
high mediun low zero
63% 6%
3% 6%
22%
48%
6% 4% 18%
24%
56% 11%
4% 10%
19% Intergenicpromoter-TSS
TTS exon intron
H3K4me1 H3K4me3 H3K27ac
a
b
and the activity-dependent increase in H3K27ac at the
HR3 locus might be required for HR3 transcription. The distributions of H3K4me1, H3K4me3, and H3K27ac suggested that these three modifications might
differentially collaborate in different genome regions (Fig. 1a). We firstly calculated the overlap between each histone modification after 20E treatment (Additional file 3). Nearly 28.9% and 52.3% H3K27ac sites overlapped
10 20 30
H3K4me3
&H3K27acH3K4me3 H3K4me1&H3K27acH3K4me1
% of
in
te
rg
en
ic
re
gi
on
10 20 30 40
H3K4me3
&H3K27acH3K4me3 H3K4me1&H3K27acH3K4me1
%
of
TS
S
0 0
29 kb
H3K4me3
H3K4me1
H3K27ac
EcR
a
b
c
with H3K4me1 and H3K4me3 sites, respectively. A rela-tively small amount of H3K4me1 sites colocalizated with H3K4me3 sites. We also determined the degree of co-occurrence of H3K4me1 and H3K4me3 at the TSSs of all genes and of H3K4me1 and H3K27ac for all intergenic regions throughout the genome (Fig. 2c). Among all TSSs, approximately 6746 (42.90%) were marked by both H3K27ac and H3K4me3, while only about 2359 (15%) TSSs were marked by both H3K27ac and H3K4me1. This suggested that H3K4me3 modification preferen-tially might collaborate with H3K27ac modification at or near TSSs. In the intergenic regions, about 4011 regions (33.2%) were marked with both H3K27ac and H3K4me1 and 963 regions (17.25%) were marked only with H3K4me1. In contrast, approximately 1699 regions (22%) were marked by both H3K27ac and H3K4me3, which demonstrated that H3K4me1 modification prefer-entially collaborates with H3K27ac modification in inter-genic regions. Together, these results showed differential collaboration of H4K4me3, H3K4me1, and H3K27ac in different genomic regions and suggested that synergy of histone modifications might be useful to identify tran-scriptional regulatory elements.
Identification and characterization of enhancers
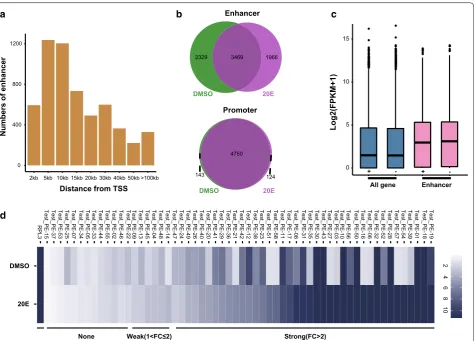
Enhancer prediction on the basis of histone modification marks is currently widely used, and recent genome-wide studies have shown that enhancers are DNA sequences that are marked with H3K4me1 modification and pro-moter regions can be defined as regions with H3K4me3 modification [20, 45]. Based on these studies, we defined enhancers as distal regulatory elements (DRE) harboring H3K4me1 binding sites that were 1.5 kb away from TSSs. Promoters were defined as DNA regions with H3K4me3 binding sites that were located within 1.5 kb from TSSs. We identified 5841 DREs and 4931 putative promoter ele-ments after 20E treatment (Additional file 4). The DREs we defined were mainly distributed in the intergenic regions (Additional file 5a), similar to the distribution of the H3K4me1 modification. The distances between DREs and the TSSs of the nearest genes varied greatly, mainly from 5 to 10 kb (Fig. 3a), which is consistent with the fact that DREs can function at variable distances upstream or downstream of target genes. Notably, some DREs were located more than 100 kb from the TSS of their target gene, and they presumably form a promoter–enhancer loop by chromatin folding that regulates gene transcrip-tion [46, 47]. We found that 41.1% of DREs were specifi-cally modified versus only 4.1% of promoters after 20E treatment (Fig. 3b). This indicated that DREs changed dynamically after 20E treatment, and genes might be reg-ulated mainly by DREs in cells stimreg-ulated with ecdysone.
We assigned DREs to their nearest genes and quanti-fied the expression of these genes using RNA-seq data. The results showed that the average expression of the genes nearest to the DREs was higher than the average expression of all genes (Fig. 3c). This indicated that the presence of the DREs identified in this study correlated well with increased activity of the nearest genes. We ran-domly selected 58 candidate enhancers from DREs for validation by luciferase assays before and after 20E treat-ment. The data was supplemented in Additional file 6. As enhancers were defined as H3K4me1 sites that were devoid of H3K4me3 modification, all of 58 enhancer elements were H3K4me1-positive and H3K4me3-neg-ative. The results showed that 46 out of the 58 (79.3%) candidate enhancers could increase reporter expres-sion, and 39 out of the 58 (57.7%) candidate enhancers increased significantly high reporter expression (≥ two-fold) (Fig. 3d). We observed that the activities of these 39 strong enhancers were differentially affected by ecdysone. For example, the enhancers of Vrille and Laminin showed reduced activity after 20E treatment. Vrille was a circa-dian rhythm-related gene and Laminin encoded a struc-tural protein. Both of them were critical to cell structure and physiological activities. 20 enhancers among 39 strong enhancers increased reporter gene expression lev-els upon 20E treatment, including those of the ecdysone response genes EcR and Eip75B. It was worth noting that most these 20 enhancers were H3K27ac-positive only after 20E. Besides, 17 enhancers were active at simi-lar levels before and after 20E treatment, including the enhancers of Serpin14 and zfh1. Together, these results indicated that enhancers can enhance gene expression to varying degrees, and their activities are modulated by the steroid hormone ecdysone.
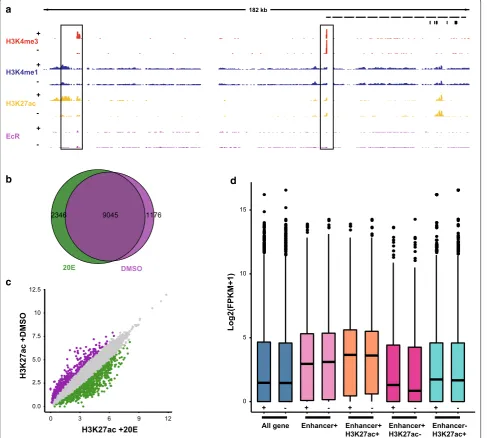
Ecdysone regulates the dynamics of H3K27ac at enhancers H3K27ac modification and DREs were dramatically altered after 20E treatment (Figs. 2a, 3b). Thus, we inves-tigated the pattern of H3K27ac at known ecdysone-responsive enhancers. Broad-Complex (Br-C) is an early ecdysone-responsive gene encoding a family of zinc-finger transcription factors, which play an important role in the metamorphosis of insects (Fig. 4a). Activity-dependent induction of Br-C transcription is mediated by two experimentally confirmed proximal and distal regulatory elements [48]. We found a substantial increase in H3K27ac enrichment in the distal regulatory element, which correlated with an increase in Br-C mRNA. This indicated that the steroid hormone ecdysone regulates the enrichment of H3K27ac at DREs, which might be a key step in gene expression.
promoters, and we analyzed the genomic distribution of the remaining H3K27ac peaks before and after 20E treatment (Fig. 4b). The results showed that 2346 distal H3K27ac peaks were detected only after 20E treatment, which indicated that ecdysone regulates the dynam-ics of distal H3K27ac. Genome-wide quantification of H3K27ac levels at DREs revealed that 741 DREs exhib-ited an at least twofold increase in H3K27ac after 20E treatment (Fig. 4c). Most DREs exhibited a stable level of H3K27ac before and after 20E treatment. We also iden-tified 572 sites that underwent a decrease in H3K27ac after 20E treatment. For example, a significant decrease in H3K27ac enrichment upstream of the nuclear recep-tor FTZ-F1 after 20E treatment was observed (Additional file 5b). The FTZ-F1 gene is expressed in most cells in a temporally specific manner and plays important roles
during embryogenesis, larval ecdysis, and early meta-morphic stages [49, 50]. The decrease in H3K27ac was consistent with previous reports that FTZ-F1 expression is induced immediately after the decline in the ecdysone level. Together, these results showed that H3K27ac changed dynamically at DREs after 20E treatment, which indicated that the enrichment of H3K27ac at DREs might determine which among the thousands of DREs are func-tionally engaged in driving ecdysone-responsive gene transcription.
To determine whether H3K27ac enrichment at DREs are indeed capable of stimulating activity-dependent transcription, we compared gene expression among various patterns of H3K27ac modification, includ-ing DREs with H3K27ac modification, DREs with-out H3K27ac, and H3K27ac sites that did not overlap
RPL3 Test_PE-1 5 2 0 400 800 1200
2kb 5kb 10kb 15kb 20kb 30kb 40kb 50kb >100kb
Distance from TSS
Numbers of enhancer
0 5 10 15
+ - +
-All gene Enhancer
Log2(FPKM+1
)
2329 3469 1966
143 124
4750
a b Enhancer c
Promoter
DMSO 20E
DMSO 20E
d
None Weak(1<FC≤2) Strong(FC>2) DMSO 20E 46 10 8 Test_PE-3 7 Test_PE-2 5 Test_PE-5 3 Test_PE-0 7 Test_PE-3 4 Test_PE-0 5 Test_PE-3 3 Test_PE-4 4 Test_PE-5 5 Test_PE-0 2 Test_PE-4 6 Test_PE-2 2 Test_PE-0 9 Test_PE-1 3 Test_PE-4 5 Test_PE-0 4 Test_PE-4 8 Test_PE-1 4 Test_PE-4 7 Test_PE-2 4 Test_PE-4 9 Test_PE-2 6 Test_PE-4 0 Test_PE-2 0 Test_PE-2 9 Test_PE-3 6 Test_PE-4 1 Test_PE-2 1 Test_PE-4 2 Test_PE-1 2 Test_PE-3 8 Test_PE-2 3 Test_PE-5 1 Test_PE-5 8 Test_PE-1 1 Test_PE-1 7 Test_PE-0 8 Test_PE-3 1 Test_PE-3 5 Test_PE-3 0 Test_PE-4 3 Test_PE-2 7 Test_PE-0 3 Test_PE-1 0 Test_PE-5 6 Test_PE-5 0 Test_PE-1 6 Test_PE-0 6 Test_PE-3 2 Test_PE-5 2 Test_PE-2 8 Test_PE-5 7 Test_PE-5 4 Test_PE-3 9 Test_PE-0 1 Test_PE-1 8 Test_PE-1 9
with DREs. We assigned regulatory elements from each of these groups to the nearest gene and quanti-fied the expression of these genes using RNA-seq data. We found that the expression levels of the genes near-est to the DREs strongly correlated with the levels of H3K27ac in their respective DREs both before and after 20E treatment (Fig. 4d). The average expression
of the genes the closest to DREs with H3K27ac enrich-ment was higher than that of genes the closest to DREs without H3K27ac enrichment. When taking all DREs in consideration, the average expression of their nearest genes was also higher than that of genes the closest to DREs without H3K27ac enrichment. This indicated that H3K27ac enrichment is a deterministic
182 kb
H3K4me3
H3K4me1
H3K27ac
EcR
+
-+ -+ -+
-0.0 5.0 10
12 H3K27ac +20E
H3K27ac +DMS
O
0 5 10 15
+ - + - + - + - +
-Log2(FPKM+1)
All gene Enhancer+ Enhancer+
H3K27ac+ Enhancer+H3K27ac- Enhancer-H3K27ac+ a
b d
c
0 3 6 9
2.5 7.5 12.5
2346 9045 1176
20E DMSO
feature of active DREs and that H3K27ac enrichment at DREs activates transcription of ecdysone-responsive genes. H3K27ac sites that did not overlap with DREs also exhibited a correlation with activity-dependent expression of the nearest gene, suggesting that these sites might also act as putative enhancers under the given chromatin environment.
We investigated the functions of the nearest genes associated with each of the above patterns of H3K27ac modification using Gene Ontology (GO) analysis (Additional file 5c). We found that the nearest genes for all DREs were enriched for processes related to sig-nal transduction and energy metabolism. The genes closest to the DREs with H3K27ac enrichment were enriched for lipid metabolism and DNA biosynthesis, which are associated with ecdysone activity [51]. Some ecdysone-responsive genes, such as Eip74, Eip75, and
Br-C, were enriched in these pathways. The genes closest to the DREs without H3K27ac enrichment were less enriched for genes related to the ecdysone signal pathway. This result indicated that H3K27ac enrich-ment at DRE stimulates ecdysone-dependent gene transcription. Taken together, DREs are functionally engaged in regulating gene transcription by the enrich-ment in H3K27ac in response to ecdysone activity.
EcR binds regulatory elements to regulate ecdysone‑responsive genes
To determine how cis-regulatory elements modulate
ecdysone-responsive gene expression, we performed ChIP-seq with an antibody against EcR using BmE cells after 24 h of 20E treatment. We identified 2849 peaks after mapping the EcR-binding regions to the silkworm genome (Additional file 7). Relative to the 16% of EcR peaks that were mapped to proximal promoter (− 1 kb to + 200 bp) regions, a large fraction of the EcR peaks (65%) were distributed in the intergenic regions (Fig. 5a). We then mapped the locations of EcR peaks to promoter and DREs regions: 374 and 376 EcR peaks overlapped with DREs and promoter elements, respectively (Fig. 5b). Some EcR peaks were located in the DREs of known ecdysone-responsive genes, such as Eip75, Br-C, and
CYP450. These results suggested that EcR can regulate target gene expression not only by binding to proximal promoters, but also by binding to DREs.
Previous studies have shown that EcR binds to the EcRE sites of genes to activate their transcription. We found that 1417 EcR peaks (52.65%) were located in a region that contained at least one EcRE motif (Fig. 5c and Additional file 8). In these regions, we also identified the USP-binding motif (Fig. 5c); USP binds with EcR to form
65% 16%
3%5% 11% ECR
Intergenic promoter-TSS TTS exon intron
a b c
d
Promoter EcR Enhancer
16.4 kb
H3K4me3
H3K4me1
H3K27ac
EcR
+ -+ -+ -+
-364 2111 374 5467
4567
EcR:USP motif
0 1 2
bits
0 1 2
bits
1 2 3 4 5 6 7 8 9 10 11 12 13 14 15
1 2 3 4 5 6 7 8 9 10 11 12 13 14 15
16 17 18 19 20 21 usp motif
0 1 2
bits
1 2 3 4 5 6 7 8 9 10 11 12 13 14 15 16 17 18 19 20 21 22 23 24 0
1 2
bits
1 2 3 4 5 6 7 8 9 10 11 pnr motif
sd motif
a heterodimeric receptor complex. This indicated that functional EcR/USP heterodimer directly binds to EcREs of ecdysone-responsive genes to induce transcriptional activation. However, approximately half of the regions associated with EcR peaks did not contain an EcRE motif. In contrast, we found that the motif of TALE-type homeodomain transcription factors, pnr, and that of TEA domain transcription factors, sd, were significantly enriched in these EcR peak-associated regions (Fig. 5c). For example, we identified three EcR peaks in the argi-nine methyltransferase locus (Fig. 5d), of which only the most downstream EcR peak was enriched for the EcRE motif. Motifs of homeodomain factors, such as mirr and ptx1, were enriched in two other EcR peak regions (Additional file 9a). This indicated that parts of EcRs might bind with other factors to form a complex instead of binding to EcRE to directly regulate gene expression. In addition, we observed that the average expression of genes associated with the two types of EcR peaks was similar and higher than the average expression of all genes (Additional file 9b). Taken together, these data sug-gested that EcR regulates the expression of target genes not only by directly binding to EcREs in the regulatory regions, but also by cooperating with other transcription factors.
Discussion
In this study, we used ChIP-seq to characterize the altera-tions in three histone modificaaltera-tions induced by the pres-ence of ecdysone in silkworm embryonic cells and to generate an ecdysone-responsive regulatory element map for the silkworm. We demonstrated that most of the DREs identified could induce reporter expression and were consistent with target gene expression. The enrich-ment of H3K27ac at DREs in response to 20E treatenrich-ment might facilitate gene expression. Our results indicated that EcR could bind not only proximal promoters, but also DREs. Moreover, nearly half of the genome regions associated with EcR peaks contained EcRE motifs, and those without EcRE motifs might bind with other tran-scription factors instead of directly binding to EcR to reg-ulate gene expression, which reflected the complexity of ecdysone-mediated gene transcription.
The identification of stimulus-responsive enhancers by genomic mapping of certain chromatin features has pro-vided important insights into spatiotemporal patterns of gene expression [52]. Given the widespread use of his-tone modifications to predict enhancers, it is interesting that there is no consensus about which marks should be used [45]. Although our functional assay demonstrated that most of the regions displaying H3K4me1 marks are associated with enhancers, one-third of the H3K4me1-marked regions assayed exhibited no signs of enhancer
activity (Fig. 3d). These sequences could be promoter-specific enhancers or enhancers that act in concert with other sequences not tested in our assays. These results imply that none of the known modifications correlates perfectly with enhancer activity, and even combina-tions of marks are not perfect predictors [18]. Thus, it will be interesting to learn about the functional roles of such marks and their combinations, and how these will improve enhancer predictions. In addition, 11 out of the 58 enhancers identified by our luciferase assay exhib-ited activity only upon 20E treatment (Fig. 3d). This result suggested that enhancer activity depends on spe-cific conditions and certain putative enhancers become active only following a specific stimulus. Furthermore, we scanned all of these 58 enhancer elements sequence for EcR motif enrichment and found that 41.3% of ecdysone-responsive enhancers contained EcR motif relative to 25% of enhancers that did not respond to ecdysone. This result indicated that the ecdysone-responsive enhancers were more likely to exhibit EcR binding or an EcR motif. However, further evidence needs to be provided in future studies.
Our systematic genome-wide study of histone modi-fications provided several surprising insights into tran-scriptional regulation. Although H3K27ac modifications have been shown to be present at a subset of enhancers, the relationship between them remained unclear [4]. Our data showed that the enrichment of H3K27ac at enhanc-ers changed dynamically, and the enrichment of H3K27ac at enhancers was consistent with high expression of the nearest genes (Fig. 4d). Our results supported the exist-ence of poised enhancers that have been previously reported, and elements existing in a poised state were activated after 20E treatment [15]. We could discrimi-nate between active and inactive enhancer regions on the basis of H3K27ac enrichment, thus obtaining more general information about the activity of cells in response to ecdysone hormone. These data are compatible with a temporal scenario in which poised enhancers marked by H3K4me1 acquire H3K27ac when activated and lose this mark when inactivated [14, 23, 24]. However, the confir-mation of this scenario requires further study.
Ecdysone signals are important regulators of insect development during molts and metamorphosis. Ecdysone activates a number of ecdysone-responsive genes through a heterodimeric receptor complex [34]. Interestingly, some of the most strongly up-regulated genes, including the known ecdysone targets Eip75, br,
strongly up-regulated genes, such as Eip93, appeared to be strongly regulated via a single enhancer. Previous studies have shown that EcREs are mainly located in the promoter regions and bind directly with EcR/USP com-plex to regulate the transcription of ecdysone-responsive genes [54, 55]. Our results showed that the EcR-binding regions were identified not only in promoter regions of target genes, but also in DREs (Fig. 5b). Relative to proxi-mal EcR-binding regions, motifs in distal elements varied greatly, and different classes of factors were enriched, including the C2H2 zinc finger factor, CTCF, the homeo-domain factor, Optix, the Fork head/winged-helix factor, br, the SMAD/NF-1 DNA-binding domain factor, Mad, and the SAND domain factor, Deaf1 (Additional file 9c). These transcription factors are encoded by different gene families and might be consistent with the different func-tions of distant enhancers [56, 57]. Moreover, numerous EcR peaks were identified in intergenic regions and they did not overlap with promoters and DREs (Fig. 5a, b). For example, we found several EcR peaks 3 kb upstream of the fisd gene, and no DREs were identified within this region. This supports that EcR can bind to other types of regulatory elements, such as silencers to regu-late target gene expression [58]. Half of the EcR peaks were in regions that contained EcRE motifs, indicat-ing target gene expression regulation by direct bindindicat-ing. Nearly half of the EcR peaks contained binding motifs for other transcription factors, which might firstly bind with EcR to form a complex and then bind to regula-tory regions of target genes. Similarly, among 39 strongly induced enhancers that were validated by the reporter assay (Fig. 3d), 17 enhancers contained EcRE motifs and 22 enhancers without EcRE motifs contained motifs for other transcription factors. This indicated that EcR can regulate target gene expression in a direct and an indi-rect manner. Combined, our results show that ChIP-seq in combination with 20E treatment has strong poten-tial in identifying novel genome regions associated with ecdysone response.
Methods Cell culture
Silkworm embryo-derived BmE cells were cultured in Grace’s insect medium (Gibco, Gaithersburg, MD, USA) supplemented with 10% fetal bovine serum at 27 °C. Unless stated otherwise, we used 20E (Sigma, St. Louis, Missouri, USA) at a concentration of 41 mM and an incubation time of 24 h.
RNA‑seq
Approximately 106 BmE cells were treated with DMSO or 20E for 24 h in triplicate. Total RNA was isolated using TRIzol reagent (Invitrogen) according to the
manufacturer’s protocol and was treated with DNase I. Purified RNA was prepared for sequencing with the Illumina mRNA-seq Sample Prep Kit. Samples were sequenced on an Illumina HiSeq 2500 (150-bp paired-end reads). For each sample, more than 25 million clean reads were obtained.
The quality of the raw and processed reads was evalu-ated using FastQC (version 0.11.6). Raw data were pro-cessed using Trimmomatic (version 0.36) to remove reads containing adapter sequences and low-quality reads [59]. We used STAR (version 2.5) to map the paired-end clean reads to the silkworm reference genome down-loaded from KAIKObase (http://sgp.dna.affrc .go.jp/index .html) [60]. We retained only uniquely mapped reads with up to three mismatches. RSEM (version 1.3.0) was used to quantify the expression level of each gene [61]. We intersected the mapped reads with gene annotations from KAIKObase and calculated reads per kilobase mil-lion (RPKM) values of mapped reads (Additional file 10). Differential gene expression across the samples was ana-lyzed using DESeq2 [62]. Differentially expressed genes were classified and analyzed by GO enrichment.
ChIP‑seq
Approximately 108 BmE cells were treated with DMSO or 20E for 24 h. ChIP-seq was performed as previously described with minor modifications [63]. Briefly, the treated cells were fixed with 1% formaldehyde for 10 min at 37 °C. The fixed cells were lysed and the chromatin was sonicated to a size range of 200–600 bp. Solubilized chromatin was incubated with 10 μg antibody over-night at 4 °C. The following antibodies were used: anti-H3K27ac (17-683, Millipore), anti-H3K4me3 (17-614, Millipore), H3K4me1 (07-436, Millipore), and anti-EcR (DDA2.7, Covance). Immunoprecipitated chromatin was washed, eluted, and subjected to cross-link reversal. Following RNase A and proteinase K treatments, the DNA was purified by phenol–chloroform extraction and ethanol precipitation. The ChIP DNA was prepared for sequencing using the TruSeq ChIP Library Preparation Kit (IP-202-1012; Illumina) according to the manufac-turer’s protocol. Samples were PCR-enriched for paired-end sequencing on the Illumina HiSeq 2500 platform. For each sample, more than 20 million clean reads were obtained.
which were subsequently used for visualization purposes and for obtaining average signal profiles. Motifs were searched using MEME Suite 4.12.0 (http://meme-suite .org/) and RSAT peak-motifs with default parameters [66]. Compare discovered motifs with JASPAR core non-redundant insect (2018) databases (http://jaspa r.gener eg.net/).
Identification of regions with altered histone modifications by 20E
The regions with altered signals of histone modifications induced by 20E were identified by comparing the ChIP-seq tag counts between the 20E-treated and DMSO-treated BmE cells. The differences in signals based on direct overlap of called peak were evaluated by DEseq2.
Peak location
To determine the locations of H3K4me1, H3K4me3, H3K27ac, and EcR peaks, we firstly divided the whole genome into five unique regions according to gene set annotations (exon, intron, promoter-TSS (− 1 kb to
+ 200 bp TSS), TTS and intergenic region). Then, we assigned each peak to these regions. For some peaks that overlapped with several annotation regions, only peak summit sites were considered.
Definition of enhancers based on ChIP‑Seq data
We used H3K4me1 sites to define enhancers accord-ing to a previous study [67]. Excluding H3K4me1 sites that were located outside 1.5 kb of the TSS, the remain-ing H3K4me1 sites were defined as distal regulatory ele-ments (DRE). DREs that overlapped with H3K27ac were defined as active DREs. Similarly, H3K4me3 sites that located within 1.5 kb of the TSS were defined as promot-ers, and promoters that overlapped with H3K27ac were regarded as active promoters. Target genes of enhancers were assigned according to their distance to the near-est gene TSS (using closnear-estBed in Bedtools). The nearnear-est genes were functionally analyzed using GO enrichment.
Luciferase reporter assays
We randomly selected 58 H3K27ac-positive candidate enhancer elements after 20E treatment for luciferase assays. As enhancers were defined as H3K4me1 sites that were devoid of H3K4me3 modification, all of 58 enhancer elements were H3K4me1-positive and H3K4me3-negative. To test enhancer function in a reporter assay, we generated reporter constructs based on the pGL3-promotor back-bone (Promega) by replacing the SV40 promoter sequence between BglII and HindIII with the core hsp70 promoter. Enhancers varied in size, and we used only approximately 1-kb regions around the center of enhancers as candidate enhancers. Candidate enhancers were PCR-amplified from
silkworm genomic DNA, cloned into the reporter vec-tor, and verified by Sanger sequencing. The primers used to amplify candidate enhancers are listed in addition files (Additional file 6). BmE cells (1 × 10⁵) were transfected with 110 ng of DNA, including 10 ng of Hrp3 vector as a transfection control, using X-tremeGENE HP DNA Trans-fection Reagent (Roche). After transTrans-fection for 24 h, the BmE cells were treated with 20E or DMSO for 24 h. Then, enhancer activity was measured by luciferase assay using the Dual luciferase kit (Promega) according to the manu-facturer’s instructions. Four replicates were included for each candidate enhancer.
Additional files
Additional file 1. ChIP-seq enriched peaks of H3K4me3, H3K4me1, and H3K27ac after 20E treatment.
Additional file 2. Genome-wide distribution of H3K4me1, H3K4me3, and
H3K27ac modifications. a Pie charts showing the distribution of H3K4me-,
H3K4me3-, and H3K27ac-enriched regions across the genome after 20E
treatment. “Promoter-TSS” indicates the region − 1 kb to + 200 bp of the
TSS. b Average ChIP-seq signal profiles for genes with different expression
levels were generated for the histone modifications around the TSS after 20E treatment. Genes are divided into four categories according to their mRNA levels: no expression, low-level expression, medium-level expres-sion, and high-level expression.
Additional file 3. The overlap of each histone modification sites after 20E treatment.
Additional file 4. Putative DREs (enhancers) and promoters were defined through modification-based prediction.
Additional file 5.a The distribution of DREs. b IGV genome browser
tracks of the FTZ-F1 locus with data for indicated histone modifications
and RNA-seq. “+” and “−” indicate the presence and absence of 20E
treatment, respectively. c GO-based gene functions for genes specifically
associated with different types of enhancers. Red bars display functions based on nearest genes to H3K27ac-positive enhancers.
Additional file 6. The primers and histone modification status of 58 candidate enhancer elements were listed. The results of luciferase assays of candidate enhancers were also listed in the last few columns. Additional file 7. ChIP-seq enriched peaks of EcR after 20E treatment. Additional file 8. The list of EcR peaks containing EcRE motif. Additional file 9. Motif analysis of EcR-enriched regions by MEME-ChIP
and RSAT. a Motifs were enriched from EcR-binding sites of the arginine
methyltransferase gene. b Average expression of the nearest genes of
EcR. “EcR + EcRE” indicates EcR-peak regions enriched for the EcRE motif.
“EcR − EcRE” indicated EcR-peak regions not enriched for EcRE motif. c
Motifs enriched in distal EcR enhancer elements.
Additional file 10. RPKM values for RNA-seq in BmE cells after treated with 20E or DMSO.
Abbreviations
transcription start site; FPKM: reads per kilobase million; RPKM: fragments per kilobase million.
Authors’ contributions
DC and TC conceived and designed the experiments and wrote the manu-script. DC and XY performed the experiments. DC, TF, and JG performed bio-informatic analysis. DC, QZ, and JF designed the figures. DC, QX, and TC wrote the manuscript. All authors read and approved the final manuscript.
Author details
1 State Key Laboratory of Silkworm Genome Biology, Southwest
Univer-sity, Chongqing 400715, China. 2 Chongqing Engineering and Technology
Research Center for Novel Silk Materials, Southwest University, 2, Tiansheng Road, Beibei, Chongqing 400715, China.
Competing interests
The authors declare that they have no competing interests.
Availability of data and materials
The datasets supporting the conclusions of this article are available under BioProject accession number PRJNA450142 for ChIP-seq and PRJNA449979
for RNA-seq in the NCBI BioProject database (https ://www.ncbi.nlm.nih.gov/
biopr oject /).
Funding
This work was supported by the National Natural Science Foundation of China (Grant No. 31872296 and 31530071), Chongqing Research Program of Basic Research and Frontier Technology (Grant No. CSTC2018JCYJAX0396), and the Fundamental Research Funds for the Central Universities (Grant No. XDJK2017C075).
Publisher’s Note
Springer Nature remains neutral with regard to jurisdictional claims in pub-lished maps and institutional affiliations.
Received: 18 April 2018 Accepted: 10 August 2018
References
1. Buecker C, Wysocka J. Enhancers as information integration hubs in development: lessons from genomics. Trends Genet. 2012;28(6):276–84. 2. Levine M. Transcriptional enhancers in animal development and
evolu-tion. Curr Biol. 2010;20(17):R754–63.
3. Banerji J, Rusconi S, Schaffner W. Expression of a beta-globin gene is enhanced by remote SV40 DNA sequences. Cell. 1981;27(2 Pt 1):299–308. 4. Smith E, Shilatifard A. Enhancer biology and enhanceropathies. Nat Struct
Mol Biol. 2014;21(3):210–9.
5. Visel A, Rubin EM, Pennacchio LA. Genomic views of distant-acting enhancers. Nature. 2009;461(7261):199–205.
6. Spitz F, Furlong EE. Transcription factors: from enhancer binding to devel-opmental control. Nat Rev Genet. 2012;13(9):613–26.
7. Yanez-Cuna JO, Dinh HQ, Kvon EZ, Shlyueva D, Stark A. Uncovering cis-regulatory sequence requirements for context-specific transcription factor binding. Genome Res. 2012;22(10):2018–30.
8. Consortium EP. An integrated encyclopedia of DNA elements in the human genome. Nature. 2012;489(7414):57–74.
9. modENCODE, Roy S, Ernst J, Kharchenko PV, Kheradpour P, Negre N, et al. Identification of functional elements and regulatory circuits by Dros-ophila modENCODE. Science. 2010;330(6012):1787–97.
10. Heintzman ND, Hon GC, Hawkins RD, Kheradpour P, Stark A, Harp LF, et al. Histone modifications at human enhancers reflect global cell-type-specific gene expression. Nature. 2009;459(7243):108–12.
11. Rada-Iglesias A, Bajpai R, Swigut T, Brugmann SA, Flynn RA, Wysocka J. A unique chromatin signature uncovers early developmental enhancers in humans. Nature. 2011;470(7333):279–83.
12. Negre N, Brown CD, Ma L, Bristow CA, Miller SW, Wagner U, et al. A cis-reg-ulatory map of the Drosophila genome. Nature. 2011;471(7339):527–31.
13. Shen Y, Yue F, McCleary DF, Ye Z, Edsall L, Kuan S, et al. A map of the cis-regulatory sequences in the mouse genome. Nature. 2012;488(7409):116–20.
14. Bonn S, Zinzen RP, Girardot C, Gustafson EH, Perez-Gonzalez A, Del-homme N, et al. Tissue-specific analysis of chromatin state identifies temporal signatures of enhancer activity during embryonic develop-ment. Nat Genet. 2012;44(2):148–56.
15. Creyghton MP, Cheng AW, Welstead GG, Kooistra T, Carey BW, Steine EJ, et al. Histone H3K27ac separates active from poised enhanc-ers and predicts developmental state. Proc Natl Acad Sci U S A. 2010;107(50):21931–6.
16. Heintzman ND, Stuart RK, Hon G, Fu Y, Ching CW, Hawkins RD, et al. Distinct and predictive chromatin signatures of transcriptional promoters and enhancers in the human genome. Nat Genet. 2007;39(3):311–8. 17. Bell O, Tiwari VK, Thoma NH, Schubeler D. Determinants and dynamics of
genome accessibility. Nat Rev Genet. 2011;12(8):554–64.
18. Calo E, Wysocka J. Modification of enhancer chromatin: what, how, and why? Mol Cell. 2013;49(5):825–37.
19. Fick RJ, Trievel RC. An overview of chromatin modifications. Biopolymers. 2013;99(2):95–7.
20. Visel A, Blow MJ, Li Z, Zhang T, Akiyama JA, Holt A, et al. ChIP-seq accurately predicts tissue-specific activity of enhancers. Nature. 2009;457(7231):854–8.
21. Cui K, Zang C, Roh TY, Schones DE, Childs RW, Peng W, et al. Chromatin signatures in multipotent human hematopoietic stem cells indi-cate the fate of bivalent genes during differentiation. Cell Stem Cell. 2009;4(1):80–93.
22. Bogdanovic O, Fernandez-Minan A, Tena JJ, de la Calle-Mustienes E, Hidalgo C, van Kruysbergen I, et al. Dynamics of enhancer chromatin sig-natures mark the transition from pluripotency to cell specification during embryogenesis. Genome Res. 2012;22(10):2043–53.
23. Malik AN, Vierbuchen T, Hemberg M, Rubin AA, Ling E, Couch CH, et al. Genome-wide identification and characterization of functional neuronal activity-dependent enhancers. Nat Neurosci. 2014;17(10):1330–9. 24. Koenecke N, Johnston J, Gaertner B, Natarajan M, Zeitlinger J.
Genome-wide identification of Drosophila dorso-ventral enhancers by differential histone acetylation analysis. Genome Biol. 2016;17(1):196.
25. Xia Q, Li S, Feng Q. Advances in silkworm studies accelerated by the genome sequencing of Bombyx mori. Annu Rev Entomol. 2014;59:513–36.
26. Yamanaka N, Rewitz KF, O’Connor MB. Ecdysone control of developmen-tal transitions: lessons from Drosophila research. Annu Rev Entomol. 2013;58:497–516.
27. Ashwell JD, Lu FW, Vacchio MS. Glucocorticoids in T cell development and function*. Annu Rev Immunol. 2000;18:309–45.
28. Nicolson S, Denton D, Kumar S. Ecdysone-mediated programmed cell death in Drosophila. Int J Dev Biol. 2015;59(1–3):23–32.
29. Ashburner M, Chihara C, Meltzer P, Richards G. Temporal control of puff-ing activity in polytene chromosomes. Cold Sprpuff-ing Harb Symp Quant Biol. 1974;38:655–62.
30. Di Cara F, King-Jones K. How clocks and hormones act in concert to con-trol the timing of insect development. Curr Top Dev Biol. 2013;105:1–36. 31. Belles X, Piulachs MD. Ecdysone signalling and ovarian development in
insects: from stem cells to ovarian follicle formation. Biochim Biophys Acta. 2015;1849(2):181–6.
32. Andres AJ, Thummel CS. Hormones, puffs and flies: the molecular control of metamorphosis by ecdysone. Trends Genet. 1992;8(4):132–8. 33. Qian W, Kang L, Zhang T, Meng M, Wang Y, Li Z, et al. Ecdysone receptor
(EcR) is involved in the transcription of cell cycle genes in the silkworm. Int J Mol Sci. 2015;16(2):3335–49.
34. Riddiford LM, Cherbas P, Truman JW. Ecdysone receptors and their bio-logical actions. Vitam Horm. 2000;60:1–73.
35. Hurban P, Thummel CS. Isolation and characterization of fifteen ecdysone-inducible Drosophila genes reveal unexpected complexities in ecdysone regulation. Mol Cell Biol. 1993;13(11):7101–11.
36. Riddihough G, Pelham HR. An ecdysone response element in the Dros-ophila hsp27 promoter. EMBO J. 1987;6(12):3729–34.
37. Laval M, Pourrain F, Deutsch J, Lepesant JA. In vivo functional char-acterization of an ecdysone response enhancer in the proximal
upstream region of the Fbp1 gene of D. melanogaster. Mech Dev.
•fast, convenient online submission
•
thorough peer review by experienced researchers in your field
• rapid publication on acceptance
• support for research data, including large and complex data types
•
gold Open Access which fosters wider collaboration and increased citations maximum visibility for your research: over 100M website views per year
•
At BMC, research is always in progress.
Learn more biomedcentral.com/submissions
Ready to submit your research? Choose BMC and benefit from: 38. Andres AJ, Cherbas P. Tissue-specific ecdysone responses: regulation of
the Drosophila genes Eip28/29 and Eip40 during larval development. Development. 1992;116(4):865–76.
39. Gauhar Z, Sun LV, Hua S, Mason CE, Fuchs F, Li TR, et al. Genomic mapping of binding regions for the Ecdysone receptor protein complex. Genome Res. 2009;19(6):1006–13.
40. Zentner GE, Scacheri PC. The chromatin fingerprint of gene enhancer elements. J Biol Chem. 2012;287(37):30888–96.
41. Papait R, Cattaneo P, Kunderfranco P, Greco C, Carullo P, Guffanti A, et al. Genome-wide analysis of histone marks identifying an epigenetic signa-ture of promoters and enhancers underlying cardiac hypertrophy. Proc Natl Acad Sci U S A. 2013;110(50):20164–9.
42. Arnold CD, Gerlach D, Stelzer C, Boryn LM, Rath M, Stark A. Genome-wide quantitative enhancer activity maps identified by STARR-seq. Science. 2013;339(6123):1074–7.
43. Mane-Padros D, Cruz J, Cheng A, Raikhel AS. A critical role of the nuclear receptor HR3 in regulation of gonadotrophic cycles of the mosquito Aedes aegypti. PLoS ONE. 2012;7(9):e45019.
44. Kamae Y, Uryu O, Miki T, Tomioka K. The nuclear receptor genes HR3 and E75 are required for the circadian rhythm in a primitive insect. PLoS ONE. 2014;9(12):e114899.
45. Shlyueva D, Stampfel G, Stark A. Transcriptional enhancers: from proper-ties to genome-wide predictions. Nat Rev Genet. 2014;15(4):272–86. 46. Krivega I, Dean A. Enhancer and promoter interactions-long distance
calls. Curr Opin Genet Dev. 2012;22(2):79–85.
47. Whalen S, Truty RM, Pollard KS. Enhancer-promoter interactions are encoded by complex genomic signatures on looping chromatin. Nat Genet. 2016;48(5):488–96.
48. Nishita Y. Ecdysone response elements in the distal promoter of the Bom-byx Broad-Complex gene, BmBR-C. Insect Mol Biol. 2014;23(3):341–56. 49. Sultan AR, Oish Y, Ueda H. Function of the nuclear receptor FTZ-F1
during the pupal stage in Drosophila melanogaster. Dev Growth Differ. 2014;56(3):245–53.
50. Field A, Xiang J, Anderson WR, Graham P, Pick L. Activation of Ftz-F1-re-sponsive genes through Ftz/Ftz-F1 dependent enhancers. PLoS ONE. 2016;11(10):e0163128.
51. Kamoshida Y, Fujiyama-Nakamura S, Kimura S, Suzuki E, Lim J, Shiozaki-Sato Y, et al. Ecdysone receptor (EcR) suppresses lipid accumulation in the Drosophila fat body via transcription control. Biochem Biophys Res Commun. 2012;421(2):203–7.
52. Wang J, Zhuang J, Iyer S, Lin X, Whitfield TW, Greven MC, et al. Sequence features and chromatin structure around the genomic regions bound by 119 human transcription factors. Genome Res. 2012;22(9):1798–812. 53. Shlyueva D, Stelzer C, Gerlach D, Yanez-Cuna JO, Rath M, Boryn LM,
et al. Hormone-responsive enhancer-activity maps reveal predictive motifs, indirect repression, and targeting of closed chromatin. Mol Cell. 2014;54(1):180–92.
54. Liu X, Dai F, Guo E, Li K, Ma L, Tian L, et al. 20-Hydroxyecdysone (20E) primary response gene E93 modulates 20E signaling to promote Bombyx Larval-Pupal metamorphosis. J Biol Chem. 2015;290(45):27370–83. 55. Niedziela-Majka A, Kochman M, Ozyhar A. Polarity of the ecdysone
recep-tor complex interaction with the palindromic response element from the hsp27 gene promoter. Eur J Biochem. 2000;267(2):507–19.
56. Heinz S, Romanoski CE, Benner C, Glass CK. The selection and function of cell type-specific enhancers. Nat Rev Mol Cell Biol. 2015;16(3):144–54. 57. Darrow EM, Chadwick BP. Boosting transcription by transcription:
enhancer-associated transcripts. Chromosome Res. 2013;21(6–7):713–24. 58. Kyrchanova O, Georgiev P. Chromatin insulators and long-distance
inter-actions in Drosophila. FEBS Lett. 2014;588(1):8–14.
59. Bolger AM, Lohse M, Usadel B. Trimmomatic: a flexible trimmer for Illu-mina sequence data. Bioinformatics. 2014;30(15):2114–20.
60. Dobin A, Davis CA, Schlesinger F, Drenkow J, Zaleski C, Jha S, et al. STAR: ultrafast universal RNA-seq aligner. Bioinformatics. 2013;29(1):15–21. 61. Li B, Dewey CN. RSEM: accurate transcript quantification from RNA-Seq
data with or without a reference genome. BMC Bioinform. 2011;12:323. 62. Love MI, Huber W, Anders S. Moderated estimation of fold change and dispersion for RNA-seq data with DESeq2. Genome Biol. 2014;15(12):550. 63. Lee TI, Johnstone SE, Young RA. Chromatin
immunoprecipita-tion and microarray-based analysis of protein locaimmunoprecipita-tion. Nat Protoc. 2006;1(2):729–48.
64. Langmead B, Salzberg SL. Fast gapped-read alignment with Bowtie 2. Nat Methods. 2012;9(4):357–9.
65. Zhang Y, Liu T, Meyer CA, Eeckhoute J, Johnson DS, Bernstein BE, et al. Model-based analysis of ChIP-Seq (MACS). Genome Biol. 2008;9(9):R137. 66. Medina-Rivera A, Defrance M, Sand O, Herrmann C, Castro-Mondragon JA, Delerce J, et al. RSAT 2015: regulatory sequence analysis tools. Nucleic Acids Res. 2015;43(W1):W50–6.