RESEARCH
Developmental constraint
through negative pleiotropy in the zygomatic
arch
Christopher J. Percival
1*, Rebecca Green
2,3,4, Charles C. Roseman
5, Daniel M. Gatti
6, Judith L. Morgan
6,
Stephen A. Murray
6, Leah Rae Donahue
6, Jessica M. Mayeux
7, K. Michael Pollard
7, Kunjie Hua
8, Daniel Pomp
8,
Ralph Marcucio
9and Benedikt Hallgrímsson
2,3,4*Abstract
Background: Previous analysis suggested that the relative contribution of individual bones to regional skull lengths differ between inbred mouse strains. If the negative correlation of adjacent bone lengths is associated with genetic variation in a heterogeneous population, it would be an example of negative pleiotropy, which occurs when a genetic factor leads to opposite effects in two phenotypes. Confirming negative pleiotropy and determining its basis may reveal important information about the maintenance of overall skull integration and developmental constraint on skull morphology.
Results: We identified negative correlations between the lengths of the frontal and parietal bones in the midline cranial vault as well as the zygomatic bone and zygomatic process of the maxilla, which contribute to the zygomatic arch. Through gene association mapping of a large heterogeneous population of Diversity Outbred (DO) mice, we identified a quantitative trait locus on chromosome 17 driving the antagonistic contribution of these two zygomatic arch bones to total zygomatic arch length. Candidate genes in this region were identified and real-time PCR of the maxillary processes of DO founder strain embryos indicated differences in the RNA expression levels for two of the candidate genes, Camkmt and Six2.
Conclusions: A genomic region underlying negative pleiotropy of two zygomatic arch bones was identified, which provides a mechanism for antagonism in component bone lengths while constraining overall zygomatic arch length. This type of mechanism may have led to variation in the contribution of individual bones to the zygomatic arch noted across mammals. Given that similar genetic and developmental mechanisms may underlie negative correlations in other parts of the skull, these results provide an important step toward understanding the developmental basis of evolutionary variation and constraint in skull morphology.
Keywords: Craniofacial, Skull, Micro-computed tomography, Morphometrics, Integration, QTL analysis, Diversity Outbred, RT-PCR, Mus musculus
© The Author(s) 2018. This article is distributed under the terms of the Creative Commons Attribution 4.0 International License (http://creativecommons.org/licenses/by/4.0/), which permits unrestricted use, distribution, and reproduction in any medium, provided you give appropriate credit to the original author(s) and the source, provide a link to the Creative Commons license, and indicate if changes were made. The Creative Commons Public Domain Dedication waiver (http://creativecommons.org/ publicdomain/zero/1.0/) applies to the data made available in this article, unless otherwise stated.
Open Access
*Correspondence: [email protected]; [email protected]
1 Department of Anthropology, Stony Brook University, Stony Brook, NY,
USA
4 Department of Cell Biology and Anatomy, University of Calgary,
Calgary, AB, Canada
Background
The skull is a complex structure that supports and pro-tects tissues critical for survival, including the brain, sense organs, and masticatory apparatus. While a wide range of skull morphology has evolved across mam-malian species, fundamental patterns of skull bone integration are generally conserved [1–4]. This shared morphological pattern reflects conserved tissue origins [5], ossification patterns [6–8], and strong selective pres-sure for an adequately integrated and functional head [2, 9]. The same factors that reinforce the development of an integrated head can serve as developmental con-straints on the directions that evolution can take [10, 11]. Understanding the genetic basis for this integration and developmental constraint is critical for illuminating how genes and development can influence processes of evo-lution. Here, we investigate the genetic basis for nega-tive correlations between adjacent skull bones in a large genetically heterogeneous population of mice. These negative correlations may serve as developmental con-straints that support overall integration of the head while also allowing for significant variation in the relative size of individual bones within subregions. Identifying genetic factors underlying this type of developmental constraint is important for understanding the basis of morphologi-cal integration and will illuminate critimorphologi-cal connections between developmental and evolutionary processes.
Random pairs of linear distances across the skull are expected to display positive correlations driven by the overall growth of the integrated head. Negative correla-tions between raw linear distance measurements are rare and can be evidence of scale-independent negative plei-otropy, which exists when genetic variation leads to an opposite phenotypic effect on two traits [10, 12]. Within the craniofacial skeleton, a pair of negatively correlated and adjacent bone lengths provides a relatively simple system within which to search for genes underlying nega-tive pleiotropy. Although not as commonly discussed, negative pleiotropy is fundamentally different than antag-onistic pleiotropy, which occurs when a genetic factor contributes a positive fitness effect for at least one trait and a negative fitness effect for at least one other trait [13–15]. The concept of negative pleiotropy does not require either trait to be associated with a fitness effect. However, the existence of negative pleiotropy itself might have either positive or negative fitness effects, depending on the evolutionary context.
A previous analysis of adult skull variation indicated that linear dimensions of the cranial vault, zygomatic arch, and cranial base vary strongly among the eight inbred mouse founder strains of the Collaborative Cross (CC). Furthermore, that analysis indicated that pairs of bones within each of these regions display negative
correlations in relative size [16]. Here, we explicitly tested whether pairs of adjacent linear distances within cranial vault, zygomatic arch, and cranial base are negatively cor-related. In cases where they were, we performed genome-wide mapping in a large heterogeneous population of Diversity Outbred (DO) mice to identify genomic regions driving negative pleiotropy. The DO mice are derived from the CC founder strains. Each mouse carries a high degree of heterozygosity and a unique combination of alleles [17, 18], which is ideal for high-resolution genetic mapping. Although genome-wide mapping has been per-formed on DO mice for other phenotypes such as blood measurements and body composition [17–19], this is the first study that addresses craniofacial morphology.
Previous quantitative trait locus (QTL) analyses of mouse craniofacial variation have illustrated the ubiquity of pleiotropy in the genetics of craniofacial form [20–22] and identified candidate genes associated with variation in multivariate measures of craniofacial shape in a vari-ety of mouse populations [23–27], including another out-bred mouse sample [28]. The DO mice may prove more valuable than previously analyzed mouse crosses or back-crosses, because they represent a strongly genetically het-erogeneous population that has been outbred for more than 10 generations, leading to relatively high genomic mapping resolution. In addition, haplotype variation at a given SNP can be tied back to the complete genomic sequence of eight diverse inbred founder strains.
Within our mapping results, we expect that a locus driving negative pleiotropy will have a significant haplo-type effect on the linear distances of each adjacent bone. Furthermore, we expect that variation in founder strain haplotypes at this locus will be associated with oppo-site phenotypic effects for each bone (i.e., one bone gets longer when the other gets shorter). Third, if this locus represents a developmental constraint on the morphol-ogy of the combined length of both bones, we expect that local haplotype variation will have no effect on overall regional length. Identifying a genomic region associated with negative pleiotropy and candidate genes within it is a critical first step in understanding an important genetic and developmental basis for both developmental con-straint and variation in the relative contribution of bones to regional skull morphology. Although our analyses are regionally specific, identifying the general mechanisms underlying negative pleiotropy of adjacent skeletal ele-ments is an important step toward understanding the developmental basis for evolutionary change in the skull.
Methods
Adult and embryonic sample
craniofacial landmarks collected from 1211 specimens for a previous analysis [16]. The Diversity Outbred (DO) mice are the result of multiple generations of random outcrossing of 175 breeding pairs from partially inbred CC lines [18] at the Jackson Laboratory (JAX; Bar Har-bor, ME). Our primary sample consisted of mice raised at the University of North Carolina (UNC), and at JAX. The 287 adult specimens raised at UNC were male and female sibling pairs from outbreeding generation 10 that were raised in previously described conditions [19, 29] under approval and conduced in accordance with the guidelines set forth by the Institutional Animal Care and Use Com-mittee (IACUC) at the University of North Carolina at Chapel Hill. The 277 adult specimens raised at Jackson Labs (JAX IACUC #99066) were females of outbreeding generations 9, 10, and 15.
A sample of 472 DO mice of generations 19, 21, and 23, raised at the Scripps Research Institute (IACUC #08-0150-3), were used to validate relevant QTLs identified by genome-wide association in our primary sample. This validation sample was chosen because it includes mice from later DO generations with greater recombination, which might allow for the refinement of any validated QTL (i.e., shorter confidence intervals). After collec-tion, adult specimens were stored at −20 °C. Receipt and imaging of specimens from other institutions was con-ducted in accordance with approved IACUC protocol #AC13-0268 at the University of Calgary.
Embryonic specimens from A/WySnJ (AWS), C57BL/6J (C57), and WSB/EiJ (WSB) inbred backgrounds were col-lected at the University of Calgary at embryonic day (E) 11.5 and processed as recently described [30]. Briefly, embryos were fixed overnight in PaxGene tissue fix solu-tion (Qiagen, PreAnalytics, cat #765312) then stored at −20 °C in the PaxGene tissue stabilizer solution prepared to manufacturer specification (Qiagen, PreAnalytics, cat #765512). Embryonic collection and processing were conducted in accordance with approved IACUC protocol AC13-0267 at the University of Calgary.
Linear distances versus relative linear dimensions
Negative relationships between the length of bones mak-ing up the zygomatic arch, sagittal cranial vault, and posterior cranial base were previously identified among the eight CC founder strains from plots of relative linear dimensions that differ strongly between a given founder strain and several of the other founder strains [16]. Unlike standard linear distances, these relative dimensions were calculated from landmark coordinates after they were scaled to remove overall size variation and then trans-formed to remove the linear component of static allome-try. These steps were necessary in the previous analysis of craniofacial shape between genotypes with a wide range
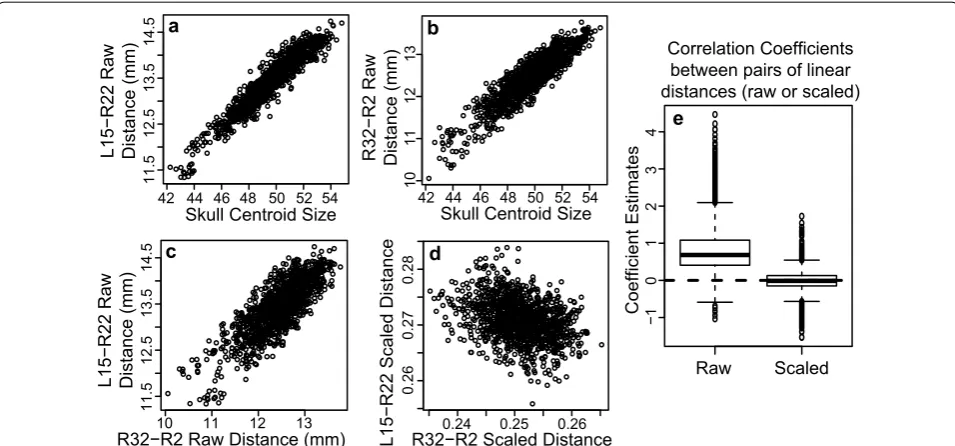
of sizes, including small wild-derived strains and the very large New-Zealand Obese strain. However, because most raw linear distances are positively correlated with head size, removing variation that covaries with overall size can create artefactual negative associations between many of the resulting linear dimensions. For instance, two randomly selected linear distances are both strongly positively correlated with head size (centroid size) (Fig. 1a, b). They are also strongly positively correlated with each other (Fig. 1c). After scaling landmark coor-dinates underlying these measurements by overall skull size during Procrustes superimposition, variation that is correlated with overall scale is removed, regardless of whether that variation is mechanistically or developmen-tally related to overall size variation. This frequently leads to an artificial negative correlation between the resulting linear dimensions (Fig. 1d). Correlation coefficients from many linear distance pairs illustrates how scaling during Procrustes superimposition changes an asymmetric dis-tribution of correlation coefficients between raw linear distances into a symmetric distribution of correlation coefficients centered on zero (Fig. 1e). Because this scal-ing procedure magnifies aspects of negative covariation, we completed our current analysis of potential develop-mental constraints on adjacent bones using raw linear distances to make certain that our evidence for negative relationships between these skull lengths are genuine.
Phenotype measurement
Micro-computed tomography (µCT) images of heads were obtained in the 3D Morphometrics Centre at the University of Calgary with a Scanco vivaCT40 scanner (Scanco Medical, Brüttisellen, Switzerland) at 0.035 mm voxel dimensions at 55 kV and 145 µA. Three dimen-sional coordinates of 54 adult landmarks (8 midline, 46 bilateral), as previously defined [16], were collected by a single observer from minimum threshold defined bone surfaces within Analyze 3D (www.mayo.edu/bir/).
M37–M38, respectively. We completed our analysis of the zygomatic arch lengths on the average of the left and right sides to help control for any stochastic landmark-ing error or stochastic developmental variation between the left and right sides. We were unable to do this for the other measurements, because they are found along the midline of the skull.
The Pearson’s correlation coefficient (r) for each pair of component linear distances (e.g., zygomatic bone length vs. zygomatic process of maxilla length) and between each component linear distance and the overall trait length (e.g., zygomatic bone length vs. total zygo-matic arch length) was calculated to identify correlation direction and strength. A t test of whether the r is dif-ferent from 0 was completed for each pair to determine whether their correlation is significant, after Bonferroni correction to account for multiple testing (α = 0.0028). The coefficient of determination (R2) is interpreted as a measure of how much variance in one length in a pair is explained by the other.
Genotyping and association mapping
Tail biopsies were taken from mice at 6 weeks of age, and DNA was either extracted from the tissue using the QIA-GEN DNeasy kit per manufacturer’s instructions or sent to NeoGen GeneSeek for DNA extraction. The primary
DO sample was genotyped using the MegaMUGA SNP array [GeenSeek (Neogen), Lincoln, NE] [31], while the validation sample was genotyped using the GigaMUGA array (GeenSeek (Neogen), Lincoln, NE) [32]. We used a subset of 57,977 MegaMUGA SNPs or 120,789 Giga-MUGA SNPs that distinguish among the genotypes of the eight CC founder strains and their heterozygous F1 offspring and have a quality tier of 1 or 2 [32]. The proba-bility that each of the eight founder strains contributed to a given SNP maker was calculated for each DO specimen based on array intensity values using the DOQTL pack-age [17] within R [33].
Association mapping was performed using DOQTL [17] for both components and the overall trait length of linear distance pairs that displayed a significant nega-tive relationship within our primary DO mouse sample. First, we completed genome scans for the primary sam-ple using an additive haplotype model for regression of the specimen founder genotype dosage on an individual linear distance, with age at sacrifice and sex as covariates. Peaks indicating regions of the genome where haplotype covaries with a given trait were identified as those with LOD scores above a genome-wide significance threshold determined with permutation tests (1000 iterations, indi-cating a LOD score ~ 7.76). The support intervals under these significant peaks were identified as continuous
Raw Scaled
−1
Correlation Coefficients between pairs of linear distances (raw or scaled)
Coefficient Estimates
01
23
4 e
42 44 46 48 50 52 54
11.5
12.5
13.5
14.5
Skull Centroid Size L15−R22 Raw Distance (mm)
a
42 44 46 48 50 52 54
10
11
12
13
Skull Centroid Size
R32−R2 Ra
w
Distance (mm)
b
10 11 12 13
11.5
12.5
13.5
14.
5
R32−R2 Raw Distance (mm) c
L15−R22 Ra
w
Distance (mm)
0.24 0.25 0.26
0.26
0.27
0.28
R32−R2 Scaled Distance d
L15−R22 Scaled Distance
regions including 2 LOD scores below the LOD score value of that significant peak. The results of these additive haplotype regressions also indicate which founder haplo-types are associated with positive or negative increases in linear distance length. We completed association map-ping using an additive SNP-based regression model [17] across the genomic intervals of interest that were identi-fied in the previous step. A permutation test of the SNP-based regression model across the genome was used to determine the LOD score significance threshold for these tests. Second, to validate significant peaks on chromo-some 17, we completed the same association mapping steps with our validation sample for zygomatic arch dis-tances across chromosome 17 (rather than across the whole genome).
RT‑PCR
The E11.5 maxillary process was chosen for RT-PCR because both the maxilla and zygomatic bones are derived from mesenchymal condensations within this process (see “Discussion”), starting at approximately E11.5. Specifically, this age was chosen because it is the approximate time when morphogenesis and differentia-tion of the facial skeleton begins [34, 35]. Mouse embryos were dissected in ice cold PBS and immediately preserved using the PaxGene tissue system (Qiagen, PreAnalyt-ics cat #765312, 765512). Embryos were fixed overnight in the fix at room temperature with rocking, then trans-ferred to the stabilization buffer and stored at −20 °C. Maxillary processes were subsequently micro-dissected from five A/WySnJ (AWS), five C57BL/6J (C57), and six WSB/EiJ (WSB) embryos that had been stored in Pax-Gene tissue stabilization buffer and were stored in fresh stabilization buffer at −20 °C until extraction. AWS embryos were used in place of A/J embryos, because they were available at the University of Calgary and because the two are closely related inbred strains.
Following a recently published analysis [30], RNA was extracted using the PaxGene RNA extraction kit (Qia-gen, PreAnalytics cat #766134), which includes a DNA removal step. RNA was analyzed using a NanoDrop 1000 (ThermoFisher). While RIN analysis was not per-formed on these samples, a similar group of samples processed during the same time span (Agilent BioAna-lyzer) had RIN scores in the area of 7.9–8.3, which is in line with kit specifications. 500 ng of RNA was con-verted to cDNA using the Maxima First Strand Kit (Ther-moFisher, Cat #K1641) in a 25 µl reaction. Real-time PCR was performed on an Applied Biosystems Quanti-flex Studio 6 using standard cycling conditions with the low volume (10 µl) setting. Reactions were performed using the 2× PrimeTime gene expression mastermix from Integrated DNA Technologies with low ROX, PrimeTime assays (Gapdh—Mm.PT.39a.1, Camkmt— Mm.PT.58.7890215, Six3os1—Mm.PT.58.43925739,
Six2—Mm.PT.58.22007192), an ABI Taqman assay (18s—Mm0477571_s1), and custom Six3 primers (Probe: 5′-CAAACTTCGCCGATTCTCACCACTGCT-3′, Forward primer: 5′-TCTCTATTCCTCCCACTTCTT GTTG-3′, Reverse primer: 5′-GCCGCTACTCGCCA GAAGTA-3′) [36]. Additional primer sequence details are found in Additional file 1. Normalization was done using the arithmetic average of the deltaCT from Gapdh
and 18 s RNA runs. Reference genes were selected based on stability from previous experiments and RNAseq data from this region of the face.
Since C57 mice had an intermediate phenotypic effect, mean C57 RNA expression was used as the baseline upon which to compare the expression of all specimens R12 R13 R19 R23 R22 R24 R25 R28 R29 R3 R5 R8 R33 R32 R35 L13 R13 R22 L22 R23 L23 R24 L24 R25 L25 M21 M26 M27 R33 L33 R13 L13 R23 L23 R24 L24 R33 L33
M36 M37 M38 M39 M40
b c R1 R12 R13 R19 R23 R22 R24 R25 R28 R29 R3 R5 R8 R33 R32 R35 L13 R13 R22 L22 R23 L23 R24 L24 R25 L25 M21 M26 M27 R33 L33 R13 L13 R23 L23 R24 L24 R33 L33
M36 M37 M38 M39 M40
a
b
c
(measured as fold change). One-way ANOVA tests of fold-change values between genotypes were completed for Camkmt, Six2, Six3, and Six3OS1 using Graphpad Prisim (Version 6) software. If there were differences in expression between genotypes, we looked for similarities between variation in RNA expression and the phenotypic effects of A-strain, C57, and WSB haplotypes on relative zygomatic bone length, which might indicate that varia-tion in expression of these candidate genes is associated with the identified negative correlation in zygomatic bone lengths. This was done by using a post-test for lin-ear trend.
Results
We explicitly tested whether the lengths of adjacent bones within the cranial base, cranial vault, and zygo-matic arch were negatively correlated. While we expected that most linear distances in the skull would be posi-tively correlated, a negative correlation is evidence for a developmental constraint in how component bones (e.g., frontal and parietal bones) contribute to a larger over-all trait (e.g., cranial vault length). All component bone lengths were significantly positively correlated with cor-responding overall trait lengths (Table 1). The lengths of component bones of the zygomatic arch were negatively correlated within the CC Founder/F1 and DO samples, while cranial vault components were negatively corre-lated within the DO sample. There was no evidence of a negative association between components of the poste-rior cranial base.
Association mapping
Given the negative correlations between the length of bones contributing to the zygomatic arch and cra-nial vault, we completed genome-wide association
mapping to look for evidence of a genomic region that might drive these correlations based on the mecha-nism of negative pleiotropy. Our association mapping analysis revealed two intervals on chromosome 17 that were associated with zygomatic bone length variation (42.04829–45.95447; 85.30648–85.88324 Mb), while the second of these intervals (85.30648–85.88324 Mb) was also associated with zygomatic process of the maxilla length variation (Fig. 3b, c). The phenotypic effects of founder haplotypes under the second peak were in oppo-site directions for the two components (Fig. 4), meaning that a founder haplotype associated with an increase in zygomatic length was also associated with a decrease in zygomatic process of the maxilla length. This closely matches our expectation for a gene underlying negative pleiotropy between two components of a larger trait. Fur-thermore, this interval displays a significant LOD score for both components but not for total zygomatic arch length (Fig. 3a), which meets our expectation that a gene underlying a developmental constraint on zygomatic arch morphology will have opposite effects on the rela-tive contribution of the components to zygomatic arch length without effecting overall arch length. Chromo-some specific association mapping with our validation sample confirmed the second zygomatic peak on chro-mosome 17 (84.37429–85.86122 for zygomatic bone; 83.71674–85.88897 for zygomatic process of maxilla), the general phenotypic effects of haplotypes under this peak (Additional file 2), and suggested a few other sig-nificant peaks on chromosome 17 related to zygomatic arch length (Fig. 5). In addition, a single significant peak on the X chromosome was noted for total cranial vault length (98.220635–100.409455) in our primary sample, but it did not reach significance in our validation sample. This vault length peak was not further pursued in this
Table 1 Linear distance correlations
Bolditalic indicates a significant negative correlation after accounting for multiple testing with Bonferonni correction (α= 0.0028) Linear distance 1 Linear distance 2 CC founder/F1 DO
Pearson’s correlation coefficient (r)
R2 r ≠ 0 t test
p value Pearson’s correlation coefficient (r)
R2 r≠ 0 t test p value
Zygomatic Process of Maxilla (L3–L24) Zygomatic Bone (L24–L32) − 0.232 0.054 < 0.001 − 0.294 0.086 < 0.001 Zygomatic Process of Maxilla (L3–L24) Full Zygomatic Arch (L3–L32) 0.465 0.216 < 0.001 0.620 0.385 < 0.001
Zygomatic Bone (L24–L32) Full Zygomatic Arch (L3–L32) 0.748 0.560 < 0.001 0.561 0.315 < 0.001
Frontal Bone (M21–M26) Parietal Bone (M26–M27) − 0.034 0.001 0.232 − 0.345 0.119 < 0.001
Frontal Bone (M21–M26) Vault Length (M21–M27) 0.776 0.602 < 0.001 0.622 0.386 < 0.001
Parietal Bone (M26–M27) Vault Length (M21–M27) 0.603 0.363 < 0.001 0.519 0.270 < 0.001
Basioccipital (M36–M37) Sphenoid Body (M37–M38) 0.592 0.350 < 0.001 0.333 0.111 < 0.001
study because it did not reach significance for either cra-nial vault component.
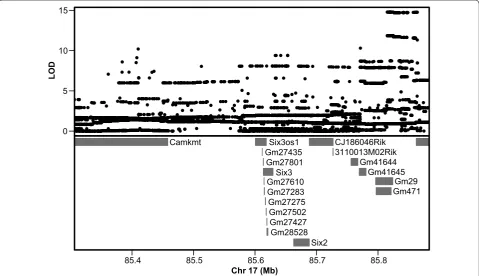
Association mapping across the support interval of the second peak associated with zygomatic arch vari-ation on chromosome 17 (85.30648–85.88324 Mb) indicates there are 19 known or predicted genes in this region (Fig. 6). These include three protein-coding genes (Six2, Six3, Camkmt) and one well-studied non-coding RNA (Six3os1). We noted that the WSB and A/J founder
haplotypes are associated with opposite phenotypic effects for zygomatic bone and zygomatic process of the maxilla lengths, while the C57 haplotype effect is inter-mediate (Fig. 4). Therefore, if differences in the expres-sion level of a protein-coding gene were responsible for founder haplotype associated variation in zygomatic bone length, we expected that A-strain and WSB expres-sion levels would be most different, while C57 expresexpres-sion would be intermediate.
0 2 4 6 8
a Full Zygomatic Arch
LOD Scor
e
1 2 3 4 5 6 7 8 9 10 11 12 13 14 15 16 17 1819 X
0 2 4 6 8 10
c Zygomatic Bone
LOD Scor
e
1 2 3 4 5 6 7 8 9 10 11 12 13 14 15 16 17 1819 X 0
5 10 15
b Zygomatic Process of Maxilla
LOD Scor
e
1 2 3 4 5 6 7 8 9 10 11 12 13 14 15 16 17 1819 X
RT‑PCR
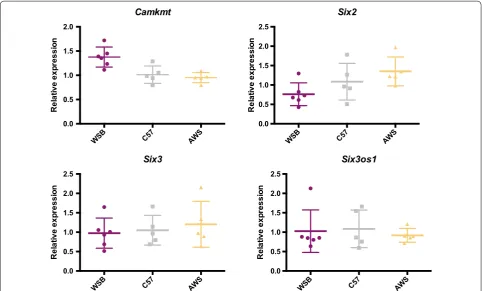
To test whether the expression of these four candidate genes met this expectation, we collected maxillary prominences from embryonic day (E) 11.5 embryos of AWS, C57, and WSB mice, which had been stage matched by tail somite number. We then completed RT-PCR on these tissue samples using three replicates for each sample to quantify RNA expression levels for Camkmt, Six2, Six3, and Six3os1. All fold-change values were compared to the C57 mean as a baseline. One-way ANOVA results indicate genotype identity significantly contributes to Camkmt and Six2 RNA expression (Table 2). In both cases, a post-test for lin-ear trends is significant when genotypes are ordered as WSB, C57, then AWS. WSB displays relatively high mean Camkmt RNA expression levels and relatively low Six2 levels. AWS displays relatively high mean
Six2 levels and intermediate mean Camkmt levels
(Fig. 7). No significant trends are noted for either Six3
or Six3OS1.
Discussion
Within a sample of DO mice, we confirmed negative cor-relations between the lengths of bones contributing to the cranial vault and found strong evidence for negative pleiotropy between the length of the zygomatic bone and the zygomatic process of the maxilla. A genomic interval on chromosome 17 (85.3–85.9 Mb) met all our expecta-tions for a genetic basis of negative correlation between these adjacent zygomatic arch bones. Specifically, there were significant and opposite haplotype effects on zygo-matic and zygozygo-matic process length (Figs. 3a, b, and 4), but no significant haplotype association with overall zygomatic arch length (Fig. 3c). This example of negative pleiotropy shows how skull shape can be conserved while the individual bone contributions to that shape can vary.
Founder Effects (mm)
A/J C57BL/6J 129S1/SvImJ NOD/ShiLtJ NZO/HlLtJ CAST/EiJ PWK/PhJ WSB/EiJ
−0.2 0.0 0.2 0.4 0.6
0 5 10 15
LO
D
a Zygomatic Process of the Maxilla
Founder Effects (mm)
−0.4 −0.2 0.0 0.2 0.4
20 40 60 80
0 2 4 6 8 10
LO
D
Chr 17 (Mb) b Zygomatic Bone
The development of an integrated skull that fits together well enough for masticatory, sense organ, breathing, and brain function is necessary for survival [1, 11, 12, 37]. Just as with any skull region, the range of possible zygomatic arch phenotypes that allow for proper skull integration and function is limited. Our results illustrated a mecha-nism of developmental constraint that supports skull integration while allowing for variation in how specific bones contribute to a fundamentally conserved mamma-lian skull morphology.
Phenotypic impact of candidate region variation
There is a significant association between haplotype vari-ation under a genomic region on mouse chromosome 17 and variation in the lengths of the zygomatic process of
the maxilla and the zygomatic bone. While we are con-fident that there is a causal factor in this region, zygo-matic arch element lengths are likely highly polygenic as is the norm for skull morphology [22, 38]. As with most skull bone lengths, the length of the zygomatic bone and the zygomatic process of the maxilla also correlate posi-tively with skull size. In fact, the amount of variation explained by the correlation with skull size (as measured by R2) is greater than the amount of variation explained by the negative correlation between the two zygomatic components (Table 1). Additionally, the greatest differ-ence between haplotype specific phenotypic effects in our genomic interval is about 0.4 mm (Fig. 4), which is approximately one standard deviation for these bone length measurements across our DO mice. Although the identified negative pleiotropy plays an important role in limiting overall zygomatic arch morphology, system-wide growth factors play a stronger role in determining all zygomatic arch bone lengths.
In addition to the interval displaying negative pleiot-ropy, another peak on chromosome 17 between 42 and 46 Mb met the genome-wide significance level for asso-ciation with zygomatic bone length. With larger samples and different measurements of zygomatic arch morphol-ogy, other regions of interest would also be identified (as in [39]). Furthermore, although a mouse with the WSB haplotype under our interval of interest had, on average, a 0.3 mm shorter zygomatic bone than other DO mice (Fig. 4), WSB inbred founder mice don’t all have a shorter zygomatic bone than other inbred founder strains. This is because WSB alleles in other regions of the genome also contribute to the total WSB founder strain pheno-type. Variation in even small-scale skull morphologies is produced by the combination of numerous factors, some acting globally across an organism and some acting more locally [11, 22]. However, determining the genetic factor on mouse chromosome 17 that drives negative pleiotropy within the zygomatic arch may help to reveal an impor-tant basis of developmental constraint and evolutionary change within the skull.
Candidate genes
Three protein-coding genes (Camkmt, Six3, and Six2) and one non-coding RNA with known function (Six3os1) are found under our candidate region of inter-est (Fig. 6). Our real-time PCR results indirectly sup-port Camkmt and Six2 as candidate genes. Although we cannot definitively rule out other genetic factors under and near this genomic interval as candidates, we speculate that changes in the expression of at least one of these four identified factors might be responsible for the noted negative pleiotropy in zygomatic arch element length.
0 1 2 3 4 5 6
a Full Zygomatic Arch
LOD Scor
e
Chromosome 17
0 5 10 15
b Zygomatic Process of Maxilla
LOD Scor
e
Chromosome 17
0 5 10 15
c Zygomatic Bone
LOD Scor
e
Chromosome 17
CAMKMT (calmodulin-lysine N-methyltransferase) is expressed across a wide range of tissues and plays a piv-otal role in the methylation of calmodulin, which changes across developmental stages and varies in a tissue spe-cific manner [40]. Deletion of a genomic region including
CAMKMT in humans has been associated with micro-gnathia, dolichocephaly, and cleft palate, although the specific loss of CAMKMT has been associated with intel-lectual disability and muscle fiber abnormalities instead of these craniofacial phenotypes [41]. Since CAMKMT regulates calmodulin (CaM) function, it is also important
to note that calmodulin has been linked to variation in beak length in Darwin’s finches and chicks [42]. CAM-KMT is critical to basic physiological function across the body and has tentatively been associated with severe craniofacial birth defects.
SIX2 (sine oculus-related homeobox 2) is known to play a significant role in the skeletal development of pharyngeal arch derivatives. SIX2 is upregulated in neu-ral crest-derived cranial mesenchyme in mice at E8.5 [43] and E9.5 [44], becoming localized to mesenchymal cells of nasal prominences, midline, and developing skull vault, as well as olfactory epithelium by E11.5 [43, 45, 46]. Downregulation of SIX2 can lead to loss or reduction in facial skeletal elements [47], reduced cranial base length, and cleft palate [48]. Later in development, SIX2 loss has been linked to increased rates of cartilage replacement by bone during endochondral ossification of the presphe-noid, leading to an abnormal cranial base morphology [49]. SIX2 regulates the formation of bones from the first pharyngeal arch, which includes both the maxilla and zygomatic bones.
SIX3 (sine oculus-related homeobox 3) interacts with BMP, WNT, and NODAL, is critical during eye develop-ment [50–52], and during anterior neural plate specifica-tion [53]. Although SIX3 is not expressed in the maxillary arch or other craniofacial mesenchyme during embryonic
0 5 10 15
LO
D
85.4 85.5 85.6 85.7 85.8
Chr 17 (Mb)
Camkmt Six3os1 CJ186046Rik Gm27435 3110013M02Rik Gm27801 Gm41644 Six3 Gm41645
Gm27610 Gm29
Gm27283 Gm471 Gm27275
Gm27502 Gm27427 Gm28528
Six2
Fig. 6 Association mapping results. Results of association mapping under the significant peak that is found in the genome-wide scan results for both zygomatic bone length and zygomatic process of maxilla length
Table 2 ANOVA post-test for a linear trend in RNA expres-sion, where the alternate hypothesis is that the level of expression is ordered by genotype with C57 being inter-mediate to the other two genotypes (AWS and WSB)
Slope of the associated linear model, R2 indicating how much variation that model explains, and a p-value of the probability that the slope of the linear model equals zero are reported
*Significance at 0.05 level; **Significance at 0.01 level
Gene Slope R2 p value
Camkmt − 0.2118 0.5009 0.0014**
Six2 0.2949 0.3342 0.0237*
Six3 0.1141 0.04933 0.426
development [44], genetic variation in Six3 can lead to craniofacial dysmorphology of maxillofacial bones [54], particularly in the facial midline. Mutations in SIX3 can cause holoprosencephaly in humans, a condition associ-ated with forebrain malformation, intellectual disability, ophthalmological abnormalities, and craniofacial features including cyclopia, nasal dysmorphology, and cleft lip/ palate [55]. A combination of forebrain loss and modi-fied ectoderm/mesenchyme interactions may underlie the associated craniofacial dysmorphology (e.g., [56]). SIX3OS1 (Six3 opposite strand) is an antisense non-cod-ing RNA that is independently coexpressed with SIX3 in the forebrain and eye after E8.5 in mice [57]. SIX3OS1 likely acts as a transcriptional scaffold for SIX3 and mod-ulates the ability of Six3 to regulate expression of target genes in retinal cells [58]. SIX3 and SIX3OS1 may indi-rectly regulate facial bone development.
Although all four candidate genes have been previously associated with craniofacial dysmorphology, Six2 is par-ticularly tantalizing because it is a major player in facial bone ossification and is associated with RNA expression level differences between founder strain maxillary promi-nences. Assuming that variation in Six2 or one of its cis-regulatory factors is responsible, we speculate about how variation in SIX2 expression might modify development
to produce zygomatic arch variation in our DO mice and across mammalian clades.
Developmental mechanisms
All bones that contribute to the mouse zygomatic arch form from neural crest-derived mesenchyme [59, 60] within the first pharyngeal arch [61–63]. The maxilla and zygomatic bone derive from neural crest cells that migrate from the posterior mesencephalic region, while much of the squamous temporal neural crest mesen-chyme probably originates in the first couple of rhom-bomeres [5, 64]. Our results indicate that a gene or regulatory element within our candidate interval deter-mines the location of the border between the maxilla and zygomatic within the adult zygomatic arch. Because the zygomatic bone is the last remaining dermally ossified circumorbital bone in mammals [6, 65] and appears to be the only dermatocranial element that does not develop in proximity to chondrocranial elements [66], it may ossify in response to a different signal than the maxilla. Although Dlx genes and related factors are associated with determining upper and lower jaw fates within the first pharyngeal arch [67], what determines the individual bone fate of mesenchymal cells within the maxillary por-tion of the first pharyngeal arch remains unknown.
WSB C57 AWS
0.0 0.5 1.0 1.5 2.0
Camkmt
Re
la
tive
exp
ress
ion
WSB C57 AWS
0.0 0.5 1.0 1.5 2.0 2.5
Six3os1
Re
la
tive
ex
pr
essi
on
WSB C57 AWS
0.0 0.5 1.0 1.5 2.0 2.5
Six2
Re
la
tive
exp
ress
ion
WSB C57 AWS
0.0 0.5 1.0 1.5 2.0 2.5
Six3
Re
la
tive
ex
pr
essi
on
Heuzé and colleagues [68] recently suggested that the zygomatic progenitor cells experience developmental cues analogous to Dlx expression patterns that distin-guish them from maxillary cell populations. It is possi-ble that one of these cues is the spatiotemporal pattern of Six2 expression. Supporting this perspective, loss of SIX1 results in a partial transformation of the zygomatic process of the maxilla into a mandible, possibly through downstream effects on Dlx gene expression [69]. This partial morphological transformation includes a signifi-cant increase in the length and volume of the zygomatic process of the maxilla and a significant reduction of the zygomatic bone or the fusion of zygomatic and maxil-lary portions of the zygomatic arch together [69]. As two members of the same gene family that are expressed within the developing pharyngeal arches, it is possible that SIX1 and SIX2 regulate development through simi-lar pathways and mechanisms.
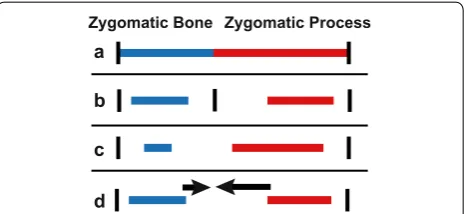
If a mutation in SIX2 leads to a change in how regional segmentation genes like the Dlx genes are expressed, it is possible that the variation in the contribution of max-illa and zygomatic to the zygomatic arch (Fig. 8a) may be based on a change in the location of a regulatory gene expression border between their presumptive cell popu-lations (Fig. 8b). Tissue boundary definition is critical in many developmental contexts [70]. One well-docu-mented craniofacial example of a gene regulatory border prevents mesenchymal and osteogenic cells from cross-ing the presumptive coronal suture between neural crest and mesodermally derived mesenchymal cells [70–72] (although, see [73]). A change in the relative location of a gene regulatory boundary may serve to define the final location of the zygomaticomaxillary suture.
There are other ways that a mutation in SIX2 might modify developmental processes to lead the measured zygomatic arch length variation. The site of the zygomati-comaxillary suture may not be defined prior to osteogen-esis but may simply occur wherever the growing bones meet. Six2 expression has been associated with increased mesenchymal cell proliferation in the developing head and renal system [48, 49, 74]. Recent results indicate that
Six2 mRNA and protein levels are highest in palatal tis-sues during the period of initial palatal shelf outgrowth and suggest that later spatiotemporal expression pat-terns are responsible for local increases in mesenchymal cell proliferation [48]. It is possible that genetic varia-tion under our candidate region leads to a change in the timing, location, or level of mesenchymal precursor cell populations.
A change in proliferation within either the maxillary or zygomatic mesenchymal condensations may result in size variation of that condensation and the resulting bones (Fig. 8c). Within chicken eyes, it has been shown that
the largest and most widely spaced intramembranously ossified scleral ossicles tend to be those with the earliest forming mesenchymal condensation precursors. In addi-tion, if one ossicle fails to form, the adjacent ossicles fill in the extra space [75]. In another relevant example, a
Fuz ciliopathy mutation leads to the formation of a single frontal bone pair at the expense of parietal bones in mice, perhaps because an excess proliferation of precursor cells leads to an unusually wide frontal bone mesenchymal condensation [76]. It is possible that a similar change in the proliferation rate within the maxillary or zygomatic bone mesenchymal condensations may cause them to become larger at the expense of the other. While Six2 is a tantalizing candidate gene that may drive the negative pleiotropy in zygomatic arch bone lengths among DO mice, further work is required to confirm this.
Evolutionary implications
The jugal bone (homologous with zygomatic bone) is first noted in the fossil record as one of the circumorbital bones within the dermal skeleton of agnathans. Within the presumed ancestral tetrapod, the jugal was a narrow bone of the inferior orbital margin that articulated with facial bones including the lacrimal, maxilla, and squa-mosal (reviewed by [65, 68]). The zygomatic bone of the last common ancestor of mammals was likely a linear bone connecting the maxilla and squamosal bones that lacked a postorbital connection to the frontal bone. This view is supported by the existence of similar morpholo-gies in living monotremes, marsupials and many other mammalian clades. Among mammals, zygomatic arches vary in their width, breadth, height, length, degree and direction of curvature, among other characteristics. A complete postorbital border between frontal and zygo-matic bones is noted in some clades (e.g., cervids, equids,
Zygomatic Bone Zygomatic Process a
b
c
d
primates), is sometimes represented by zygomatic and frontal processes that do not touch (e.g., carnivorans, lagomorphs), and completely absent in other mammals (e.g., bats, insectivores, rodents) [77–79]. Arch thickness and robusticity may vary in response to selective pres-sure based on mechanical loading requirements [80–83], with robust arches found in beaver and rabbits, thinner arches in mice and moles, and a practically complete loss in shrews.
Although a wide range of morphologies occur across mammals, our results specifically relate to variation in the relative contribution of bones to zygomatic arch length between the main bodies of the maxilla and squamosal bones. The zygomatic process of the maxilla, the zygo-matic bone, and the zygozygo-matic process of the squamous temporal typically contribute to form the zygomatic arch. Because only a short squamous temporal portion exists in laboratory mice, our analysis focused on the zygomatic and maxillary bone contributions to overall arch length. Mouse strain haplotype variation noted under a genomic interval on mouse chromosome 17 (85.3–85.9 Mb) is responsible for significant variation in the relative contri-bution of these bones to arch length.
Analogous genetic variation may underlie variation in the relative contribution of zygomatic arch elements to total arch length across mammalian species. This sort of phenotypic variation is common across mammalian taxa. For example, carnivorans including felids and canids typ-ically have a very short zygomatic process of the maxilla, an anteriorly placed zygomatic bone, and a relatively long zygomatic process of the temporal [78, 84] (Fig. 9a). On the other hand, rodents typically have a long zygomatic process of the maxilla, a more posteriorly placed zygo-matic bone, and a short zygozygo-matic process of the tem-poral [78, 85] (Fig. 9b). We propose that the identified pattern of negative pleiotropy contributes to this mam-malian variation in relative bone length, but not that it explains all variation in zygomatic arch length or shape.
Two clades that were commonly thought to lack a zygomatic bone illustrate how an extreme imbalance in two zygomatic arch elements might manifest. First, moles (Talpidae) may represent the logical extreme of the proposed mechanism. Although moles lack a sepa-rate zygomatic bone as adults [78, 86] (Fig. 9c), one of the multiple small zygomatic arch ossification centers [77] may represent the zygomatic bone [87] and fuse with the zygomatic process of the maxilla quite early in develop-ment. The mole zygomatic arch is a complete arch, with a minor zygomatic bone contribution, and a lack of zygo-matic arch sutures. The fossil order of Multiturberculata was long considered unique as mammals with a robust zygomatic arch, but lacking a zygomatic bone. However, careful work by Hopson and colleagues [88] indicated the zygomatic bone is found medial to the maxillary and temporal portions of the arch rather than in between.
If the modified expression of a factor like SIX2 leads to the expansion of one arch bone at the expense of another, a fusion of the arch bones together and/or a displace-ment of the smaller bone may occur. In fact, SIX1 null mutant mice with the enlarged zygomatic process of the maxilla also display either a smaller displaced zygomatic bone or fusion of zygomatic and maxillary portions of the developing arch [69]. It is temping to speculate that this reduction and fusion of the zygomatic bone might serve as a foundation for total zygomatic bone loss. In moles, where the existence of a zygomaticomaxillary suture is not functionally necessary, a complete loss of the zygo-matic bone ossification center would result in the same morphology as long as the growing temporal and maxil-lary bones expanded further to fill in the gap as occurs among chick scleral ossicles [75]. However, in the case of the Multiturberculata, the continued presence of the dis-placed zygomatic bone may serve to reinforce the zygo-matic arch response to mechanical forces [88]. Regardless of the responsible factor, similar changes in developmen-tal processes [89] may underlie the variation in zygomatic
Rattus norvegicus Felis silvestris catus
a b
Talpa europaea c
?
arch bone contributions among our DO mice and varia-tion that has arisen during mammalian evoluvaria-tion.
Conclusions
Investigating how genetic factors constrain the range of possible skull variation is critical for identifying mecha-nisms of integration and developmental constraint. Out of three cranial regions studied, we identified a genomic region underlying negative pleiotropy within the zygo-matic arch. Association mapping and subsequent RT-PCR analysis identified candidate genes that might underlie this pattern. Further study is required to determine how the responsible genetic factor modifies developmental processes to limit overall zygomatic arch length while allowing for variation in the relative length of contributing zygomatic bones. This pattern of negative pleiotropy may have contributed to the evolution of mammalian zygo-matic arch diversity. Identifying the particular develop-mental basis for this negative pleiotropy has implications beyond the zygomatic arch, because changes in similar instances of negative pleiotropy underlie significant evo-lutionary variation in the relative contribution of adjacent bones to larger morphological features in other regions like the cranial vault and upper jaw. These results provide a significant toe-hold in unraveling an example of nega-tive pleiotropy and developmental constraint, which is an important step toward understanding the developmental basis for evolutionary change in the skull.
Authors’ contributions
CJP contributed to study design, collected computed tomography images, completed morphometric and genome-wide mapping analysis, and was the primary author of the manuscript. RG collected embryonic tissue, completed RT-PCR analysis, and contributed substantially to manuscript. CCR contributed to study design, the interpretation of statistical results, and critically revised the manuscript. DMG performed haplotype probability calculations necessary for genome-wide mapping and critically revised the manuscript. JMM, KMP, KH, DP, JLM, SAM, and LRD contributed to study design, mouse management, sample collection, genotyping, and critically revised the manuscript. RM Additional files
Additional file 1. A.csv file with sequence details and identification of primers used during RT-PCR analysis.
Additional file 2. Validation Sample Haplotype Effects CC founder strain specific phenotype coefficients (above) and LOD scores from genome-wide scan (below) for significant association between haplotype and A) zygomatic process of the maxilla length and B) zygomatic bone length across Chromosome 17. Phenotypic coefficients are the effect of having a certain founder strain genotype at a specific genomic location on a measurement.
Additional file 3. A.csv phenotype file with linear distance measures and covariates for the CC Parental/F1 sample discussed in this analysis. Additional file 4. A.csv phenotype file with linear distance measures and covariates for the primary DO sample discussed in this analysis.
Additional file 5. A.csv phenotype file with linear distance measures and covariates for the validation DO sample discussed in this analysis.
and BH contributed to study design and critically revised the manuscript. All authors read and approved the final manuscript.
Author details
1 Department of Anthropology, Stony Brook University, Stony Brook, NY, USA. 2 Alberta Children’s Hospital Institute for Child and Maternal Health, University
of Calgary, Calgary, AB, Canada. 3 The McCaig Bone and Joint Institute,
University of Calgary, Calgary, AB, Canada. 4 Department of Cell Biology
and Anatomy, University of Calgary, Calgary, AB, Canada. 5 Program in Ecology
Evolution and Conservation Biology, University of Illinois, Urbana, IL, USA. 6 The
Jackson Laboratory, Bar Harbor, ME, USA. 7 Department of Molecular Medicine,
The Scripps Research Institute, La Jolla, CA, USA. 8 Department of Genetics,
University of North Carolina Medical School, Chapel Hill, NC, USA. 9 The
Ortho-paedic Trauma Institute, Department of OrthoOrtho-paedic Surgery, UCSF School of Medicine, San Francisco, CA, USA.
Acknowledgements
We thank Wei Liu for completing some of the computed tomography imaging and all craniofacial landmark collection at the University of Calgary. Other phenotypes of some of our mice were collected using the Animal Metabo-lism Phenotyping core facility within UNC’s Nutrition and Obesity Research Center funded by NIH DK056350. We thank Liyang Zhao and Kuo-Chen Jung for assistance with UNC mouse experiments. We thank Robyn Humphreys for assistance with embryo collection at the University of Calgary. Charles Farber is gratefully acknowledged for assistance with processing of mouse carcasses.
Competing interests
DMG, JLM, SAM, and LRD are employed by The Jackson Laboratory, which sells DO mice like those that make up the sample analyzed here. All other authors declare that they have no competing interests.
Availability of data and materials
Linear distance data and relevant covariates for the CC/F1 specimens and all DO specimens are included within this article’s additional files (Additional files 3, 4, 5). Genotype probabilities of our primary sample are available publicly at http://churchill-lab.jax.org/website/data-percival-etal-2017, while genotype probabilities of our validation sample are available from KMP on reasonable request. Bulk genotypes for the primary sample of DO mice can be found at http://churchill.jax.org/research/cc/do_data/megamuga/raw.
Ethics approval and consent to participate
All mouse procedures were approved and guided by the appropriate institutional animal ethics committees, including at Jackson Labs (#99066), University of North Carolina at Chapel Hill, Scripps Institute (IACUC #08-0150-3), and University of Calgary (IACUC #AC13-0267, AC13-0268).
Funding
This work was supported in part by the NIH via NIDCR (U01DE020054, R01DE019638, R01DE021708 to BH and RM), NIGMS (R01GM070683 to Gary Churchill), NIEHS (R21ES024485 to KMP), and NIDDK (DK076050, DK087346 to DP). This work was also supported in part by NSERC (238992-12) and as a postgraduate fellowship from Alberta Innovates Health Solutions to CJP. Fund-ing for JLM, SAM, & LRD provided by March of Dimes 414-01. None of these funding bodies played a role in study design, collection, analysis, interpreta-tion of data, or in writing the manuscript.
Publisher’s Note
Springer Nature remains neutral with regard to jurisdictional claims in pub-lished maps and institutional affiliations.
Received: 28 October 2017 Accepted: 8 January 2018
References
2. Jamniczky HA, Hallgrímsson B. A comparison of covariance structure in wild and laboratory muroid crania. Evolution. 2009;63:1540–56. 3. Goswami A. Morphological integration in the carnivoran skull. Evolution.
2006;60:169–83.
4. Steppan SJ. Phylogenetic analysis of phenotypic covariance structure. I. Contrasting results from matrix correlation and common principal component analyses. Evolution. 1997;51:571–86.
5. Gross JB, Hanken J. Review of fate-mapping studies of osteogenic cranial neural crest in vertebrates. Dev Biol. 2008;317:389–400.
6. Schoch RR. Skull ontogeny: developmental patterns of fishes conserved across major tetrapod clades. Evol Dev. 2006;8:524–36.
7. Sánchez-Villagra MR, Goswami A, Weisbecker V, Mock O, Kuratani S. Con-served relative timing of cranial ossification patterns in early mammalian evolution. Evol Dev. 2008;10:519–30.
8. Koyabu D, Werneburg I, Morimoto N, Zollikofer CP, Forasiepi AM, Endo H, et al. Mammalian skull heterochrony reveals modular evolution and a link between cranial development and brain size. Nat Commun. 2014;5:1–9. 9. Young NM, Hu D, Lainoff AJ, Smith FJ, Diaz R, Tucker AS, et al. Embryonic bauplans and the developmental origins of facial diversity and constraint. Development. 2014;141:1059–63.
10. Cheverud JM. Quantitative genetics and developmental constraints on evolution by selection. J Theor Biol. 1984;110:155–71.
11. Hallgrímsson B, Jamniczky H, Young NM, Rolian C, Parsons TE, Boughner JC, et al. Deciphering the palimpsest: studying the relationship between morphological integration and phenotypic covariation. Evol Biol. 2009;36:355–76.
12. Cheverud JM. Developmental integration and the evolution of pleiot-ropy. Am Zool. 1996;36:44–50.
13. Williams GC. Pleiotropy, natural selection, and the evolution of senes-cence. Evolution. 1957;11:398–411.
14. Williams PD, Day T. Antagonistic pleiotropy, mortality source interactions, and the evolutionary theory of senescence. Evolution. 2003;57:1478–88. 15. Carter AJ, Nguyen AQ. Antagonistic pleiotropy as a widespread
mecha-nism for the maintenance of polymorphic disease alleles. BMC Med Genet. 2011;12:160.
16. Percival CJ, Liberton DK, Pardo-Manuel de Villena F, Spritz R, Marcu-cio R, Hallgrímsson B. Genetics of murine craniofacial morphology: diallel analysis of the eight founders of the Collaborative Cross. J Anat. 2016;228:96–112.
17. Gatti DM, Svenson KL, Shabalin A, Wu L-Y, Valdar W, Simecek P, et al. Quantitative trait locus mapping methods for diversity outbred mice. G3: genes| Genomes|. Genetics. 2014;4:1623–33.
18. Svenson KL, Gatti DM, Valdar W, Welsh CE, Cheng R, Chesler EJ, et al. High-resolution genetic mapping using the mouse diversity outbred population. Genetics. 2012;190:437–47.
19. Smallwood TL, Gatti DM, Quizon P, Weinstock GM, Jung K-C, Zhao L, et al. High-resolution genetic mapping in the diversity outbred mouse population identifies Apobec1 as a candidate gene for atherosclerosis. G3: genes| Genomes|. Genetics. 2014;4:2353–63.
20. Kenney-Hunt JP, Wang B, Norgard EA, Fawcett G, Falk D, Pletscher LS, et al. Pleiotropic patterns of quantitative trait loci for 70 murine skeletal traits. Genetics. 2008;178:2275–88.
21. Leamy LJ, Routman EJ, Cheverud JM. Quantitative trait loci for early-and late-developing skull characters in mice: a test of the genetic independ-ence model of morphological integration. Am Nat. 1999;153:201–14. 22. Wolf JB, Leamy LJ, Routman EJ, Cheverud JM. Epistatic pleiotropy and the
genetic architecture of covariation within early and late-developing skull trait complexes in mice. Genetics. 2005;171:683–94.
23. Burgio G, Baylac M, Heyer E, Montagutelli X. Exploration of the genetic organization of morphological modularity on the mouse mandible using a set of interspecific recombinant congenic strains between C57BL/6 and mice of the Mus spretus species. G3: genes |Genomes|. Genetics. 2012;2:1257–68.
24. Burgio G, Baylac M, Heyer E, Montagutelli X. Nasal bone shape is under complex epistatic genetic control in mouse interspecific recombinant congenic strains. PLoS One. 2012;7(5):e37721. https://doi.org/10.1371/ journal.pone.0037721.
25. Burgio G, Baylac M, Heyer E, Montagutelli X. Genetic analysis of skull shape variation and morphological integration in the mouse using inter-specific recombinant congenic strains between C57BL/6 and mice of the mus spretus species. Evolution. 2009;63:2668–86.
26. Maga AM, Navarro N, Cunningham ML, Cox TC. Quantitative trait loci affecting the 3D skull shape and size in mouse and prioritization of can-didate genes in-silico. Front Physiol. 2015;6:92. https://doi.org/10.3389/ fphys.2015.00092.
27. Pallares LF, Harr B, Turner LM, Tautz D. Use of a natural hybrid zone for genomewide association mapping of craniofacial traits in the house mouse. Mol Ecol. 2014;23:5756–70.
28. Pallares LF, Carbonetto P, Gopalakrishnan S, Parker CC, Ackert-Bicknell CL, Palmer AA, et al. Mapping of craniofacial traits in outbred mice identifies major developmental genes involved in shape determination. PLoS Genet. 2015;11:1–25.
29. Shorter J, Huang W, Beak JY, Hua K, Pardo-Manuel de Villena F, Pomp D, et al. Quantitative trait mapping in Diversity Outbred mice identifies two genomic regions associated with heart size. Mamm Genome. 2017. https://doi.org/10.1007/s00335-017-9730-7.
30. Green RM, Leach CL, Hoehn N, Marcucio RS, Hallgrímsson B. Quantifying three-dimensional morphology and RNA from individual embryos. Dev Dyn. 2017;246:431–6.
31. Welsh CE, Miller DR, Manly KF, Wang J, McMillan L, Morahan G, et al. Status and access to the Collaborative Cross population. Mamm Genome. 2012;23:706–12.
32. Morgan AP, Fu C-P, Kao C-Y, Welsh CE, Didion JP, Yadgary L, et al. The mouse universal genotyping array: from substrains to subspecies. G3: genes |Genomes|. Genetics. 2016;6:263–79.
33. R Developmental Core Team. R: a language and environment for statisti-cal computing. Vienna: R Foundation for Statististatisti-cal Computing; 2008. http://www.R-project.org.
34. Kaufman MH. The atlas of mouse development. London: Academic Press; 1992.
35. Miyake T, Cameron AM, Hall BK. Detailed staging of inbred C57BL/6 mice between Theiler’s [1972] stages 18 and 21 (11–13 days of gesta-tion) based on craniofacial development. J Craniofac Genet Dev Biol. 1996;16:1–31.
36. Geng X, Acosta S, Lagutin O, Gil HJ, Oliver G. Six3 dosage mediates the pathogenesis of holoprosencephaly. Development. 2016;143:4462–73. 37. Klingenberg CP. Morphological integration and developmental
modular-ity. Annu Rev Ecol Evol Syst. 2008;39:115–32.
38. Mackay TF. The genetic architecture of quantitative traits. Annu Rev Genet. 2001;35:303–39.
39. Wood AR, Esko T, Yang J, Vedantam S, Pers TH, Gustafsson S, et al. Defining the role of common variation in the genomic and biological architecture of adult human height. Nat Genet. 2014;46:1173–86.
40. Magen S, Magnani R, Haziza S, Hershkovitz E, Houtz R, Cambi F, et al. Human calmodulin methyltransferase: expression, activity on calmodulin, and Hsp90 dependence. PLoS ONE. 2012;7:e52425.
41. Bartholdi D, Asadollahi R, Oneda B, Schmitt-Mechelke T, Tonella P, Baumer A, et al. Further delineation of genotype–phenotype correlation in homozygous 2p21 deletion syndromes: first description of patients without cystinuria. Am J Med Genet Part A. 2013;161:1853–9. 42. Abzhanov A, Kuo WP, Hartmann C, Grant BR, Grant PR, Tabin CJ. The
calmodulin pathway and evolution of elongated beak morphology in Darwin’s finches. Nature. 2006;442:563–7.
43. Fogelgren B, Kuroyama MC, McBratney-Owen B, Spence AA, Malahn LE, Anawati MK, et al. Misexpression of Six2 is associated with heritable frontonasal dysplasia and renal hypoplasia in 3H1 Br mice. Dev Dyn. 2008;237:1767–79.
44. Brunskill EW, Potter AS, Distasio A, Dexheimer P, Plassard A, Aronow BJ, et al. A gene expression atlas of early craniofacial development. Dev Biol. 2014;391:133–46.
45. Ohto H, Takizawa T, Saito T, Kobayashi M, Ikeda K, Kawakami K. Tissue and developmental distribution of Six family gene products. Int J Dev Biol. 2002;42:141–8.
46. Brodbeck S, Besenbeck B, Englert C. The transcription factor Six2 activates expression of the Gdnf gene as well as its own promoter. Mech Dev. 2004;121:1211–22.
47. Garcez RC, Le Douarin NM, Creuzet SE. Combinatorial activity of Six1-2-4 genes in cephalic neural crest cells controls craniofacial and brain devel-opment. Cell Mol Life Sci. 2014;71:2149–64.
• We accept pre-submission inquiries
• Our selector tool helps you to find the most relevant journal
• We provide round the clock customer support
• Convenient online submission
• Thorough peer review
• Inclusion in PubMed and all major indexing services
• Maximum visibility for your research
Submit your manuscript at www.biomedcentral.com/submit
Submit your next manuscript to BioMed Central
and we will help you at every step:
49. He G, Tavella S, Hanley KP, Self M, Oliver G, Grifone R, et al. Inactivation of Six2 in mouse identifies a novel genetic mechanism controlling develop-ment and growth of the cranial base. Dev Biol. 2010;344:720–30. 50. Del Bene F, Tessmar-Raible K, Wittbrodt J. Direct interaction of geminin
and Six3 in eye development. Nature. 2004;427:745–9.
51. Lang RA. Pathways regulating lens induction in the mouse. Int J Dev Biol. 2004;48:783–91.
52. Liu W, Lagutin OV, Mende M, Streit A, Oliver G. Six3 activation of Pax6 expression is essential for mammalian lens induction and specification. EMBO J. 2006;25:5383–95.
53. Gestri G, Carl M, Appolloni I, Wilson SW, Barsacchi G, Andreazzoli M. Six3 functions in anterior neural plate specification by promoting cell prolifer-ation and inhibiting Bmp4 expression. Development. 2005;132:2401–13. 54. Lagutin OV, Zhu CC, Kobayashi D, Topczewski J, Shimamura K, Puelles
L, et al. Six3 repression of Wnt signaling in the anterior neuroecto-derm is essential for vertebrate forebrain development. Genes Dev. 2003;17:368–79.
55. Lacbawan F, Solomon BD, Roessler E, El-Jaick K, Domené S, Velez JI, et al. Clinical spectrum of Six3-associated mutations in holoprosencephaly: correlation between genotype, phenotype, and function. J Med Genet. 2009. https://doi.org/10.1136/jmg.2008.063818.
56. Hu D, Marcucio RS. A SHH-responsive signaling center in the forebrain regulates craniofacial morphogenesis via the facial ectoderm. Develop-ment. 2009;136:107–16.
57. Geng X, Lavado A, Lagutin OV, Liu W, Oliver G. Expression of Six3 Oppo-site Strand (Six3OS) during mouse embryonic development. Gene Expr Patterns. 2007;7:252–7.
58. Rapicavoli NA, Poth EM, Zhu H, Blackshaw S. The long noncoding RNA c acts in trans to regulate retinal development by modulating Six3 activity. Neural development. 2011;6:1.
59. Jiang X, Iseki S, Maxson RE, Sucov HM, Morriss-Kay GM. Tissue origins and interactions in the mammalian skull vault. Developmental Biology. 2002;241:106–16.
60. Noden DM, Trainor PA. Relations and interactions between cranial meso-derm and neural crest populations. J Anat. 2005;207:575–601.
61. Depew MJ, Tucker AS, Sharpe PT. Craniofacial development. In: Rossant J, Tam PPL, editors. Mouse development, patterning, morphogenesis, and organogenesis. San Diego: Academic Press; 2002. p. 421–98.
62. Cerny R, Lwigale P, Ericsson R, Meulemans D, Epperlein H-H, Bronner-Fraser M. Developmental origins and evolution of jaws: new interpreta-tion of “maxillary” and “mandibular”. DevBiol. 2004;276:225–36. 63. Lee S-H, Bédard O, Buchtová M, Fu K, Richman JM. A new origin for the
maxillary jaw. Dev Biol. 2004;276:207–24.
64. Santagati F, Rijli FM. Cranial neural crest and the building of the verte-brate head. Nat Rev Neurosci. 2003;4:806–18.
65. Gai Z, Yu X, Zhu M. The evolution of the zygomatic bone from Agnatha to Tetrapoda. Anat Rec. 2017;300:16–29.
66. Kawasaki K, Richtsmeier JT. Association of the chondrocranium and dermatocranium in early skull formation. In: Percival CJ, Richtsmeier JT, editors. Building bones: bone development and formation in anthropol-ogy. 1st ed. Cambridge: Cambridge University Press; 2017. p. 52–78. 67. Jeong J, Li X, McEvilly RJ, Rosenfeld MG, Lufkin T, Rubenstein JL. Dlx genes pattern mammalian jaw primordium by regulating both lower jaw-specific and upper jaw-specific genetic programs. Development. 2008;135:2905–16.
68. Heuzé Y, Kawasaki K, Schwarz T, Schoenebeck JJ, Richtsmeier JT. Develop-mental and evolutionary significance of the zygomatic bone. Anat Rec. 2016;299:1616–30.
69. Tavares AL, Cox TC, Maxson RM, Ford HL, Clouthier DE. Negative regula-tion of Endothelin signaling by SIX1 is required for proper maxillary development. Development. 2017;144:2021–31.
70. Yen H-Y, Ting M-C, Maxson RE. Jagged1 functions downstream of Twist1 in the specification of the coronal suture and the formation of a boundary between osteogenic and non-osteogenic cells. Dev Biol. 2010;347:258–70.
71. Merrill AE, Bochukova EG, Brugger SM, Ishii M, Pilz DT, Wall SA, et al. Cell mixing at a neural crest-mesoderm boundary and deficient ephrin-Eph signaling in the pathogenesis of craniosynostosis. Hum Mol Genet. 2006;15:1319–28.
72. Ting M-C, Wu NL, Roybal PG, Sun J, Liu L, Yen Y, et al. EphA4 as an effector of Twist1 in the guidance of osteogenic precursor cells during calvarial bone growth and in craniosynostosis. Development. 2009;136:855–64. 73. Holmes G, Basilico C. Mesodermal expression of Fgfr2S252W is necessary
and sufficient to induce craniosynostosis in a mouse model of Apert syndrome. Dev Biol. 2012;368:283–93.
74. Self M, Lagutin OV, Bowling B, Hendrix J, Cai Y, Dressler GR, et al. Six2 is required for suppression of nephrogenesis and progenitor renewal in the developing kidney. EMBO J. 2006;25:5214–28.
75. Jabalee J, Hillier S, Franz-Odendaal T. An investigation of cellular dynamics during the development of intramembranous bones: the scleral ossicles. J Anat. 2013;223:311–20.
76. Tabler J, Rice CP, Liu KJ, Wallingford J. A novel ciliopathic skull defect aris-ing from excess neural crest. Dev Biol. 2016;417:4–10.
77. De Beer GR. The development on the vertebrate skull. Chicago: The University of Chicago Press; 1985.
78. Elbroch M. Animal skulls: a guide to North American species. Mechanics-burg: Stackpole Books; 2006.
79. Márquez S, Pagano AS, Schwartz JH, Curtis A, Delman BN, Lawson W, et al. Toward understanding the mammalian zygoma: insights from compara-tive anatomy, growth and development, and morphometric analysis. Anat Rec. 2017;300:76–151.
80. Herring SW, Teng S, Huang X, Mucci RJ, Freeman J. Patterns of bone strain in the zygomatic arch. Anat Rec. 1996;246:446–57.
81. Witzel U, Preuschoft H, Sick H. The role of the zygomatic arch in the statics of the skull and its adaptive shape. Folia Primatol. 2004;75:202–18. 82. Dumont ER, Piccirillo J, Grosse IR. Finite-element analysis of biting behavior and bone stress in the facial skeletons of bats. Anat Rec. 2005;283:319–30.
83. Franks EM, Holton NE, Scott JE, McAbee KR, Rink JT, Pax KC, et al. Betwixt and between: intracranial perspective on zygomatic arch plasticity and function in mammals. Anat Rec. 2016;299:1646–60.
84. Gilbert M. Mammalian osteology. Springfield: Missouri Archaeological Society; 1980.
85. Popesko P, Rajtová V, Horák J. The colour atlas of anatomy of small labora-tory animals. London: Saunders; 1992.
86. Sánchez-Villagra MR, Horovitz I, Motokawa M. A comprehensive morpho-logical analysis of talpid moles (Mammalia) phylogenetic relationships. Cladistics. 2006;22:59–88.
87. Goswami A, Prochel J. Ontogenetic Morphology and Allometry of the Cranium in the Common European Mole (Talpa europaea). J Mammal. 2007;88:667–77.
88. Hopson JA, Kielan-Jaworowska Z, Allin EF. The cryptic jugal of multituber-culates. J Vertebr Paleontol. 1989;9:201–9.
![Fig. 2 Linear distances for analysis. Pairs of linear distances that were tested for a negative correlation within CC founder/F1 and DO samples, plotted between previously defined craniofacial landmarks [16]](https://thumb-us.123doks.com/thumbv2/123dok_us/663987.2065525/5.595.57.291.87.439/distances-analysis-distances-negative-correlation-previously-craniofacial-landmarks.webp)