Cardiovascular Disease Prediction from
Electrocardiogram by Using Machine Learning
https://doi.org/10.3991/ijoe.v16i07.13569
Nazrul Anuar Nayan (*), Hafifah Ab Hamid, Mohd Zubir Suboh, Rosmina Jaafar Universiti Kebangsaan Malaysia, Bangi, Malaysia
Noraidatulakma Abdullah, Nurul Ain Mhd Yusof, Mariatul Akma Hamid, Nur Farawahida Zubiri, Azwa Shawani Kamalul Arifin, Syakila Mohd Abd Daud,
Mohd Arman Kamaruddin, A. Rahman A. Jamal UKM Medical Biology Institute (UMBI), Kuala Lumpur, Malaysia
Abstract—Cardiovascular disease (CVD) is the leading cause of deaths worldwide. In 2017, CVD contributed to 13,503 deaths in Malaysia. The current approaches for CVD prediction are usually invasive and costly. Machine learn-ing (ML) techniques allow an accurate prediction by utilizlearn-ing the complex in-teractions among relevant risk factors. This study presents a case–control study involving 60 participants from The Malaysian Cohort, which is a prospective population-based project. Five parameters, namely, the R–R interval and root mean square of successive differences extracted from electrocardiogram (ECG), systolic and diastolic blood pressures, and total cholesterol level, were statisti-cally significant in predicting CVD. Six ML algorithms, namely, linear discri-minant analysis, linear and quadratic support vector machines, decision tree, k-nearest neighbor, and artificial neural network (ANN), were evaluated to deter-mine the most accurate classifier in predicting CVD risk. ANN, which achieved 90% specificity, 90% sensitivity, and 90% accuracy, demonstrated the highest prediction performance among the six algorithms. In summary, by utilizing ML techniques, ECG data can serve as a good parameter for CVD prediction among the Malaysian multiethnic population.
Keywords—CVD, ECG, machine learning, The Malaysian Cohort, RMSSD
1
Introduction
hypertension, age, gender, smoking, and inactive lifestyle, are important predictors of CVD risk [4] – [5]. The Malaysian Cohort (TMC) project, which was initiated in 2006 to address the rising trends in non-communicable diseases, is a large prospective study involving 106,527 multiethnic participants [6]. More than 2000 parameters, including lipid profile, fasting blood glucose (FBG), body composition, blood pressure, and electrocardiogram (ECG), were obtained or measured from each participant.
ECG measures the electrical activity of the heart and has been extensively used in detecting heart diseases because of its simplicity and noninvasiveness. Moreover, independent risk markers for cardiovascular deaths can be found from ECG metrics, [7] which provide comprehensive information on cardiac rhythms and conduction patterns. The standard ECG uses 12 leads from 12 vantage points recorded using 10 electrodes, six of which were on the chest wall and four were on the limbs. The three limb leads are used to generate a recording, whereas the right leg lead serves as an electrical ground [8]. Among the 12 leads, lead II, which measures the potential difference between the electrodes attached to the right arm and left leg, is commonly utilized for diagnosing heart diseases. Lead II readings highlight various segments within the heartbeat and displays three of the most important waves: P, QRS, and T [9]. The R–R interval is the time between the R peak of a heartbeat with respect to another heartbeat. The heart rate variability (HRV), which is abnormal in patients with coronary artery disease, DM, and coronary heart failure, is the interval between the consecutive normal heartbeats that reflects cardiac autonomic function [10] – [11]. Yadav [12] found a significant correlation among the indices of HRV by using the root mean square of successive differences (RMSSD, p = 0.018) and R–R intervals (p = 0.010). According to O’Neal [13], the standard deviations (SDs) of the R–R inter-vals and RMSSD are associated with an increased risk of CVD and all-cause mortality and vary by sex and race [14]. HRV can also serve as the main predictor of future vascular events [15].
Breathing rate (BR) is a key physiological parameter used in a range of clinical set-tings. Among the vital signs measured in acutely ill hospital patients, BR provides a highly accurate prediction of deterioration [16]. Despite the diagnostic and prognostic values, BR is still widely measured by manually counting breaths. Many algorithms have been proposed to estimate BR from ECG and photoplethysmogram signals. These BR algorithms provide opportunity for the automated, electronic, and unobtru-sive measurement of BR in healthcare and fitness monitoring [17].
neural network (CNN), are recently explored. Acharya [30] compared the accuracy, sensitivity, and specificity of CNN with and without noise from ECG signals.
The present study aims to identify the most significant parameters extracted from ECG signals for CVD prediction by using six types of supervised ML techniques, namely, LDA, linear and quadratic SVMs, DT, kNN, and ANN. To the best of our knowledge, this study is the first to use the raw ECG waveform in predicting CVD among Malaysian subjects. A predictive model for CVD diagnosis at an early stage is crucial in reducing and preventing the morbidity and mortality due to CVD. Further-more, a solution for this issue is timely because the Malaysian Ministry of Health has launched the National Strategic Plan for Non-Communicable Disease (NSP-NCD 2016-2025) in response to the global challenge in combating NCDs in general and CVD in particular.
2
Methodology
2.1 Study sample
A total of 66 subjects aged 35 to 65 years recruited between April 2006 and Sep-tember 2012 were selected from the participants of the TMC project for the nested case–control study. These subjects provided written informed consent for follow-up and also agreed to a 10-min ECG re-recording. The subjects with history of stroke, myocardial infarction, and heart failure were defined as cases, whereas those without a history of CVD were defined as controls. The study was conducted in accordance with the Declaration of Helsinki, and the ethics approval was obtained from the Medi-cal Research Ethics Committee of Universiti Kebangsaan Malaysia (Project Code: FF-205-2007).
were selected for the final analysis. The six other subjects were eliminated due to poor ECG quality signal during the 10-min recording.
2.2 Preprocessing
The ECG signals were preprocessed using filtering algorithms to eliminate high- and low-frequency noises. The baseline wander, which is usually caused by respirato-ry, body movements, and inadequate electrode position, is a low-frequency noise absorbed by the ECG signals [31]. A high-pass filter with a cutoff frequency of 0.5 Hz was used to overcome the problem of baseline wander in the signal. Filters with a linear phase from the finite impulse response (FIR) were required to remove the base-line wander to avoid phase distortion when changing the wave feature in the heart cycle. Power line interruptions at a frequency of 50 Hz resulted in amplified sinus noise on the ECG signals. In this study, the infinite impulse response notch filter was used to eliminate 50 ± 0.2 Hz. The signals used were from the third until the ninth minute to eliminate the transient state. The sampling frequency was 500 Hz.
Four different algorithms, which were developed by Behar [32], Zhang [33], Pan and Tompkins, and Clifford [32], were used to detect the QRS peaks. The accuracy of the detectors was compared. QRS peaks are essential for the feature extraction of ECG signals and determination of the signal quality of ECG. Signal quality indexing involved using the two best evaluated QRS peak detectors [34]. The index was given a score of 1 if both detectors agreed where the point of the peak was and a score of less than 1 otherwise. The window for signal quality indexing was 10 s. After the preprocessing phase, the HRV was analyzed, and the results were recorded.
2.3 Data extraction
Data extraction is the key to success when using the ECG signals in CVD classifi-cation. The extracted parameters were the R–R interval, HRV, and BR. The R–R interval was the most common identifiable feature and was calculated from cardiac rhythm. This interval was measured using the detected QRS peaks, and the HRV was indexed using the RMSSD of the R–R interval.
2.4 Statistical analysis
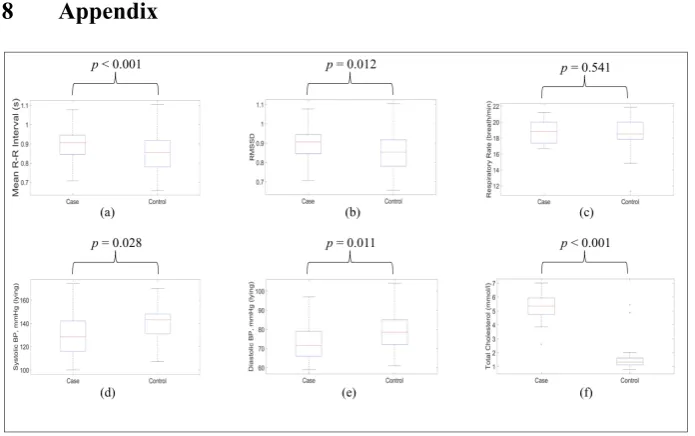
All categorical parameters were presented as numbers and percentages, whereas continuous parameters were presented as mean and SD. Statistical analyses were performed using the chi-square test and t-test for categorical and continuous data, respectively. Boxplot was used to represent the distribution of data between the case and control groups (Appendix). A p-value threshold of 0.05 was used for declaring significance.
2.5 Automatic classification
At this stage, predictive models were built from significant input data by using ML algorithms for CVD risk classification. The six state-of-the-art methods with the most widely used algorithms related to CVD classification were ANN [25], LDA [19], linear and quadratic SVMs [21] – [22], DT [23], and kNN [24].
The automatic classification model was developed using supervised ML methods in 60 samples. The data obtained were randomly divided into training and test data. Table 1 shows the distribution of the data used. The training and test datasets consist-ed of variables or features that exhibit significant associations to the case and control groups. The ratio of the training to test data was 2:1.
Table 1. Distribution of data for classification
Subjects Group Training Data Test Data Total
Healthy Control 20 10 30
Risk to CVD Case 20 10 30
Total 2 groups 40 20 60
Two linear and four nonlinear classifiers were used to categorize the training data into groups. LDA and linear SVM were the two linear classifiers used to create a linear function that can separate the control and case data. SVM with the quadratic kernel function (i.e., quadratic SVM), DT, kNN, and ANN were used as nonlinear classifiers to differentiate both groups. All models were trained with 40 training data (20 cases and 20 controls) by using the tenfold cross-validation method, which divid-ed the training data into 10 equal subsets. Nine subsets were usdivid-ed to train the model, whereas the remaining subset was utilized to test the trained model. The accuracy of the first training model was determined. This process was repeated 10 times for each individual subset. The average of the 10 accuracy data was used to indicate the overall training performance of the trained models.
hyperplane is built by maximizing the margin or space between the boundary line and the dataset of the classes. For this study, the linear and quadratic function kernels were used to find the respective linear and nonlinear relations of the selected input to the corresponding groups [39].
The DT classifier constructs a tree from the training data by using five selected fea-tures. The tree provides the rules to classify case and control data, and the rules were used to determine the group of the test data. Designing the tree is important to in-crease the classification performance [40]. In this study, Gini’s diversity index was used as the split criterion, with a maximum number of splits set to 100. The kNN algorithm identifies similarities among training inputs in groups or classes. New in-puts are classified by measuring the minimum distance between the test and training data. Those who are close to others are called neighbors [41]. A Euclidean distance of 10 neighbors was applied in this study to determine the nearest neighbor of the test data to the corresponding case or control group.
ANN is a training method that emulates the human brain and is an outstanding method for predicting the relationship between the input and target values [42]. ANN has been widely used in cardiology applications for pattern recognition and classifica-tion tasks [39]. The feed-forward neural network of ANN can accurately classify ECG signals by optimizing the number of hidden layers, hidden neurons, learning algo-rithm, and transfer function used [43].A two-layer feed-forward backpropagation network with five input neurons and one output neuron was used in this study. The network was trained with 10 different values of initial weights and biases (random “seed” of 1–10), 30 different numbers of hidden neurons (1–30 hidden neurons), 2 different training algorithms, and Levenberg–Marquardt (“trainlm”) and Gradient descent with an adaptive learning rate (“traingda”). The log-sigmoid transfer functions were used in both layers to scale the output from 0 to 1.
Each trained model of every classifier was tested with 20 sets of test data (distinct from the training data) to examine the performance in terms of specificity, sensitivity, and accuracy. Specificity refers to the ability of the trained model to categorize healthy subjects in the control group. Sensitivity refers to the categorization of CVD risk subjects into the case group. Accuracy is the average of specificity and sensitivity and represents the overall performance of the model. The model of the six classifiers that can classify the test data into the respective group with the highest performance was selected as the best model for CVD risk prediction.
3
Results and Discussion
their high R-peak detection performances from the ECG signals. The detected marks for these two peak detectors were more accurate than Behar and Clifford’s (Figure 1).
Fig. 1. ECG R-peak detector evaluation using: (a) Behar, (b) Zhang, (c) Pan-Tompkins and (d) Clifford
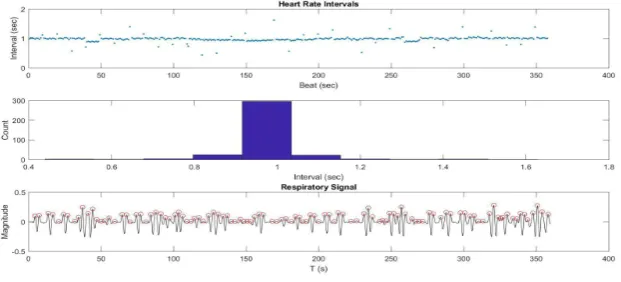
Figure 2 presents an example of heart rate intervals, variance of heart rate intervals, and respiratory signals extracted from the ECG of the case group. The mean heart rate interval was 1.0 s and was supported by a histogram. The mean BR extracted from the respiratory signal was 17 breaths per minute.
Fig. 2. Parameters extracted from ECG signals
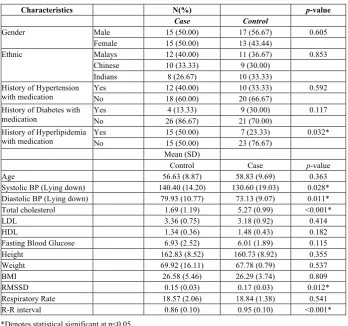
showed significant differences (p = 0.032). In this study, the significant values pro-duced from the means and SDs were used as inputs for ML classification, except for the categorical parameters, i.e., a history of hyperlipidemia with medication.
Table 2. Descriptive characteristics of the TMC participants (N=60)
Characteristics N(%) p-value
Case Control
Gender Male 15 (50.00) 17 (56.67) 0.605 Female 15 (50.00) 13 (43.44)
Ethnic Malays 12 (40.00) 11 (36.67) 0.853 Chinese 10 (33.33) 9 (30.00)
Indians 8 (26.67) 10 (33.33) History of Hypertension
with medication
Yes 12 (40.00) 10 (33.33) 0.592 No 18 (60.00) 20 (66.67)
History of Diabetes with medication
Yes 4 (13.33) 9 (30.00) 0.117 No 26 (86.67) 21 (70.00)
History of Hyperlipidemia with medication
Yes 15 (50.00) 7 (23.33) 0.032* No 15 (50.00) 23 (76.67)
Mean (SD)
Control Case p-value Age 56.63 (8.87) 58.83 (9.69) 0.363 Systolic BP (Lying down) 140.40 (14.20) 130.60 (19.03) 0.028* Diastolic BP (Lying down) 79.93 (10.77) 73.13 (9.07) 0.011* Total cholesterol 1.69 (1.19) 5.27 (0.99) <0.001*
LDL 3.36 (0.75) 3.18 (0.92) 0.414
HDL 1.34 (0.36) 1.48 (0.43) 0.182
Fasting Blood Glucose 6.93 (2.52) 6.01 (1.89) 0.115 Height 162.83 (8.52) 160.73 (8.92) 0.355 Weight 69.92 (16.11) 67.78 (0.79) 0.537 BMI 26.58 (5.46) 26.29 (3.74) 0.809 RMSSD 0.15 (0.03) 0.17 (0.03) 0.012* Respiratory Rate 18.57 (2.06) 18.84 (1.38) 0.541 R-R interval 0.86 (0.10) 0.95 (0.10) <0.001*
*Denotes statistical significant at p<0.05
line-arly separable with each other. Additional data are required to train and test additional inputs to improve the classification performance of the CVD risk prediction model.
Table 3. Training and classification performance of all six classifiers
Classifiers Training performance (%) Testing performance (%)
Specificity Sensitivity Accuracy Specificity Sensitivity Accuracy
LDA 95 100 97.5 80 80 80
Linear 90 100 95 80 90 85
SVM Quadratic 95 100 97.5 80 80 80
SVM DT 95 95 95 90 80 84
kNN 90 100 95 80 80 80
ANN 100 100 100 90 90 90
4
Conclusion
This study inferred that the R–R interval, RMSSD, SBP, DBP, and total cholesterol were the most significant parameters in predicting CVD. These parameters were used as inputs for six ML techniques, namely, LDA, linear and quadratic SVMs, DT, kNN, and ANN. The outputs of these automated prediction systems were compared in terms of specificity, sensitivity, and accuracy. Among the six ML algorithms, ANN showed the highest performance (90% specificity, 90% sensitivity, and 90% accuracy). The results verified that the predictive model consisting of ECG, SBP, DBP, and total cholesterol can be used to predict the CVD risk in multiracial Malaysian population with almost 90% precision by using the ANN ML technique. These findings, howev-er, should be validated using a larger set of individuals than the set utilized in this study.
5
Acknowledgement
This research was supported by the Ministry of Education Malaysia’s Fundamental Research Grant Scheme FRGS/1/2019/TK04/UKM/02/4, AP-2017-007/3 and PDE48.
6
References
[1]T. Koivistoinen, L. P. Lyytikäinen, H. Aatola, T. Luukkaala, M. Juonala, J. Viikari, T. Lehtimäki, O. T. Raitakari, M. Kähönen, and N. Hutri-Kähönen, “Pulse Wave Velocity Predicts the Progression of Blood Pressure and Development of Hypertension in Young Adults,” Hypertension, vol. 71, pp. 451–456, 2018. https://doi.org/10.1161 /hypertensionaha.117.10368
[3]Department of Statistics Malaysia, “Statistics on causes of death in Malaysia,” 2018. [On-line]. Available: https://www.dosm.gov.my/v1/index.php. [Accessed Jan. 27, 2020]. [4]K. N. Hong, V. Fuster, R. S. Rosenson, C. Rosendorff, and D. L. Bhatt, “How Low to Go
With Glucose, Cholesterol, and Blood Pressure in Primary Prevention of CVD,” Journal of
the American College of Cardiology, vol. 70, no. 17, pp. 2171–2185, 2017.
https://doi.org/10.1016/j.jacc.2017.09.001
[5]V. A. Moyer, “Screening for Coronary Heart Disease with Electrocardiography: U.S. Pre-ventive Services Task Force Recommendation Statement,” Annals of Internal Medicine, vol. 157, no. 7, p. I, 2012. https://doi.org/10.7326/0003-4819-157-7-201210020-00520 [6]R. Jamal, S. Z. Syed Zakaria, M. A. Kamaruddin, N. Abd Jalal, N. Ismail, N. Mohd Kamil,
N. Abdullah, N. Baharudin, N. H. Hussin, H. Othman, and N. M. Mahadi, “Cohort profile: The Malaysian Cohort (TMC) project: a prospective study of non-communicable diseases in a multi-ethnic population,” International journal of epidemiology, vol. 44, no. 2, pp. 423-431, 2014. https://doi.org/10.1093/ije/dyu089
[7]R. Deo, H. Shou, E. Z. Soliman, W. Yang, J. M. Arkin, X. Zhang, R. R. Townsend, A. S. Go, M. G. Shlipak, and H. I. Feldman, “Electrocardiographic measures and prediction of cardiovascular and noncardiovascular death in CKD,” Journal of the American Society of Nephrology, vol. 27, no. 2, pp. 559-569, 2016. https://doi.org/10.1681/asn.2014101045 [8]L. Ganz, “Electrocardiography,” in Goldman’s Cecil Medicine, 24th ed., L. Goldman and
A. I. Schafer, Eds. London: Elsevier Health Sciences, 2012, vol. 1, pp-272-278. https://doi. org/10.1016/b978-1-4377-1604-7.00054-3
[9]E. J. D. S. Luz, W. R. Schwartz, G. Cámara-Chávez, and D. Menotti, “ECG-based heart-beat classification for arrhythmia detection: A survey,” Computer methods and programs in biomedicine, vol. 127, pp. 144-164, 2016. https://doi.org/10.1016/j.cmpb.2015.12. 008
[10]V. N. Patel, B. R. Pierce, R. K. Bodapati, D. L. Brown, D. G. Ives, and P. K. Stein, “Asso-ciation of holter-derived heart rate variability parameters with the development of conges-tive heart failure in the cardiovascular health study,” JACC - Heart Failure, vol. 5, no. 6, pp. 423-431, 2017. https://doi.org/10.1016/j.jchf.2016.12.015
[11]N. S. Risman, S. N. M. Yassin, N. A. Nayan, S. C. Wei, and Y. W. Hau, “Implementation of Heart Rate Variability Analysis Algorithm on FPGA Platform,” International Journal of
Applied Engineering Research, vol. 11, no. 12, pp. 7809-7814, 2016.
[12]R. L. Yadav, P. K. Yadav, L. K. Yadav, K. Agrawal, S. K. Sah, and M. N. Islam, “Asso-ciation between obesity and heart rate variability indices: an intuition toward cardiac auto-nomic alteration – a risk of CVD,” Diabetes, Metabolic Syndrome and Obesity: Targets and Therapy, vol. 10, pp. 57–64, 2016. https://doi.org/10.2147/dmso.s123935
[13]W. T. O'Neal, L. Y. Chen, S. Nazarian, and E. Z. Soliman, “Reference ranges for short-term heart rate variability measures in individuals free of cardiovascular disease: the Multi-Ethnic Study of Atherosclerosis (MESA),” Journal of electrocardiology, vol. 49, no. 5, pp. 686-690, 2016. https://doi.org/10.1016/j.jelectrocard.2016.06.008
[14]F. H. Messerli, L. Hofstetter, S. F. Rimoldi, E. Rexhaj, and S. Bangalore, “Risk Factor Variability and Cardiovascular Outcome,” Journal of the American College of Cardiology, vol. 73, no. 20, pp. 2596–2603, 2019. https://doi.org/10.1016/j.jacc.2019.02.063
[15]P. Melillo, R. Izzo, A. Orrico, P. Scala, M. Attanasio, M. Mirra, N. De Luca, and L. Pec-chia, “Automatic prediction of cardiovascular and cerebrovascular events using heart rate variability analysis,” PloS one, vol. 10, no. 3, p. 0118504, 2015. https://doi.org/10.1371 /journal.pone.0118504
and R. Amarasingham, “Predicting out of intensive care unit cardiopulmonary arrest or death using electronic medical record data,” BMC medical informatics and decision mak-ing, vol. 13, no. 1, p. 28, 2013. https://doi.org/10.1186/1472-6947-13-28
[17]P. H. Charlton, D. A. Birrenkott, T. Bonnici, M. A. Pimentel, A. E. Johnson, J. Alastruey, L. Tarassenko, P. J. Watkinson, R. Beale, and D. A Clifton, “Breathing rate estimation from the electrocardiogram and photoplethysmogram: A review,” IEEE reviews in biomed-ical engineering, vol. 11, pp. 2-20, 2017. https://doi.org/10.1007/s12471-019-1286-6 [18]W. Benjamins, T. Hendriks, J. Knuuti, L. E. Juarez-Orozco, and P. van der Harst, “A
pri-mer in artificial intelligence in cardiovascular medicine,” Netherlands Heart Journal, vol. 27, pp. 392-402, 2019. https://doi.org/10.1007/s12471-019-1286-6
[19]M. Llamedo and J. P. Martinez, “An automatic patient-adapted ECG heartbeat classifier al-lowing expert assistance,” IEEE Trans. Biomed. Eng., vol. 59, no. 8, pp. 2312-2320, 2012. https://doi.org/10.1007/s00034-014-9864-8
[20]E. Alickovic and A. Subasi, “Effect of multiscale PCA de-noising in ECG beat classifica-tion for diagnosis of cardiovascular diseases,” Circuits, Systems, and Signal Processing, vol. 34, no. 2, pp. 513-533, 2015. https://doi.org/10.1007/s00034-014-9864-8
[21]W. Yang, Y. Si, D. Wang, and B. Guo, “Automatic recognition of arrhythmia based on principal component analysis network and linear support vector machine,” Computers in
biology and medicine, vol. 101, pp. 22-32, 2018. https://doi.org/10.1016/j.
compbiomed.2018.08.003
[22]C. G. Nayak, G. Seshikala, U. Desai, and S. G. Nayak, “Identification of arrhythmia clas-ses using machine-learning techniques,” International Journal of Biology and Biomedi-cine, vol. 1, pp. 48-53, 2016.
[23]H. J. Leach, D. P. O’Connor, R. J. Simpson, H. S. Rifai, S. K. Mama, and R. E. Lee, “An exploratory decision tree analysis to predict cardiovascular disease risk in African Ameri-can women,” Health Psychology, vol. 35, no. 4, pp. 397-402, 2016. https://doi.org/10.1037 /hea0000267
[24]S. Chabchoub, S. Mansouri, and R. B. Salah, “Detection of valvular heart diseases using impedance cardiography ICG,” Biocybernetics and Biomedical Engineering, vol. 38, no. 2, pp. 251-261, 2018. https://doi.org/10.1016/j.bbe.2017.12.002
[25]T. Mar, S. Zaunseder, J. P. Martinez, M. Llamedo, and R. Poll, “Optimization of ECG classification by means of feature selection,” IEEE Trans. Biomed. Eng., vol. 58, no. 8, pp. 2168-2177, 2011. https://doi.org/10.1109/jbhi.2014.2332001
[26]M. A. Escalona-Moran, M. C. Soriano, I. Fischer, and C. R. Mirasso, "Electrocardiogram classification using reservoir computing with logistic regression,” IEEE J. Biomed. Health Inform., vol. 19, no. 3, pp. 892-898, 2015. https://doi.org/10.1109/jbhi.2014.2332001 [27]M. H. Vafaie, M. Ataei, and H. R. Koofigar, “Heart diseases prediction based on ECG
sig-nals’ classification using a genetic-fuzzy system and dynamical model of ECG signals,”
Biomedical Signal Processing and Control, vol. 14, pp. 291–296, 2014.
https://doi.org/10.1016/j.atherosclerosis.2016.07.854
[28]Y. Maneerat, K. Prasongsukarn, S. Benjathummarak, W. Dechkhajorn, and U. Chaisri, “In-tersected genes in hyperlipidemia and coronary bypass patients: feasible biomarkers for coronary heart disease,” Atherosclerosis, vol. 252, pp. e183-e184, 2016. https://doi.org/10.1109/tbme.2012.2213253
[29]C. Ye, V. Bhagavatula, and M. T. Coimbra, “Heartbeat classification using morphological and dynamic features of ECG signals,” IEEE Trans. Biomed. Eng., vol. 59, no. 10, pp. 2930-2941, 2012. https://doi.org/10.1016/j.ins.2017.06.027
ECG signals,” Information Sciences, vol. 415-416, pp. 190–198, 2017. https://doi.org/10.1 016/j.ins.2017.06.027
[31]Z. D. Zhao amd Y. Q. Chen, “A New Method for Removal of Baseline Wander and Power Line Interference in ECG Signals,” In Proceedings of the 2006 International Conference on Machine Learning and Cybernetics, 2006, pp. 4342-4347. https://doi.org/10.1109/icmlc.20 06.259082
[32]J. Behar, J. Oster, Q. Li, and G. D. Clifford, “ECG Signal Quality During Arrhythmia and Its Application to False Alarm Reduction,” IEEE Transactions on Biomedical Engineer-ing, vol. 60, no. 6, pp. 1660-1666, 2013. https://doi.org/10.1109/tbme.2013.2240452 [33]Q. Zhang, A. I. Manriquez, C. Medigue, Y. Papelier, M. Sorine, “An algorithm for robust
and efficient location of Twave ends in electrocardiograms,” IEEE Transactions on
Bio-medical Engineering, vol. 53, no. 12, pp. 2544-2552, 2006. https://doi.org/10.1109/tbme.
2006.884644
[34]N. A. Nayan and H. Ab Hamid, “Evaluation of patient electrocardiogram datasets using signal quality indexing,” Bulletin of Electrical Engineering and Informatics, vol. 8, no. 2, pp. 519-526, 2019. https://doi.org/10.11591/eei.v8i2.1289
[35]N. A. Nayan, R. Jaafar, and N. S. Risman, “Development of Respiratory Rate Estimation Technique Using Electrocardiogram and Photoplethysmogram for Continuous Health Monitoring,” Bulletin of Electrical Engineering and Informatics, vol. 7, no. 3, pp. 487-494, 2018. https://doi.org/10.11591/eei.v7i3.1244
[36]N. A. Nayan, N. S. Risman, and R. Jaafar, “A portable respiratory rate estimation system with a passive single-lead electrocardiogram acquisition module,” Technology and Health Care, vol. 24, no. 4, pp. 591-597, 2016. https://doi.org/10.3233/thc-161145
[37]E. H. Jang, B. J. Park, M. S. Park, S. H. Kim, and J. H. Sohn, “Analysis of physiological signals for recognition of boredom, pain, and surprise emotions,” Journal of physiological anthropology, vol. 34, no. 1, p. 25, 2015. https://doi.org/10.1186/s40101-015-0063-5 [38]G. Karwiky, C. Ahmad, W. Caesarendra, R. Ismail, and D. Kurniawan, “Sudden cardiac
death predictor based on spatial QRS-T angle feature and support vector machine case study for cardiac disease detection in Indonesia,” In IECBES 2016-IEEE-EMBS Confer-ence on Biomedical Engineering and SciConfer-ences, 2016, pp. 186-192. https://doi.org/10.1109 /iecbes.2016.7843440
[39]C. Sridhar, U. R. Acharya, H. Fujita, and G. M. Bairy, “Automated Diagnosis of Coronary Artery Disease Using Nonlinear Features Extracted from ECG Signals,” In 2016 IEEE In-ternational Conference on Systems, Man, and Cybernetics (SMC), 2017, pp. 000545-000549. https://doi.org/10.1109/smc.2016.7844296
[40]U. R. Acharya, H. Fujita, V. K. Sudarshan, V. S. Sree, L. W. J. Eugene, D. N. Ghista, and R. San Tan, “An integrated index for detection of sudden cardiac death using discrete wavelet transform and nonlinear features,” Knowledge-Based Systems, vol. 83, pp. 149-158, 2015. https://doi.org/10.1016/j.knosys.2015.03.015
[41]M. Abdar, S. R. N. Kalhori, T. Sutikno, I. M. I. Subroto, and G. Arji, “Comparing Perfor-mance of Data Mining Algorithms in Prediction Heart Diseases,” International Journal of
Electrical and Computer Engineering (IJECE), vol. 5, no. 6, pp. 1569-1576, 2015.
https://doi.org/10.11591/ijece.v5i6.pp1569-1576
[42]J. K. Kim and S. Kang, “Neural Network-Based Coronary Heart Disease Risk Prediction Using Feature Correlation Analysis,” Journal of Healthcare Engineering, pp. 1–13, 2017. https://doi.org/10.1155/2017/2780501
Methods and Programs in Biomedicine, vol. 125, pp. 52–63, 2016. https://doi.org/10.1016/j.cmpb.2015.12.024
[44]J. Pei, W. Tang, L. X. Li, C. Y. Su, and T. Wang, “Heart rate variability predicts mortality in peritoneal dialysis patients,” Renal failure, vol. 37, no. 7, pp. 1132-1137, 2015. https://doi.org/10.3109/0886022x.2015.1061729
[45]P. Sharma and D. V. Gupta, “Disease Classification from ECG Signal Using R-Peak Anal-ysis with Artificial Intelligence,” International Journal of Signal Processing, Image Pro-cessing and Pattern Recognition, vol. 11, no. 3, pp. 29-40, 2018. https://doi.org/10. 14257/ijsip.2018.11.3.03
[46]M. Z. Suboh, R. Jaafar, N. A. Nayan, and N. H. Harun, “ECG-based Detection and Predic-tion Models of Sudden Cardiac Death: Current Performances and New Perspectives on Signal Processing Techniques,” International Journal of Online and Biomedical Engineer-ing (iJOE), vol. 15, no. 15, pp. 110-126, 2019. https://doi.org/10.3991/ijoe.v15i15.11688
7
Authors
Dr. Nazrul Anuar Nayan is a professional engineer and a senior lecturer at the Faculty of Engineering & Built Environment, Universiti Kebangsaan Malaysia (UKM), 43600 Bangi, Malaysia. He obtained his Ph.D in Electronics and Information Systems Engineering at Gifu University, Japan in 2011. He has also gone for a-two year post-doctoral research programme at The Institute of Biomedical Engineering, Univ. of Oxford, United Kingdom. His research interests lie in the field of Big Data in Healthcare, Digital Integrated Circuit Design and Wireless Communications. E-mail [email protected]
Hafifah Ab Hamid is a full time Ph.D student at Faculty of Engineering & Built Environment, Universiti Kebangsaan Malaysia (UKM). Her main research interest is in biomedical engineering that includes medical instrumentation and signal pro-cessing.
Mohd Zubir Suboh is a lecturer at Universiti Kuala Lumpur, Malaysia. He is cur-rently pursuing his Ph.D in Faculty of Engineering & Built Environment, Universiti Kebangsaan Malaysia (UKM). His main research interest is in biomedical engineering that includes medical instrumentation, signal processing and artificial intelligence.
Dr Noraidatulakma Abdullah is a senior lecturer at UKM Medical Molecular Bi-ology Institute (UMBI), UKM Medical Centre, Cheras, 56000 Kuala Lumpur. She obtained her PhD in Medical Genetics from University of Newcastle, Australia in 2018. Her research interest is in Epidemiology and Biostatics, medical genetics and non-communicable diseases.
Dr. Rosmina Jaafar is senior lecturer at the Dept. Electrical, Electronics & Sys-tems Engineering, Faculty of Engineering & Built Environment, Universiti Kebang-saan Malaysia (UKM), 43600 Bangi, Malaysia. She has attained her Ph.D in Electri-cal, Electronic & Systems Engineering UKM in 2009. Her main research interest is biomedical engineering that includes signal processing, imaging and medical infor-matics as well as medical electronics & instrumentation.
Technology Management from UKM. She has 14 years’ experience in performing ECG.
Mariatul Akma Hamid is a research assistant at The Malaysian Cohort Project with 13 years’ experience in performing ECG.
Nur Farawahida Zubiri was a research assistant at The Malaysian Cohort Project with 9 years’ experience in performing ECG.
Azwa Shawani Kamalul Arifin is a research officer at The Malaysian Cohort Pro-ject. She obtained her Bachelor of Science (Hons.) in Statistics from Universiti Teklogi Mara (UiTM) Shah Alam with 2 years’ experience in performing ECG.
Syakila Mohd Abdul Daud is a research assistant of The Malaysian Cohort Pro-ject. She obtained her Bachelor of Science (Hons.) in Statistics from UiTM, Shah Alam and has 2 years’ experience in performing ECG.
Mohd Arman Kamaruddin is a senior scientific officer at UKM Medical Mo-lecular Biology Institute (UMBI) Cheras, 56000 Kuala Lumpur. He obtained his BSc in Science Bioinformatic from University of Malaya. He is a project manager of The Malaysian Cohort Project with 15 years’ experience.
Prof. Datuk Dr. A. Rahman A. Jamal is a professor of Paediatric Oncology and Haematology, and Molecular Biology. He is a Pro Vice Chancellor UKM Kuala Lumpur Campus and a project leader of The Malaysian Cohort Project (TMC). He obtained his PhD in Haematology from University of London in 1996 and MD from UKM in 1985 [email protected].