RESEARCH
Maintenance of active chromatin states
by HMGN2 is required for stem cell identity
in a pluripotent stem cell model
Sylvia Garza‑Manero
1†, Abdulmajeed Abdulghani A. Sindi
1,4†, Gokula Mohan
1,3, Ohoud Rehbini
1,
Valentine H. M. Jeantet
1, Mariarca Bailo
1, Faeezah Abdul Latif
1, Maureen P. West
1, Ross Gurden
1,
Lauren Finlayson
1, Silvija Svambaryte
1, Adam G. West
1and Katherine L. West
1,2*Abstract
Background: Members of the HMGN protein family modulate chromatin structure and influence epigenetic modifi‑ cations. HMGN1 and HMGN2 are highly expressed during early development and in the neural stem/progenitor cells of the developing and adult brain. Here, we investigate whether HMGN proteins contribute to the chromatin plasticity and epigenetic regulation that is essential for maintaining pluripotency in stem cells.
Results: We show that loss of Hmgn1 or Hmgn2 in pluripotent embryonal carcinoma cells leads to increased levels of spontaneous neuronal differentiation. This is accompanied by the loss of pluripotency markers Nanog and Ssea1, and increased expression of the pro‑neural transcription factors Neurog1 and Ascl1. Neural stem cells derived from these Hmgn‑knockout lines also show increased spontaneous neuronal differentiation and Neurog1 expression. The loss of HMGN2 leads to a global reduction in H3K9 acetylation, and disrupts the profile of H3K4me3, H3K9ac, H3K27ac and H3K122ac at the Nanog and Oct4 loci. At endodermal/mesodermal genes, Hmgn2‑knockout cells show a switch from a bivalent to a repressive chromatin configuration. However, at neuronal lineage genes whose expression is increased, no epigenetic changes are observed and their bivalent states are retained following the loss of HMGN2.
Conclusions: We conclude that HMGN1 and HMGN2 maintain the identity of pluripotent embryonal carcinoma cells by optimising the pluripotency transcription factor network and protecting the cells from precocious differentiation. Our evidence suggests that HMGN2 regulates active and bivalent genes by promoting an epigenetic landscape of active histone modifications at promoters and enhancers.
Keywords: HMGN, Chromatin, Epigenetics, Stem cells, Embryonal carcinoma cells, Differentiation, Neuronal
© The Author(s) 2019. This article is licensed under a Creative Commons Attribution 4.0 International License, which permits use, sharing, adaptation, distribution and reproduction in any medium or format, as long as you give appropriate credit to the original author(s) and the source, provide a link to the Creative Commons licence, and indicate if changes were made. The images or other third party material in this article are included in the article’s Creative Commons licence, unless indicated otherwise in a credit line to the material. If material is not included in the article’s Creative Commons licence and your intended use is not permitted by statutory regulation or exceeds the permitted use, you will need to obtain permission directly from the copyright holder. To view a copy of this licence, visit http://crea‑ tivecommons.org/licenses/by/4.0/. The Creative Commons Public Domain Dedication waiver (http://creativecommons.org/publicdo‑ main/zero/1.0/) applies to the data made available in this article, unless otherwise stated in a credit line to the data.
Background
The chromatin landscape of embryonic stem cells has dis-tinct characteristics that are believed to confer increased plasticity and thus contribute to the maintenance of the pluripotent state [1]. Plasticity is achieved through
a range of mechanisms, including bivalent epigenetic states [2], more numerous DNaseI-hypersensitive sites [3], increased levels of active transcriptional marks, fewer and less condensed heterochromatin loci, and hyperdy-namic binding of major architectural proteins such as the linker histones [4].
HMGN (high mobility group nucleosome binding) family members are chromatin architectural proteins that influence local and global chromatin structure, and have wide ranging effects on gene expression [5]. They are devoid of enzymatic activity, and bind to the nucleosome
Open Access
*Correspondence: [email protected]
†Sylvia Garza‑Manero and Abdulmajeed Abdulghani A. Sindi should be regarded as joint first authors
or core particle of chromatin without specificity for the underlying DNA sequence. The two most abundant and well-studied HMGN isoforms are HMGN1 and HMGN2. The five HMGN family members share a general struc-ture, consisting of a conserved positively charged nucleo-some-binding domain (NBD) that specifically targets the nucleosome and constitutes the hallmark of the family, a bipartite nuclear localisation signal, and a variable nega-tively charged C-terminal or regulatory domain (RD) [6].
HMGN proteins have been shown to modulate chro-matin structure in a variety of ways. They can alter the ability of histone acetyl-transferases and kinases to mod-ify core histone N-terminal tails [7–9] and have been shown to inhibit the activity of chromatin remodelling complexes [10]. They also inhibit the interaction of linker histones with chromatin, which can lead to decompac-tion and reduced EZH2-mediated methyladecompac-tion of histone H3K27 [11, 12]. They have also been shown to increase the recruitment of certain transcription factors to chro-matin [13].
Chromatin immunoprecipitation studies from several labs have shown that HMGN proteins do not tend to be highly enriched at individual genes [9, 14–16]. This is consistent with observations that HMGNs do not have any specificity for the underlying DNA sequence, and that their binding to chromatin is transient and dynamic, and with continuous exchange from one nucleosome to another [17]. However, ChIP-seq studies by the Bustin lab using different antibodies have shown that HMGN1 and HMGN2 are enriched at DNase I hypersensitivity sites (DHSs) in several mammalian cell lines [3, 18–20]. DHSs constitute chromatin-accessible domains located at transcriptional regulatory regions, such as promoters and enhancers, and are considered to be a hallmark of genes poised or activated for transcription. Cells lacking both HMGN1 and HMGN2 exhibit a reduction in the number and the intensity of the DHSs in mouse embryonic fibro-blasts and mouse embryonic stem cells (ESCs) [19, 20].
The generation of Hmgn variant-specific knock-out mice in the last decade has provided considerable insights into the relevance of these proteins at the cel-lular and organismal level. In general, these mice are viable and do not present strong phenotypes. Never-theless, variant-specific phenotypic alterations have been reported. For example, Hmgn1−/− mice exhibit
increased tumorigenicity and impaired DNA damage response [21], whereas Hmgn2−/− mice show some
alterations in energy metabolism [19]. Analyses of tran-scriptional changes in cells and tissues derived from the genetically modified mice indicate that the absence of one or two Hmgn variants does not dramatically modify the pre-existing transcriptional profile [3, 12, 19, 20]. However, there are significant changes in the levels of
many mRNA transcripts, which indicate that the gen-eral process of transcription is altered, and accounts for the Hmgn knockout mouse phenotypes mentioned above. These experiments led to the working hypothe-sis that the HMGN proteins fine-tune an already estab-lished expression profile, and ensure the appropriate cellular response to external and internal cues.
During development, HMGN1 and HMGN2 are highly abundant in embryonic tissues, and then are progressively downregulated as differentiation pro-ceeds, remaining at lower levels in fully differenti-ated tissues [22]. This decreasing expression pattern has been observed during erythropoiesis, myogenesis, and chondrogenesis, and seems to be essential, since HMGN1 overexpression inhibits normal cellular dif-ferentiation [15, 23, 24]. Although fully differentiated cells have lost substantial amounts of HMGN proteins, many tissue-specific stem cells and transient amplifying precursors retain high levels of these proteins [22, 25].
In the adult mouse brain, Hmgn1 and Hmgn2 mRNAs are highly expressed in the dentate gyrus of the adult hippocampus [3], which is a well-characterised neu-rogenic niche where neural stem cells (NSCs) reside and undergo active neurogenesis. A role for HMGN proteins in NSCs is supported by the observation that adult Hmgn1−/− mice exhibit a reduction in
nestin-pos-itive NSCs in the sub-ventricular zone [3]. Moreover, HMGN proteins are required for proper differentiation of NSCs into astrocytes and oligodendrocytes, since Hmgn knockdown interferes with the neuron-to-glia transition, and the lack of both HMGN1 and HMGN2 leads to downregulation of OLIG1 and OLIG2 with defects in oligogenesis [12, 26]. Defects in neural stem cell differentiation could also be a contributing factor to the neurological defects observed in Hmgn1−/− and
double knockout Hmgn1−/−Hmgn2−/− mice [12, 27].
Together these data suggest a role for HMGN proteins in tissue-specific stem cell biology and differentiation, especially among the neural lineage.
carcinoma cells, and thus help to maintain self-renewal and prevent inappropriate differentiation of these pluri-potent stem cells.
Results
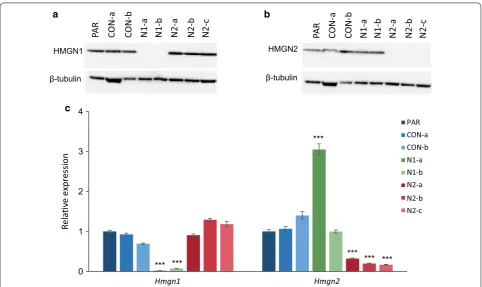
Generation of Hmgn2 and Hmgn2 knockout cell lines CRISPR mutagenesis [32] was used to create clonal derivatives of murine P19 embryonal carcinoma cells in which HMGN1 or HMGN2 protein expression was abol-ished (Additional file 1: Figure S1). Two independent lines show complete loss of HMGN1 expression: N1-a and N1-b (Fig. 1a). Control line CON-b went through the same process but Hmgn1 was not targeted and no loss of HMGN1 protein is observed. Three independent lines show complete loss of HMGN2 protein expression: N2-a, N2-b and N2-c (Fig. 1b). Control line CON-a was gen-erated at the same time, but has no mutagenesis of the Hmgn2 alleles.
Immunofluorescence confirmed the loss of HMGN1 and HMGN2 protein in all cells in their respective knockout lines (Additional file 1: Figure S2). Quantitative RT-PCR revealed that Hmgn1 and Hmgn2 transcript levels are sig-nificantly reduced in the knock-out cell lines, indicative of either a change in splicing preferences and/or a reduc-tion in transcript stability (Fig. 1c). The level of the Hmgn2
transcript is increased by threefold in the Hmgn1 mutant line N1a (Fig. 1c), but no corresponding increase in HMGN2 protein is observed (Fig. 1b). No other reciprocal changes in HMGN1 or HMGN2 expression were observed in the other knockout or control lines (Fig. 1a–c).
Hmgn knockout cells have reduced expression of pluripotency markers
P19 cells have lost the capacity to spontaneously differ-entiate, despite their teratocarcinoma origin, and can be propagated indefinitely in serum-containing medium as mostly pure cultures of undifferentiated cells. Parental P19 cells are morphologically homogeneous and grow as discrete colonies. We observed that the loss of HMGN1 or HMGN2 expression considerably alters the cellular morphology and organisation of P19 cultures (Additional file 1: Figure S3). Fewer discrete colonies are observed, with a high proportion of Hmgn-knockout cells grow-ing outside of normal colony boundaries. Many of these cells exhibit an extended cytoplasm and resemble dif-ferentiated cells; in particular, some cells have long thin processes that connect with other cells (Additional file 1: Figure S3, red arrows).
We hypothesised that these changes in cell morphol-ogy in the Hmgn knockout populations could reflect an
β-tubulin HMGN2
CO
N-a
CO
N
-b
N1-a N1-b N2-a N2-b N2-c
PA
R
β-tubulin HMGN1
CO
N-a
CO
N-b
N1-a N1-b N2-a N2-b N2-c
PA
R
0 1 2 3 4
Hmgn1 Hmgn2
Re
lav
e expression
*** ***
***
*** *** ***
CON-a CON-b N1-a N1-b N2-a N2-b N2-c PAR
a b
c
Fig. 1 Generation of Hmgn1 and Hmgn2 knockout P19 lines. Western blot analysis of a HMGN1 and b HMGN2 protein levels in clonal P19 lines;
β‑tubulin is shown as a loading control. cHmgn1 and Hmgn2 mRNA expression as determined by qRT‑PCR in control and Hmgn‑knockout cells. The
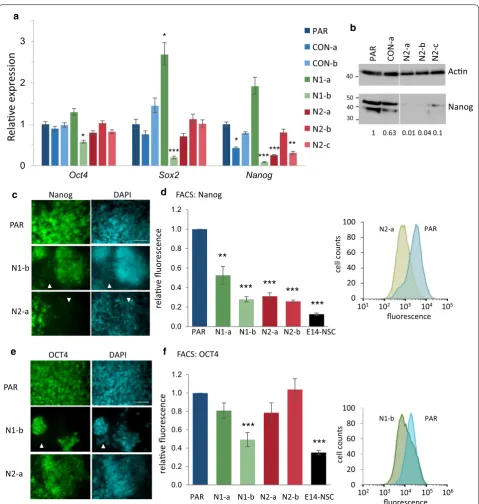
increased propensity to differentiate. In order to inves-tigate this further, the expression of self-renewal mark-ers was assayed by immunofluorescence and qRT-PCR. The core pluripotency transcription factor Nanog is highly expressed in naïve pluripotent cells and is down-regulated upon lineage-priming [29, 30]. In the Hmgn knockout lines N1-b, N2-a and N2-c, Nanog mRNA expression is reduced by 3- to 10-fold relative to paren-tal P19 cells (Fig. 2a). A reduction in Nanog protein in all the Hmgn2-knockout lines is also observed by west-ern blotting (Fig. 2b). Immunofluorescence microscopy revealed that Nanog protein expression is reduced in most cells in all the Hmgn1 and Hmgn2-knockout cul-tures, even in the N1-a and N2-b lines where Nanog mRNA levels are not significantly reduced (Fig. 2c and Additional file 1: Figure S4a). The control line CON-a shows a 50% reduction in Nanog mRNA (p < 0.05) and a 37% reduction in Nanog protein by western blotting, although no obvious differences are apparent by immu-nofluorescence. The levels of Nanog protein are hetero-geneous, particularly within the knockout lines, which is in agreement with previous reports suggesting that heterogeneity in Nanog production is related to diverse differentiation potentials among a polypopulation of pluripotent cells [33]. A reduction in Nanog protein levels in the knockout lines was confirmed using FACS, which revealed a significant decrease of 50% or more in the median level of Nanog protein production in all four Hmgn1 and Hmgn2-knockout lines tested (Fig. 2d).
Stage-specific embryonic antigen 1 (SSEA1) plays a role in cell adhesion and migration in the pre-implan-tation embryo and is widely used as a pluripotency marker in mouse ESCs, and is also expressed in embry-onal carcinoma cells, including P19 cells [34]. Immuno-fluorescence microscopy reveals a reduction in SSEA1 in both Hmgn1 and Hmgn2-knockout cells, and quan-tification by FACS indicates a reduction of 39–65% in SSEA1 protein levels in the knockout lines (Additional file 1: Figure S4c and d).
OCT4 is a transcription factor that is highly expressed in undifferentiated pluripotent stem cells. It has also been shown to be retained in the first stages of ESC dif-ferentiation [35]. Oct4 mRNA levels are similar across all the Hmgn knockout lines except N1-b, in which it is decreased by 40% (Fig. 2a). This is consistent with immu-nofluorescence data (Fig. 2e and Additional file 1: Fig-ure S4b). In the parental cells and in most of the Hmgn knockout lines, OCT4 is homogeneously distributed and most of the cells show equivalent fluorescence intensity (Fig. 2e and Additional file 1: Figure S4b). However, some cells growing outwith colony boundaries are completely devoid of OCT4, especially in N1-b cultures (Additional file 1: Figure S4b, arrow heads). FACS analysis shows that
median OCT4 expression is unchanged in most of the Hmgn knockout lines, but is reduced by 50% in the N1-b line (Fig. 2f).
Sox2 has a similar expression pattern to Oct4 in the different pluripotency states and during early ESC dif-ferentiation [35], and is also expressed in neural stem cells. Sox2 mRNA expression is not altered in the Hmgn2 knockout lines, although its expression is increased in N1-a cells and decreased in N1-b cells (Fig. 2a).
In summary, a reduction in Nanog and SSEA1 protein levels is observed across all the Hmgn knockout lines, whereas OCT4 and Sox2 expression is not consistently affected. This data suggests that the maintenance of self-renewal and pluripotency may be compromised in Hmgn-knockout cultures.
Hmgn knockout cells show increased spontaneous neuronal differentiation
To investigate whether Hmgn knockout cells display a loss of pluripotency, the cultures were examined for evi-dence of spontaneous differentiation down neuronal and endodermal/mesodermal pathways. βIII tubulin immu-nostaining was performed to detect differentiation down the neuronal lineage (Fig. 3a). Strikingly, 24 h after seed-ing the cells at low density, all five Hmgn knockout lines show increased formation of βIII tubulin-positive cells with extended processes, a phenotype that is typical of immature neuronal cells. This contrasts strongly with the low frequency of βIII tubulin-positive cells that are typi-cally observed in the control cultures (Fig. 3a). At 48 h after seeding, extensive networks of neurites are visible in lines N1-a, N2-a, N2-b and N2-c (Fig. 3a). FACS was used to quantify the percentage of cells that are positive for βIII tubulin, and the data show that N1-a, N2-a and N2-b lines have significant increases in the percentage of βIII tubulin-positive cells (Fig. 3b, c).
Consistent with the observed changes in protein expression and cell morphology, βIII tubulin mRNA lev-els show a small increase in N1-a, N2-b and N2-c cells, and expression of Map2, another neuronal cytoskeletal protein, is increased by 3- to 11-fold in several knockout lines (Fig. 3d).
0 1 2 3
Oct4 Sox2 Nanog
Re
lav
e expression
B1 C2 N1-1 D3Δ B8Δ B19Δ B38Δ *
*
*** * ****** **
CON-a CON-b N1-a N1-b N2-a N2-b N2-c PAR
relave
fluorescenc
e
FACS: Nanog
Nanog DAPI
N2-a PAR
N1-b
DAPI OCT4
relave
fluorescenc
e
FACS: OCT4
PAR N1-b
0 20 40 60 80 100
cell count
s
fluorescence 103 104 105 106 102
N2-a
cell count
s
0 20 40 60 80 100
102 103 104 105 101
PAR
fluorescence 0.0
0.2 0.4 0.6 0.8 1.0 1.2
*** *** ***
**
***
PAR N1-a N1-b N2-a N2-b E14-NSC
0.0 0.2 0.4 0.6 0.8 1.0 1.2
***
***
PAR N1-a N1-b N2-a N2-b E14-NSC
40 50
30
40 Acn
Nanog PAR CON
-a
N2-a N2-b N2-c
1 0.63 0.01 0.04 0.1
N2-a PAR
N1-b a
b
c d
e f
Fig. 2 Expression of pluripotency markers in Hmgn knockout cells. a Relative expression of the pluripotency transcription factors Oct4, Sox2, and Nanog as determined by qRT‑PCR. The graphs show the fold change relative to parental P19 cells (n= 3–10) (*p < 0.05, **p < 0.01, ***p < 0.001). b Western blot analysis of Nanog protein levels in whole cell extracts from parental P19, CON‑a, N2‑a, N2‑b and N2‑c cells. For both Actin and Nanog, all samples were run on the same gel and exposed at the same time. Actin is shown as a loading control. The relative ratios of Nanog to Actin,
averaged from two replicate blots, are shown below. Immunofluorescence analysis of Nanog (c) and OCT4 (e) expression. Parental, N1‑a and N2‑a
cells were fixed 24 h after seeding. DAPI was used to stain the nuclei (cyan). Scale bar indicates 50 µm. Nanog levels are heterogeneous, and cells
with reduced expression are indicated by arrow heads. Images from all lines are shown in Additional file 1: Figure S4. FACS analysis of Nanog (d)
and OCT4 (f) expression. E14‑NSCs are the negative control. The bar graphs represent the relative fluorescence intensity (median) of each cell line,
n= 3 (*p < 0.05, **p < 0.001, ***p < 0.0001). The cell count plots are representative examples to illustrate the distribution of the data for parental and
increase of 75% in Nestin expression in two of the knock-out lines, N1-a and N2-a (Additional file 1: Figure S5c).
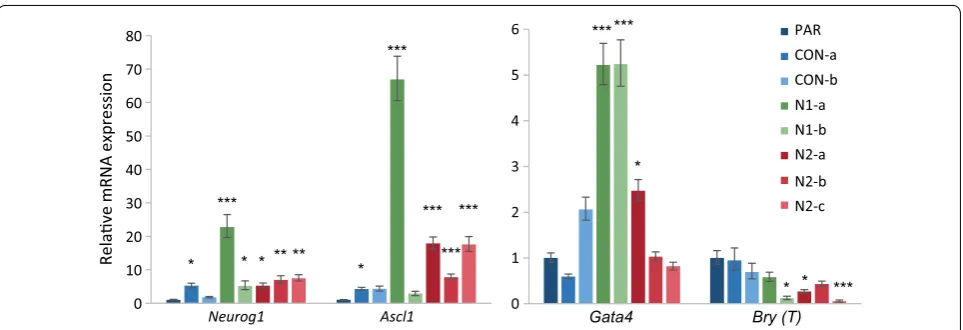
βIII tubulin, Nestin and MAP2 are structural proteins whose expression indicates differentiation down the neu-ral lineage. To investigate the regulation of this process, expression of the pro-neural transcription factors Neu-rog1 and Ascl1 [37] were studied. Consistent with the increased spontaneous neuronal differentiation, Neurog1 and Ascl1 are upregulated in most of the Hmgn-knockout lines when compared with parental cells (Fig. 4). Neurog1 transcription is increased by 5- to 25-fold in Hmgn1- and Hmgn2-knockout lines, and Ascl1 is increased by 8- to 18-fold in Hmgn2-knockout cells and 67-fold in N1-a cells when compared with the parental cells (Fig. 4). We propose that increased expression of Neurog1 and Ascl1 drives the spontaneous differentiation of βIII tubulin-positive neuronal cells in Hmgn knockout cultures.
P19 cells can be differentiated down the mesodermal lineage into cardiomyocytes in the presence of DMSO or other inducers [38]. To test whether Hmgn -knock-out cells spontaneously differentiate down this lineage, Gata4 and Brachyury (Bry or T) expression was ana-lysed. Gata4 and Brachyury are typically regarded as mesodermal and/or endodermal markers. In differen-tiating P19 cells, Brachyury is an early marker of mes-odermal differentiation, whereas Gata4 is expressed slightly later, in cardiomyoblasts, where it regulates cardiomyocyte differentiation [39]. We find that Gata4 transcript levels are increased by around fivefold in the Hmgn1 knockout lines N1-a and N1-b, but are only increased by 2.5-fold in one of the Hmgn2 knock-out lines, N2-a (Fig. 4). Immunofluorescence reveals very few GATA4-positive cells across all the con-trol and Hmgn knockout cell lines, with slightly more observed in line N1-b (Additional file 1: Figure S5b, arrows). Quantification by FACS shows that the median GATA4 expression is not significantly increased in the Hmgn knockout lines (Additional file 1: Figure S5d). Conversely, Brachyury transcript levels are decreased in three of the Hmgn knockout cell lines (N1-b, N2-a and N2-c) (Fig. 4). Brachyury protein was undetect-able by immunofluorescence. Although the increase in
Gata4 mRNA expression might indicate initiation of cardiogenesis, this is not consistent with the reduction in Brachyury expression. These data are more consist-ent with some loss of control of gene regulation in the Hmgn1 knockout cells.
The timing of differentiation is regulated by tran-scriptional switches that are driven by intrinsic or extrinsic signals. In order to test whether FGF, WNT or Notch signalling is altered in Hmgn2 knockout cells, we analysed the expression of a range of genes in the presence and absence of signalling pathway inhibitors (Additional file 1: Figure S6). The data do not support a role for these pathways in promoting differentiation after the loss of Hmgn2, so we propose that the initia-tion of differentiainitia-tion in the Hmgn2 knockout cells fol-lows an intrinsic and cell-autonomous programme.
In order to investigate whether Hmgn knockout cells show an increased propensity to differentiate into neu-rons following extrinsic induction stimuli, a well-estab-lished P19 neuronal induction protocol that utilises retinoic acid and FGF8 was followed [40] (Additional file 1: Figures S7 and S8). No significant differences in the induction of Neurog1, Ascl1 or Nestin are observed between control and knockout cells during differen-tiation, nor are there differences in the repression of Nanog (Additional file 1: Figures S7 and S8). Both con-trol and knockout cells form complex networks of neu-rites by day 4, and immunofluorescence for βIII tubulin did not reveal any significant differences in the level of marker expression or cell morphology (Additional file 1: Figure S7b). These results indicate that most of the Hmgn-knockout cells respond normally to neuronal induction cues, and are capable of generating neuronal cells with similar timing and efficiency to the parental and control lines.
Taken together, these analyses show that the loss of either Hmgn1 or Hmgn2 disrupts the gene expression profile of pluripotent embryonal carcinoma cells, com-promising the fidelity of self-renewal and leading to the spontaneous initiation of differentiation programmes that are mainly, but not exclusively, towards neural lineages.
(See figure on next page.)
Fig. 3 Hmgn knockout cells show increased levels of spontaneous neuronal differentiation. a Immunofluorescence analysis of the neurofilament
protein βIII‑tubulin (red). Control and Hmgn‑knockout cells were fixed 24 h and 48 h after seeding. CON‑b cells adhere weakly to slides after 48 h,
so no immunofluorescence data are available for this time point. DAPI was used to stain the nuclei (cyan). Scale bar indicates 50 µm. FACS analysis
of βIII tubulin expression. b Example dot plots show the distribution of 10,000 cells and the gate that delineates βIII tubulin‑positive cells. The
percentage of βIII tubulin‑positive cells is shown. c Percentage of βIII tubulin‑positive cells in each cell line, as determined by FACS (n= 3) (*p < 0.05,
**p < 0.001, ***p < 0.0001). E14‑NSCs are a negative control. d Relative mRNA expression of the neural‑specific markers Nestin, βIII‑tubulin and
Map2 (no data available for βIII tubulin expression in CON‑b cells). The graphs show the fold change relative to parental cells (n= 3–10) (*p < 0.05,
Loss of Hmgn1 or Hmgn2 affects the profile of active histone modifications
We hypothesised that HMGN proteins regulate the expression of Nanog, Neurog1, Ascl1, Gata4 and
Brachyury by modulating their epigenetic profiles. Exam-ination of publicly available ChIP-seq data from mouse ES cells shows that the highly expressed Nanog and Oct4 genes have high levels of the active mark H3K4me3 in the
0.0 0.5 1.0 1.5 2.0
***
*
CON-a
N1-a
N1-b
N2-a
N2-b PAR
N2-c
24 hr
DAPI βIII tub DAPI βIII tub
***
bIII
Tu
b+
cells
(%)
1.0
FSC
(M)
0.8 0.6 0.4 0.2
102 104 106 108
0
0.44%
Parental
III tubulin: A594 III tubulin: A594 1.0
0.8 0.6 0.4 0.2
102 104 106 108
0
2.11%
N2-b
48 hrPAR N1-a N1-b N2-a N2-b E14-NSC
0 2 4 6 8 10 12
Relave
mRNA
expression
* ***
*
* *
* *
***
* **
CON-CON-b N1-a
a
N1-b N2-a N2-b N2-c PAR
N.D.
0 1 2 3
0 2 4 6 8 10 12
Nesn
III tubulin
Map2
*
* *
CON-b
β β
β
a
b
c
vicinity of their transcription start sites (TSS), and neg-ligible levels of the repressive mark H3K27me3 (Fig. 5c, Additional file 1: Figure S9, and data not shown). Nota-bly, Neurog1, Ascl1, Gata4 and Brachyury have moder-ate levels of H3K4me3, but also have substantial levels of H3K27me3. This “bivalent” pattern is typical of poised stem cell genes with low levels of expression, which can be upregulated or silenced as the stem cells differentiate [2].
To investigate whether HMGN1 or HMGN2 bind pref-erentially to the promoters of these genes, chromatin immunoprecipitation followed by qPCR was performed. Binding at the Oct4 and Nanog gene loci was assayed using several primer sets that encompass 2–3 kb sur-rounding the TSS. Single primer sets for Neurog1, Ascl1, and Bry target the peak of H3K4me3 nearest the TSS of each gene (Fig. 5c and Additional file 1: Figure S9).
The ChIP data shows that HMGN1 and HMGN2 are bound at all the active and poised genes tested. Occu-pancy varies by less than twofold between different genes, with around 50% higher occupancy at the Nanog gene locus (p < 0.001) (Fig. 5a, b). In the Hmgn1 knock-out lines, HMGN1 signals are reduced by 80% and 95%
in the N1-a and N1-b lines, respectively. Conversely, HMGN2 signals are reduced by 80% on average in the Hmgn2 knockout lines, N2-a, N2-b and N2-c. These data confirm the specificity of the HMGN1 and HMGN2 ChIP assays, and show that these proteins occupy the regulatory regions of both active pluripotency genes and poised/bivalent lineage-specific genes in undifferentiated P19 cells.
In order to investigate whether HMGN2 binding is particularly enriched at these TSS regions compared to other regions of the genome, ChIP-seq was performed in both undifferentiated P19 cells and in P19 cells after 3 days of induced neuronal differentiation (Fig. 5c and Additional file 1: Figure S9). The active marks H3K27ac and H3K4me1 were also mapped in order to validate the ChIP assay and illustrate the chromatin landscape of undifferentiated and day 3 neuronal P19 populations (Additional file 1: Figure S9). For example, H3K27ac is enriched upstream of the Oct4 gene in undifferentiated cells, but this is lost in the day 3 neuronal cells when Oct4 is repressed. Conversely, H3K27ac is absent from the Ascl1 locus in undifferentiated cells, but increased in the day 3 neuronal cells when the gene is expressed.
0 1 2 3 4 5 6
Gata4 Bry (T)
* ***
* * *** ***
0 10 20 30 40 50 60 70 80
Relave
mRNA expression
* *
***
* ** *
***
*** ***
** ***
Neurog1 Ascl1
CON-a CON-b N1-a N1-b N2-a N2-b N2-c PAR
Fig. 4 Hmgn knockout cells have increased expression of pro‑neural transcription factors. Relative mRNA expression of the proneural
lineage‑specific transcription factors Neurog1 and Ascl1, and the endodermal/mesodermal markers Gata4 and Bry (T). The graphs show the fold
change relative to parental cells (n= 3–10) (*p < 0.05, **p < 0.01, ***p < 0.001)
(See figure on next page.)
Fig. 5 HMGN1 and HMGN2 are not highly enriched at active gene promoters. ChIP‑PCR assays in control and knockout cell lines. Enrichment of
HMGN1 (a) or HMGN2 (b) at each primer set was normalised to the average H3 signal from all primer sets. The graphs present the mean and sd
of technical qPCR triplicates from the same IP reaction. Data are representative of 2–3 independent biological replicates. c ChIP‑seq for HMGN2
and H3 was performed in undifferentiated and day 3 neuronal induced P19 cells. Reads were aligned to the mm9 mouse genome and regions
surrounding the Nanog and Neurog1 loci are shown. Peaks revealed by MACS peak calling software for HMGN2 and H3 are shown as red blocks
below the relevant signal track. Positions of the primer sets used for ChIP are indicated. Data for H3K4me3 and H3K27me3 in mouse ES Bruce4 cells
was obtained from the UCSC genome browser (http://genom e.ucsc.edu; accessions wgEncodeEM001682 and wgEncodeEM002709) [50, 51]. Y‑axis
maxima are 0.62 for all H3 and HMGN2 tracks, 21 for H3K4me3 and 3.5 for H3K27me3. Similar data for the regions surrounding the Oct4 and Ascl1
0 0.5 1 1.5 2 2.5 3 3.5
Neurog1 Ascl1 Gata4 Bry Oct4-b Oct4-c Nanog-a Nanog-b Nanog-c Nanog-d
PAR CON-a CON-b N1-a N1-b N2-a N2-b N2-c
HMGN
1
/H
3
HMGN2/H3
Neurog1 Nanog
Chr 13
56,345,782 56,359,277
10 kb Chr 6
122,641,878 122,669,168
10 kb
HMGN2, undiff
H3, undiff HMGN2, day 3
H3, day 3
ChIP primers a b dc
transcripts
ES, H3K27me3 ES, H3K4me3
0 0.5 1 1.5 2
Neurog1 Ascl1 Gata4 Bry Oct4-b Oct4-c Nanog-a Nanog-b Nanog-c Nanog-d
PAR CON-a CON-b N1-a
N1-b N2-a N2-b N2-c a
b
The H3K27ac and H3K4me1 profiles for undifferenti-ated P19 cells correspond closely to publicly available datasets for undifferentiated mouse ES cells (Additional file 1: Figure S9).
The HMGN2 ChIP-seq binding profiles indicate that HMGN2 is not more highly enriched at active gene promoters, either in undifferentiated or day 3 neuronal cells, but instead is found at similar levels throughout the genome (Fig. 5c and Additional file 1: Figure S9). In general, the profile of HMGN2 binding tends to follow that of H3 (Additional file 1: Figure S10). Peak calling software identified 1862 HMGN2 peaks in undifferen-tiated cells. For example, there is a HMGN2 peak in the Nanog promoter in undifferentiated cells (Fig. 5c). However, only 8% of these HMGN2 peaks overlap with TSSs or putative enhancers (Additional file 1: Figure S10).
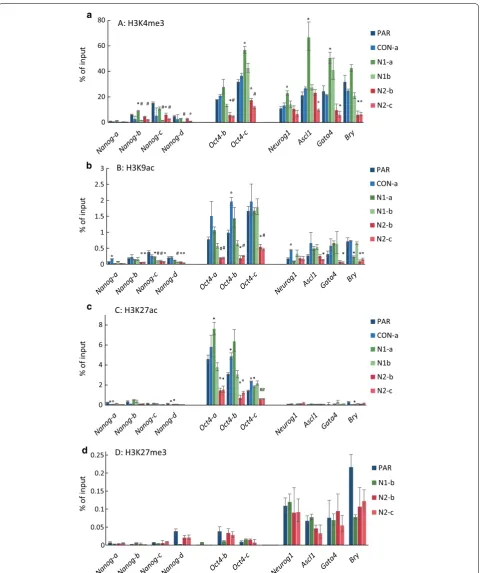
In order to investigate whether loss of HMGN1 or HMGN2 affects histone modifications at gene promoters, ChIP-PCR was performed in undifferentiated control and knockout cells (Fig. 6 and Additional file 1: Figure S11). At the Nanog gene, knockout of Hmgn2 lead to a loss of the active marks H3K4me3 and H3K9ac, consistent with the reduction in Nanog expression in these cells (Fig. 2). Active marks were also reduced in N1-b cells, which have reduced Nanog mRNA expression, but not in N1-a cells, where Nanog mRNA expression is not reduced.
Unlike the Nanog gene locus, the Oct4 promoter is enriched in the enhancer marks H3K27ac and H3K122ac, as well as in H3K4me3 and H3K9ac. Strikingly, all four of these active marks are reduced in both the Hmgn2 knock-out lines tested (Fig. 6 and Additional file 1: Figure S11). However, they are unchanged or in some cases increased in the Hmgn1 knockout lines. This is inconsistent with the expression data, where Oct4 expression is unchanged in Hmgn2 knockouts, but reduced by 40% in N1-b cells.
Reductions in the active marks H3K4me3 and H3K9ac are observed at several of the bivalent gene promoters in Hmgn2-knockout lines, indicating a switch from the biva-lent state to a more repressive chromatin configuration. These reductions do not always correlate with changes in gene expression (Fig. 6a, b). For example, H3K4me3 and H3K9ac are reduced at Ascl1 in N2-c cells, even though Ascl1 expression is increased by 17-fold in these cells (Fig. 4). Furthermore, H3K4me3 and H3K9ac are reduced at the Brachyury locus in both N2-b and N2-c cells, but expression of Brachyury is only significantly decreased in the N2-c line.
In contrast, the loss of Hmgn1 does not lead to a reduc-tion in active marks at the bivalent genes. Indeed, in N1-a cells, H3K4me3 levels are increased at Neurog1, Ascl1 and Gata4, correlating with the increase in expression of these three genes in N1-a cells (Fig. 4).
Enrichment of the repressive mark H3K27me3 at biva-lent gene promoters was not altered in any of the lines tested (Fig. 6d). Nor was there any increase in the level of histone H1 binding (Additional file 1: Figure S11c).
In order to extend the observations made at indi-vidual genomic locations, the global levels of several active histone modifications were investigated in Hmgn1 and Hmgn2 knockout cells by western blotting (Fig. 7). Consistent with the ChIP data, both the Hmgn2 knock-out lines tested show a reduction of over 60% in global H3K9ac levels. The largest reduction was observed with H3K27ac, which is reduced by over 74% in the N1-a, N2-a and N2-b knockout cells (Fig. 7).
In summary, it can be concluded that the loss HMGN2 leads to a reduction in active promoter and enhancer marks at most genes tested, irrespective of any changes in expression of these genes, and a global reduction in H3K9 acetylation. The effect of HMGN1 loss is less con-sistent between different knockout lines, and changes in active histone modifications are more likely to correlate with changes in gene expression.
Neural stem cells lacking HMGN1 or HMGN2 show loss of NSC self‑renewal
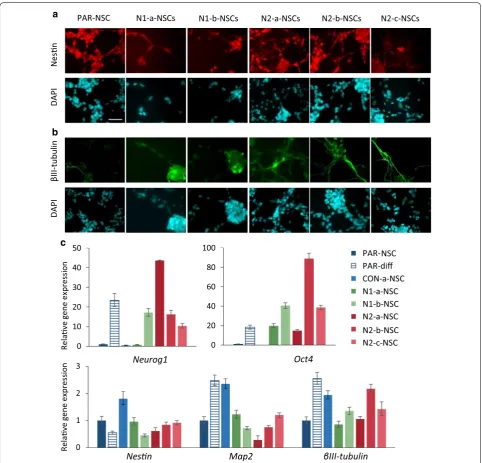
The data presented above shows that the loss of HMGN proteins compromises the self renewal and pluripotency of embryonal carcinoma pluripotent stem cells. To inves-tigate whether the properties of other types of stem cell are also compromised, we derived neural stem-like cells (NSCs) from the control and Hmgn-knockout P19 cul-tures [41]. NSCs derived from parental P19 cells can be maintained for many passages, express high levels of Nestin and have a bipolar morphology that is typical of NSCs (Fig. 8a, PAR-NSC). Parental P19 NSCs can also be differentiated into mixed cultures of neurons and glia upon removal of the growth factors EGF and FGF (e.g. Fig. 8c, PAR-diff columns).
Immunostaining of Hmgn-knockout NSC cultures does not reveal any substantial differences in Nestin expres-sion compared to the parental NSC cultures (Fig. 8a). However, higher numbers of βIII-tubulin-positive cells with extended processes are apparent in both Hmgn1- and Hmgn2-knockout cultures (Fig. 8b). At the mRNA level, neither Nestin nor βIII-tubulin expression is con-sistently altered in the Hmgn-knockout cells, which may indicate that βIII-tubulin protein production is regulated post-transcriptionally in these cells (Fig. 8c).
0 20 40 60 80
PAR CON-a N1-a N1b N2-b N2-c A: H3K4me3
% of inpu
t
*
# # # # #
# #
*
* *
*
*
0 0.05 0.1 0.15 0.2 0.25
PAR N1-b N2-b N2-c
D: H3K27me3
% of inpu
t
0 0.5 1 1.5 2 2.5
3 PAR
CON-a N1-a N1-b N2-b N2-c
B: H3K9ac
% of inpu
t
* # #
# # #
# #
* * * * **
0 2 4 6
8 PAR
CON-a N1-a N1b N2-b N2-c
C: H3K27ac
% of inpu
t
## *
* *
*
*
*
*
*
a
b
d c
Fig. 6 Hmgn2‑knockout cells show a reduction in active histone H3 modifications at bivalent and active gene loci. ChIP‑PCR assays in control and
knockout cell lines for H3K4me3 (a), H3K9ac (b), H3K27ac (c) and H3K27me3 (d). Data show the enrichment of each modification as a percentage
of input. Statistical significance between parental and experimental lines was determined using the Student’s T test, with Bonferroni correction for
23-fold increase observed when parental NSCs differ-entiate into neuronal cultures (NSC versus PAR-diff, Fig. 8c). Similarly, Oct4 expression is increased by 15- to 89-fold in all the Hmgn1- and Hmgn2-knockout NSCs compared to the control NSCs. This is compa-rable to the 18-fold increase in Oct4 expression that is observed when parental NSCs differentiate into neu-ronal cultures (Fig. 8c). However, expression of neu-ronal marker Map2 is not consistently altered in Hmgn knockout cultures compared to the parental and con-trol NSCs.
These data indicate that HMGN1 and HMGN2 play roles in maintaining the self-renewal of NSCs derived from P19 cells. The loss of either variant leads to spon-taneous neuronal differentiation, with increased Neurog1 expression and production of βIII-tubulin-positive cells.
Discussion
HMGN proteins regulate the self‑renewal of pluripotent and multipotent embryonal carcinoma cells
The results of the present work demonstrate that the loss of HMGN1 or HMGN2 compromises the ability of embryonal carcinoma cells, and the neural stem cells derived from them, to self-renew accurately and maintain pluri/multipotency. As a consequence, a proportion of the cells exit from the stem cell state and initiate differen-tiation programmes. A role for HMGN proteins in regu-lating stem cell identity is consistent with observations that they are highly expressed during development and in differentiating cells, but are downregulated in mature tissues [15, 22]. In particular, high HMGN expression has been observed in the neural stem/progenitor cells of the sub-ventricular zone of the mouse brain, and the transit-amplifying progenitor cells of hair follicle [3, 22, 25, 26]. Furthermore, downregulation of HMGN expression is
0% 25% 50% 75% 100%
0% 25% 50% 75% 100%
0% 25% 50% 75% 100%
H3K4me3
H3K9ac H3K27ac
* **
**
**
PA
R
CON-a
N1
-a
N1
-b
N2-a N2-b
H3 H3K9ac
H3K27ac H3K4me3
26
19 26
19 26 19
19
15
Modificaon/H
3
Modificaon/H
3
Modificaon/H
3
Fig. 7 Global reduction of histone acetylation in Hmgn‑knockout cells. Western blotting for the detection of H3K4me3, H3K9ac and H3K27ac. Acid histone extracts were prepared in duplicate from two different cell passages of each cell line and separated by SDS‑PAGE. Western blotting for each histone modification and sample set was performed twice or three times. Representative images are displayed (left). The H3 protein is indicated by an arrow, and additional bands on this blot are the results of non‑specific antibody interactions. The intensity for each modification was normalised
important for the differentiation of limb bud mesenchy-mal cells into chondrocytes in vitro [15, 24].
Here, we show that a high proportion of Hmgn1 and Hmgn2-knockout cells have reduced expression of the pluripotency markers SSEA1 and Nanog. Spontane-ous differentiation of Hmgn-knockout cells down the neural lineage is evidenced by βIII-tubulin immu-nostaining. Consistent with this, gene expression
analyses show increased Neurog1 and Ascl1 expres-sion in Hmgn1 and Hmgn2 knockout lines. It is impor-tant to note that there is some phenotypic variation between clonal lines, indicating that other factors can also influence the rate of spontaneous differentiation of these embryonal carcinoma cells. The predomi-nance of neuronal cells over other lineages is consist-ent with the default model of neural differconsist-entiation, 0
1 2 3
Nesn Map2 βIII-tubulin
Relave
gene expressio
n
0 10 20 30 40 50
Ngn1
DAPI
Nesn
βIII-tubulin
N2-a-NSCs N2-b-NSCs
DAPI
N1-a-NSCs N1-b-NSCs
PAR-NSC N2-c-NSCs
0 20 40 60 80 100
PAR-diff CON-a-NSC N1-a-NSC N1-b-NSC N2-a-NSC N2-b-NSC N2-c-NSC
Neurog1 Oct4
Relave
gene expressio
n PAR-NSC
a
b
c
Fig. 8 Neural stem cells derived from cells lacking Hmgn1 or Hmgn2 show loss of NSC identity. Immunostaining for a nestin and b βIII tubulin in
NSCs derived from parental P19 cells, Hmgn1 and Hmgn2 knockout lines. Scale bar indicates 50 µm. c Relative mRNA expression in NSCs derived
from parental P19 cells, CON‑a cells, and Hmgn1 and Hmgn2 knockout lines. Expression in parental NSCs that were induced to differentiate down
the neuronal lineage by removal of growth factors is also shown. Expression is normalised to that of Gpi1, and is plotted relative to that in parental
which proposes that pluripotent embryonic stem cells commit to neural fates unless instructed other-wise [42]. For example, ESCs start losing their identity upon withdrawal of the factors that maintain them in a pluripotent state, and they differentiate mostly into neural lineages [41]. NEUROG1 and ASCL1 are pow-erful pro-neural regulators whose overexpression can drive the neuronal differentiation of P19 cells and ES cells [43, 44]. We propose that these two transcription factors are key contributors to the spontaneous neu-ronal differentiation observed in the Hmgn-knockout cells.
Our observations appear to contrast with previ-ous work performed in mprevi-ouse ES cells derived from Hmgn1−/− and Hmgn1−/−n2−/− mice, where ES cell
pluripotency and self-renewal did not appear to be altered [3, 12]. It is unclear whether the differences are related to the transformed nature of the EC cells, or due to the growth media used, which may permit or restrict spontaneous differentiation depending on whether cells are cultured in the presence of serum or 2i inhibitors. It is also worth considering the different developmental stages from which ESCs and P19 cells were derived. ESCs capture the naïve state of pluri-potency from pre-implantation embryos, whereas epiblast stem cells represent a pluripotency state primed for differentiation [29–31]. If this is valid for transformed cells, P19 cells that were derived from post-implantation embryos can immediately commit to differentiation, whereas ESCs first need to exit the naïve pluripotency stage so that they may respond to inductive cues [30]. Therefore, HMGN proteins may not be relevant in the preservation of the naïve pluri-potency; rather, these chromatin architectural proteins may be important for keeping the primed cells unre-sponsive to misplaced inductive differentiation cues.
Analysis of derived neural stem/progenitor cells revealed that the loss of control of self-renewal is not restricted to pluripotent P19 cells, but is also apparent in multipotent P19-NSCs lacking Hmgn1 or Hmgn2. It has been previously demonstrated that Hmgn1−/− mice
have fewer Nestin-positive cells in the sub-ventricular region of the brain [3], which is consistent with the hypothesis that self-renewal is compromised in neu-ral stem/progenitor cells lacking HMGN1 or HMGN2. Our results complement a previous study that dem-onstrated a role for HMGN proteins in regulating the differentiation of neural stem/progenitor cells (NPCs) [26]. Overexpression of HMGN proteins in NPCs, both in vivo and in vitro, was shown to promote astro-cyte differentiation and inhibit neurogenesis, whereas knocking down Hmgn expression had the converse effect [26].
Hmgn proteins modulate the epigenetic landscape of EC cells
The binding of HMGN proteins to nucleosomes is known to be transient and dynamic [17]. Here, ChIP-seq shows HMGN2 is bound throughout the non-repetitive genome, and with no highly enriched peaks at transcription start sites or enhancers in pluripotent P19 cells and early neuronal cultures. Its binding profile is broadly similar to that of the core histone H3. Pre-vious studies have indicated that HMGN proteins are enriched at DHSs in some cell types but not in others, and we suggest that the use of different antibodies may account for the differences in binding profiles [3, 9, 12, 15, 16, 18–20]. HMGN post-translational modifica-tions, protein conformation or binding partners could differentially influence the affinities of the antibodies. More detailed ChIP-qPCR analysis in P19 cells con-firmed that both HMGN1 and HMGN2 are bound at the promoter regions of pluripotency-associated genes, bivalent endodermal/mesodermal lineage genes, and bivalent pro-neural genes.
Chromatin immunoprecipitation assays presented here show that the loss of HMGN2 significantly impacts the epigenetic landscape of P19 cells, leading to reductions in some histone modifications associated with promoter and enhancer activity. Epigenetic marks at both highly expressed, pluripotency-associated factors and at biva-lent, lineage-specific genes are reduced, although the extent of the changes and the impact on gene expression varies. There is not a consistent relationship between the changes in expression and the changes in histone modi-fications at individual genes, so we conclude that the reduction in active marks in Hmgn2-knockout cells is not simply a consequence of reduced transcription. The effect of the Hmgn1-knockout on epigenetic changes is less consistent between lines, and there is a stronger cor-relation between changes in active histone modifications and changes in gene expression. Global reductions in the levels of H3K9 and H3K27 acetylation indicate that epigenetic changes are likely to be found at other genes; however, genome-wide studies would be required to investigate this further.
Several previous studies have shown that HMGN pro-teins directly influence the levels of histone H3 modifica-tions. Specifically, HMGN1, HMGN2 and HMGN3a can stimulate the ability of PCAF to acetylate nucleosomal H3K14, with HMGN2 showing the greatest effect [6, 8, 9]. This activity is dependent on the C-terminal regula-tory domain, and kinetic and structural data reveal that interaction of the HMGN protein with the H3 N-termi-nal tail may make it a better substrate for histone acetyl-transferase activity [8, 11]. Conversely, HMGN proteins have been shown to inhibit phosphorylation of H3 at ser-ine 10 and serser-ine 28 [6, 7]. Further investigation is needed to determine whether HMGN proteins can also influence the deposition or removal of H3K4 methylation directly.
We conclude that the loss of HMGN2 leads to a wide-spread changes in the levels of active modifications at his-tone H3. It is not possible to distinguish between a direct effect of HMGN proteins on the chromatin structure of these genes, and an indirect effect mediated through the expression of other chromatin modifiers; indeed, it is likely that several mechanisms are involved. It is also worth noting that the presence of sequence-specific tran-scription activators or repressors may override the effect of changes in histone modifications on the expression of individual genes. Further work is required to determine whether other features such as nucleosome positioning, histone variant deposition or transcription factor recruit-ment are altered in the Hmgn knockout cells and could affect the transcriptional profile and cellular phenotype [10, 13, 14].
Conclusion
We conclude that HMGN1 and HMGN2 maintain P19 cell identity by optimising the pluripotency transcription factor network and protecting the cells from precocious differentiation. We propose that HMGN2 accomplishes this promoting an epigenetic landscape of active histone modifications at promoters and enhancers. Interestingly, a recent paper from Bustin and co-workers shows that the binding of HMGN proteins to cell type-specific enhanc-ers stabilises cell identity [45]. The authors observed that loss of HMGNs enhances the rate of reprogramming of mouse embryonic fibroblasts into induced pluripotent stem cells following the ectopic expression of POU5F1, SOX2, KLF4, and MYC [45]. Beyond the relevance for cellular reprogramming, the paper demonstrates that HMGNs are required to maintain a chromatin organisa-tion that responds appropriately to biological cues [45], which is consistent with our conclusions from the pre-sent work. The emerging picture is that HMGN proteins increase the threshold required for cells to respond to signalling events that induce different cellular fates. They do this by working together to promote an active histone
modification landscape and open chromatin conforma-tion at regulatory regions of cell type-specific genes, thus stabilising the transcriptional networks.
Materials and methods
Cell culture
Mouse embryonal carcinoma cell line, P19, was main-tained in advanced DMEM/F12 containing 10% NBCS and 1X GlutaMAX. Adherent neural induction was per-formed using the method of Nakayama et al. [40], which involved seeding cells onto laminin-coated culture dishes in neural induction media: DMEM/F12 containing sodium pyruvate and NEAA supplemented with 1 X N2 supplement, 200 mM l-glutamine, 500 nM retinoic acid, 10 ng/ml FGF8 and 10 µM DAPT.
To derive neural stem cells, the adherent neural induc-tion protocol was initiated, and after 3 days, cells were switched to gelatine-coated flasks in N2B27 medium containing 10 ng/ml FGF2 and 10 ng/ml EGF [41]. Cells were passaged eight times before being assayed for NSC characteristics. To differentiate the parental NSCs, cells were plated on laminin-coated dishes in N2B27 without FGF and EGF, and assayed after 4 days.
Neural stem cells derived from mouse ES cells (E14-NSCs) were used as controls for FACS, and were derived from E14 cells cultured in 2i media as previously described [41]. For differentiation into glia cells, E14-NSCs were seeded onto laminin coated wells in N2B27 media supplemented with 1% new born calf serum [46]. Medium was replaced every 2 days and harvested for analysis 1 week after growth factor deprivation.
CRISPR mutagenesis
with inactivating Hprt mutations, in order to enrich for cells in which active CRISPR-mediated mutagenesis had occurred. Lines lacking Hmgn1 expression were identi-fied as above. Lines N1-a and N1-b were independently derived from separate transfections. Control line CON-b went through the same process, but Hmgn1 was not tar-geted and no loss of HMGN1 protein is observed.
Gene expression analysis
RNA was purified using the Qiagen RNeasy kit with DNase treatment, and quality and quantity were checked by UV spectroscopy (Nanodrop). cDNA was synthesised from 300 ng RNA using Superscript III (Life Technolo-gies) and oligo dT primers, and 5% was used in qRT-PCR reactions with SYBR green Fast start universal master mix (Roche) on a Stratagene MxPro machine. Reaction conditions were 10 min 95 °C, then 40 cycles of 30 s at 95 °C, 1 min at 60 °C. All qRT-PCR and qPCR primer sets were designed to target non-repetitive regions and were checked for the formation of a single product, specific-ity, and lack of primer dimer formation. No-RT controls were performed for each RNA prep. Amplification effi-ciency was between 1.92 and 2 in all cases.
The housekeeping gene Gpi1 was used as the normal-iser in ΔΔCt calculations. qRT-PCR primers for Hmgn1 span the exon V–VI junction, and primers for Hmgn2 span the exon IV–V junction. Primer sequences and final reaction concentrations are listed in Additional file 2.
Western blotting
The HMGN1 and HMGN2 antibodies were raised in rabbit by Eurogentec against the C-terminal peptides NQSPASEEEKEAKSD and KTDQAQKAEGAGDAK, respectively, and affinity purified [9]. Western blotting of purified recombinant proteins indicates that these antibodies are specific to the HMGN isoform they were raised against, and this was confirmed using extracts from cells over- or under-expressing specific isoforms (not shown). Acid histone extracts were prepared by incubating cells in triton extraction solution (4.5 μg/ml triton X-100, 4 mM sodium butyrate and protease inhibi-tors in PBS) for 10 min at 4 °C, washing the cells in the same buffer, then incubating them in 0.2 M HCl for 3 h at 4 °C. Following centrifugation at 300 RFC at 4 °C for 10 min, the supernatant contains the extracted histones. Acid histone extracts were run on 15% SDS-PAGE gels, blotted onto PVDF and membranes probed with the rel-evant antibodies and HRP-conjugated secondary anti-bodies. The antigen–antibody reaction was detected with chemiluminescence using a CCD camera imaging system (LAS 3000 Fujifilm) and quantification was performed in Image J. No additional bands were observed other than those shown in the figures. The concentrations of all
antibodies used in each experiment are provided in Addi-tional file 2.
Immunofluorescence
Cells were fixed with 4% PFA for 30 min, permeabilised for 10 min with 0.1% PBS-triton X-100, washed with 20 mM PBS-glycine and blocked with 5% horse serum in 0.5% PBS-triton X-100. Primary antibodies from Abcam were against OCT4 (Ab19857), Nanog (Ab80892), SSEA1 (Ab16285), GATA4 (Ab84593), Nestin (Ab6142), βIII tubulin (Ab18207). Secondary antibodies were from Thermo Fisher Scientific (A21206, A11037, A11020). Images shown are representative of the whole slide.
FACS
Harvested cells were stained with zombie yellow (for dead cells) then fixed with 4% paraformaldehyde. For SSEA1 detection, cells were incubated with primary anti-body in 2% BSA–PBS. For other antibodies, cells were permeabilised and blocked for 15 min in FACS buffer (5% horse serum and 0.5% tween 20 in PBS) before being incubated with primary antibody in FACS buffer. Primary and secondary antibodies were the same as for immuno-fluorescence as described above. NSCs derived from E14 ES cells were utilised as a negative control for the detec-tion of pluripotency and endodermal markers. FACS analysis was carried using the Attune Focusing Cytom-eter (Applied Biosystems, Thermo Fisher Scientific). The yellow-stained cells were excluded from the data.
Statistical analysis
Statistical analysis was carried out using GraphPad Prism 7 software. Unless otherwise stated, the data show the mean and SEM from independent replicates, and sta-tistical significance between parental and experimental lines was determined by one-way analysis of variance (ANOVA) and Dunnett’s multiple comparison test. Adjusted p values are indicated in the figure legends.
Chromatin immunoprecipitation (ChIP)
the H3K4me3 peaks identified from the publically avail-able mouse ES cell data. Primer sequences and loca-tions relative to each transcription start site (TSS) are listed in Additional file 2. TSSs for the indicated genes were confirmed by comparison with hCAGE data from the FANTOM5 project [47]. PCR conditions were as described for qRT-PCR above.
For ChIP-seq, libraries were prepared with the NEB ultra DNA library prep kit and single-end sequenc-ing to 76-bp read length was carried out ussequenc-ing an Illu-mina Nextseq machine by the University of Glasgow Polyomics facility. ChIPs from undifferentiated cells were performed and sequenced in triplicate, whereas ChIPs from differentiated cells were from a single rep-licate. Between 36 and 52 million reads were obtained from each sample. Quality was checked using FastQC, and the median Phred score per base over all reads for each sample was greater than 30. Unfiltered reads from FASTQ files were aligned to reference genome NCBI build 37 mm9 using Bowtie [48]; reads aligning to more than three positions and duplicate reads were dis-carded. Aligned reads were 64–75% of the total. Non-immune IgG was used as a negative control, and yielded 29 M reads with 55% aligning. Statistically enriched regions compared to a background control (peak find-ing) were identified using MACS v1.4 [49] with param-eters p= 1e−3; bandwidth = 200; genome = mm9; fold enrichment = 10.30; and input control was used as a background. Putative enhancers were identified by overlapping peaks of H3K4me1 and H3K27ac from mouse ES Bruce4 cells (downloaded from the UCSC genome browser, accessions wgEncodeEM001682 and wgEncodeEM002709) [50, 51].
Supplementary information
Supplementary information accompanies this paper at https ://doi.
org/10.1186/s1307 2‑019‑0320‑7.
Additional file 1. Additional figures.
Additional file 2. Antibody dilutions, primer sequences and working concentrations.
Acknowledgements
We thank Narendra Kumar and Tony McBryan for assistance with the bioinfor‑ matic analysis, and we thank Faika Laz Banti and Martin Šrámek for additional lab work. Many thanks to all members of the KLW and AGW labs for their assistance, advice and support.
Authors’ contributions
GM and OR established the P19 system and demonstrated roles for Hmgn1/2. VHMJ created and established the CRISPR vector system. AAAS generated the
Hmgn2 KO lines and SGM, AAAS, MB and SS analysed them. FAL and MPW generated the Hmgn1 knockout lines and SGM, MPW and LF analysed them. RG analysed the ChIP‑seq data. KLW directed the project and AGW and KLW supervised the work in progress. SGM, AGW and KLW wrote the paper and all authors had input into the paper. All authors read and approved the final manuscript.
Funding
This work was supported by the Biotechnology and Biological Sciences Research Council [BB/J008605/1], the Medical Research Council [MR/ K501335/1] and the Wellcome Trust [ISSF award] funding to AGW. PhD stu‑ dentship funding was provided by Consejo Nacional de Ciencia y Tecnologia (CONACyT), Mexico (to SG‑M), Albaha University scholarship, Kingdom of Saudi Arabia (to AAAS), University of Malaya, Kuala Lumpur, Malaysia and The Higher Education Ministry, Malaysia (to GM), King Abdullah scholarship program, Kingdom of Saudi Arabia (to OR). The funding bodies had no roles in the design or execution of the study.
Availability of data and materials
The ChIP‑seq datasets supporting the conclusions of this article are available in the NCBI GEO repository under Accession Number GSE118031.
Ethics approval and consent to participate Not applicable.
Consent for publication Not applicable.
Competing interests
The authors declare that they have no competing interests.
Author details
1 Institute of Cancer Sciences, College of Medical Veterinary and Life Sciences, University of Glasgow, University Avenue, Glasgow G12 8QQ, UK. 2 School of Life Sciences, College of Medical Veterinary and Life Sciences, University of Glasgow, University Avenue, Glasgow G12 8QQ, UK. 3 Present Address: Institute of Biological Sciences, Faculty of Science, University of Malaya, Kuala Lumpur, Malaysia. 4 Present Address: Department of Basic Medical Sciences, Faculty of Applied Medical Sciences, Albaha University, Albaha‑Alaqiq, Saudi Arabia.
Received: 13 September 2019 Accepted: 3 December 2019
References
1. Mattout A, Meshorer E. Chromatin plasticity and genome organization in pluripotent embryonic stem cells. Curr Opin Cell Biol. 2010;22(3):334–41. 2. Bernstein BE, Mikkelsen TS, Xie X, Kamal M, Huebert DJ, Cuff J, et al. A
bivalent chromatin structure marks key developmental genes in embry‑ onic stem cells. Cell. 2006;125(2):315–26.
3. Deng T, Zhu ZI, Zhang S, Leng F, Cherukuri S, Hansen L, et al. HMGN1 modulates nucleosome occupancy and DNase I hypersensitivity at the CpG island promoters of embryonic stem cells. Mol Cell Biol. 2013;33(16):3377–89.
4. Meshorer E, Yellajoshula D, George E, Scambler PJ, Brown DT, Misteli T. Hyperdynamic plasticity of chromatin proteins in pluripotent embryonic stem cells. Dev Cell. 2006;10(1):105–16.
5. Kugler JE, Deng T, Bustin M. The HMGN family of chromatin‑binding proteins: dynamic modulators of epigenetic processes. Biochimica et Biophysica Acta (BBA). 2012;1819(7):652–6.
6. Ueda T, Postnikov YV, Bustin M. Distinct domains in high mobility group N variants modulate specific chromatin modifications. J Biol Chem. 2006;281(15):10182–7.
7. Lim JH, Catez F, Birger Y, West KL, Prymakowska‑Bosak M, Postnikov YV, et al. Chromosomal protein HMGN1 modulates histone H3 phosphoryla‑ tion. Mol Cell. 2004;15(4):573–84.
8. Lim JH, West KL, Rubinstein Y, Bergel M, Postnikov YV, Bustin M. Chromo‑ somal protein HMGN1 enhances the acetylation of lysine 14 in histone H3. EMBO J. 2005;24(17):3038–48.
9. Barkess G, Postnikov Y, Campos CD, Mishra S, Mohan G, Verma S, et al. The chromatin‑binding protein HMGN3 stimulates histone acetylation and transcription across the Glyt1 gene. Biochem J. 2012;442(3):495–505. 10. Rattner BP, Yusufzai T, Kadonaga JT. HMGN proteins act in opposition to
11. Murphy KJ, Cutter AR, Fang H, Postnikov YV, Bustin M, Hayes JJ. HMGN1 and 2 remodel core and linker histone tail domains within chromatin. Nucleic Acids Res. 2017;45(17):9917–30.
12. Deng T, Postnikov Y, Zhang S, Garrett L, Becker L, Racz I, et al. Interplay between H1 and HMGN epigenetically regulates OLIG1&2 expression and oligodendrocyte differentiation. Nucleic Acids Res. 2017;45(6):3031–45. 13. Amen M, Espinoza HM, Cox C, Liang X, Wang J, Link TM, et al. Chromatin‑
associated HMG‑17 is a major regulator of homeodomain transcription factor activity modulated by Wnt/beta‑catenin signaling. Nucleic Acids Res. 2008;36(2):462–76.
14. Zhu N, Hansen U. HMGN1 modulates estrogen‑mediated transcriptional activation through interactions with specific DNA‑binding transcription factors. Mol Cell Biol. 2007;27(24):8859–73.
15. Furusawa T, Lim JH, Catez F, Birger Y, Mackem S, Bustin M. Down‑ regulation of nucleosomal binding protein HMGN1 expression during embryogenesis modulates Sox9 expression in chondrocytes. Mol Cell Biol. 2006;26(2):592–604.
16. Belova GI, Postnikov YV, Furusawa T, Birger Y, Bustin M. Chromosomal protein HMGN1 enhances the heat shock‑induced remodeling of Hsp70 chromatin. J Biol Chem. 2008;283(13):8080–8.
17. Gerlitz G, Hock R, Ueda T, Bustin M. The dynamics of HMG protein‑chro‑ matin interactions in living cells. Biochem Cell Biol. 2009;87(1):127–37. 18. Cuddapah S, Schones DE, Cui K, Roh TY, Barski A, Wei G, et al. Genomic
profiling of HMGN1 reveals an association with chromatin at regulatory regions. Mol Cell Biol. 2011;31(4):700–9.
19. Deng T, Zhu ZI, Zhang S, Postnikov Y, Huang D, Horsch M, et al. Functional compensation among HMGN variants modulates the DNase I hypersensi‑ tive sites at enhancers. Genome Res. 2015;25(9):1295–308.
20. Zhang S, Zhu I, Deng T, Furusawa T, Rochman M, Vacchio MS, et al. HMGN proteins modulate chromatin regulatory sites and gene expression dur‑ ing activation of naive B cells. Nucleic Acids Res. 2016;44(15):7144–58. 21. Birger Y, West KL, Postnikov YV, Lim JH, Furusawa T, Wagner JP, et al. Chro‑
mosomal protein HMGN1 enhances the rate of DNA repair in chromatin. EMBO J. 2003;22(7):1665–75.
22. Lehtonen S, Olkkonen VM, Stapleton M, Zerial M, Lehtonen E. HMG‑17, a chromosomal non‑histone protein, shows developmental regulation during organogenesis. Int J Dev Biol. 1998;42(6):775–82.
23. Crippa MP, Nickol JM, Bustin M. Differentiation‑dependent alteration in the chromatin structure of chromosomal protein HMG‑17 gene during erythropoiesis. J Mol Biol. 1991;217(1):75–84.
24. Pash JM, Alfonso PJ, Bustin M. Aberrant expression of high mobility group chromosomal protein 14 affects cellular differentiation. J Biol Chem. 1993;268(18):13632–8.
25. Furusawa T, Ko JH, Birger Y, Bustin M. Expression of nucleosomal protein HMGN1 in the cycling mouse hair follicle. Gene Expr Patterns. 2009;9(5):289–95.
26. Nagao M, Lanjakornsiripan D, Itoh Y, Kishi Y, Ogata T, Gotoh Y. High mobility group nucleosome‑binding family proteins promote astrocyte differentiation of neural precursor cells. Stem Cells. 2014;32(11):2983–97. 27. Abuhatzira L, Shamir A, Schones DE, Schaffer AA, Bustin M. The
chromatin‑binding protein HMGN1 regulates the expression of methyl CpG‑binding protein 2 (MECP2) and affects the behavior of mice. J Biol Chem. 2011;286(49):42051–62.
28. McBurney MW, Rogers BJ. Isolation of male embryonal carcinoma cells and their chromosome replication patterns. Develop Biol. 1982;89(2):503–8.
29. Nichols J, Smith A. Naive and primed pluripotent states. Cell Stem Cell. 2009;4(6):487–92.
30. Kinoshita M, Smith A. Pluripotency deconstructed. Dev Growth Differ. 2018;60(1):44–52.
31. Martello G, Smith A. The nature of embryonic stem cells. Annu Rev Cell Dev Biol. 2014;30:647–75.
32. Ran FA, Hsu PD, Lin CY, Gootenberg JS, Konermann S, Trevino AE, et al. Double nicking by RNA‑guided CRISPR Cas9 for enhanced genome edit‑ ing specificity. Cell. 2013;154(6):1380–9.
33. Abranches E, Guedes AM, Moravec M, Maamar H, Svoboda P, Raj A, et al. Stochastic NANOG fluctuations allow mouse embryonic stem cells to explore pluripotency. Development. 2014;141(14):2770–9.
34. Zhao W, Ji X, Zhang F, Li L, Ma L. Embryonic stem cell markers. Molecules. 2012;17(6):6196–236.
35. Thomson M, Liu Siyuan J, Zou L‑N, Smith Z, Meissner A, Ramanathan S. Pluripotency factors in embryonic stem cells regulate differentiation into germ layers. Cell. 2011;145(6):875–89.
36. Jin Z, Liu L, Bian W, Chen Y, Xu G, Cheng L, et al. Different transcrip‑ tion factors regulate nestin gene expression during P19 cell neural differentiation and central nervous system development. J Biol Chem. 2009;284(12):8160–73.
37. Bertrand N, Castro DS, Guillemot F. Proneural genes and the specification of neural cell types. Nat Rev Neurosci. 2002;3(7):517–30.
38. van der Heyden MA, Defize LH. Twenty one years of P19 cells: what an embryonal carcinoma cell line taught us about cardiomyocyte differen‑ tiation. Cardiovasc Res. 2003;58(2):292–302.
39. Jamali M, Rogerson PJ, Wilton S, Skerjanc IS. Nkx2‑5 activity is essential for cardiomyogenesis. J Biol Chem. 2001;276(45):42252–8.
40. Nakayama Y, Wada A, Inoue R, Terasawa K, Kimura I, Nakamura N, et al. A rapid and efficient method for neuronal induction of the P19 embryonic carcinoma cell line. J Neurosci Methods. 2014;227:100–6.
41. Ying QL, Stavridis M, Griffiths D, Li M, Smith A. Conversion of embryonic stem cells into neuroectodermal precursors in adherent monoculture. Nat Biotechnol. 2003;21(2):183–6.
42. Munoz‑Sanjuan I, Brivanlou AH. Neural induction, the default model and embryonic stem cells. Nat Rev Neurosci. 2002;3(4):271–80.
43. Farah MH, Olson JM, Sucic HB, Hume RI, Tapscott SJ, Turner DL. Genera‑ tion of neurons by transient expression of neural bHLH proteins in mam‑ malian cells. Development. 2000;127(4):693–702.
44. Kim S, Yoon YS, Kim JW, Jung M, Kim SU, Lee YD, et al. Neurogenin1 is sufficient to induce neuronal differentiation of embryonal carci‑ noma P19 cells in the absence of retinoic acid. Cell Mol Neurobiol. 2004;24(3):343–56.
45. He B, Deng T, Zhu I, Furusawa T, Zhang S, Tang W, et al. Binding of HMGN proteins to cell specific enhancers stabilizes cell identity. Nat Commun. 2018;9(1):5240.
46. Conti L, Pollard SM, Gorba T, Reitano E, Toselli M, Biella G, et al. Niche‑ independent symmetrical self‑renewal of a mammalian tissue stem cell. PLoS Biol. 2005;3(9):e283.
47. Lizio M, Harshbarger J, Shimoji H, Severin J, Kasukawa T, Sahin S, et al. Gateways to the FANTOM5 promoter level mammalian expression atlas. Genome Biol. 2015;16:22.
48. Langmead B, Trapnell C, Pop M, Salzberg SL. Ultrafast and memory‑ efficient alignment of short DNA sequences to the human genome. Genome Biol. 2009;10(3):R25.
49. Feng J, Liu T, Qin B, Zhang Y, Liu XS. Identifying ChIP‑seq enrichment using MACS. Nat Protoc. 2012;7(9):1728–40.
50. Kent WJ, Sugnet CW, Furey TS, Roskin KM, Pringle TH, Zahler AM, et al. The human genome browser at UCSC. Genome Res. 2002;12(6):996–1006. 51. Consortium EP. An integrated encyclopedia of DNA elements in the
human genome. Nature. 2012;489(7414):57–74.
Publisher’s Note