*Author to whom all correspondence and reprint requests should be addressed:
Sylvain Lehmann, CNRS, Institut de Génétique Humaine, Montpellier, France; CHU Montpellier, Labo-ratoire de Biochimie, Hôpital St. Eloi, Montpellier, France; Université Montpellier 1, F-34000, France. Email: [email protected].
The first two authors contributed equally to this work. Clinical Proteomics
Copyright © 2006 Humana Press Inc.
All rights of any nature whatsoever are reserved.
ISSN 1542-6416/06/02:145–152/$30.00 (Online)
Abstract
In this manuscript, we compared serum pro-files obtained with two related technologies, SELDI-TOF and Clinprot, using a single bioinfor-matic algorithm. These two approaches rely on mass spectrometry to detect proteins and pep-tides initially selected by binding to various chro-matographic matrices. They are proposed by two
different companies, and they are competing for being the reference in high throughput serum profiling for clinical proteomics. This independent evaluation of these two technologies put the light on some of their differences, suggests that they address different proteome fractions and, thus, could be complementary. Taken together, our data could contribute to the parameters relevant for the choice of one technology or the other.
Key Words: SELDI; Clinprot; profiling; serum; bioinformatics; clinical proteomics.
Introduction
Human serum and plasma have an important clinical value for identification and detection
of biomarkers. However, the analysis of these liquids is analytically challenging because of the high dynamic concentration range (over 10 orders of magnitude) of blood constituent protein/peptide species (1). High abundant proteins, such as albumin, immunoglobulins, or
Original Article
Comparison Between Surface and Bead-Based
MALDI Profiling Technologies Using a Single
Bioinformatics Algorithm
Christelle Reynès,
1Stéphane Roche,
2,3Laurent Tiers,
2Robert Sabatier,
1Patrick Jouin,
4Nicolas Molinari,
5,6and Sylvain Lehmann
2,3,6,*
1Laboratoire de Physique Moléculaire et Structurale, Faculté de Pharmacie, Montpellier, France;2CNRS,
Institut de Génétique Humaine, Montpellier, France;3CHU Montpellier, Laboratoire de Biochimie,
Hôpital St. Eloi, Montpellier, France;4IGF, CNRS UMR5203, INSERM, U661, Univ Montpellier I,
Univ Montpellier II, Montpellier, F-34094 France;5Institut Universitaire de Recherche Clinique,
Faculté Médecine, Montpellier; CHU Nîmes, Service DIM, Nîmes, France; and 6 Université Montpellier 1,
Clinical Proteomics ________________________________________________________________ Volume 2, 2006 146 _______________________________________________________________________________ Reynès et al.
lipoproteins, produce large signals in most pro-teomic approaches and they mask or interfere with the detection of the other low amount pro-tein components. This situation explains why the discovery of new protein or peptide biomarkers in blood is challenging. To minimize these prob-lems, separation proteomic scheme combining for example chromatography and mass spec-trometry (MS) methods were developed (2,3). This is the case of both surface-enhanced laser desorption/ionization time-of-flight (SELDI-TOF) and ClinprotTMapproaches (4), which rely
on MS to detect proteins and peptides initially selected by binding to various chromatographic matrices (anionic, cationic, IMAC, hydrophobic). These two approaches differ by the format of the chromatographic matrices, surface vs beads, the mass spectrometers, and by the data analysis software used. They are proposed by two different companies, Ciphergen®(Fremont,
CA) and Bruker Daltonics®(Bremen, Germany),
respectively, and they are competing for being the reference in high throughput serum profil-ing for clinical proteomics. It is noteworthy that results obtained initially with this technological approach have been often disappointing and controversial (5,6). However, other studies using SELDI-TOF with protein identification and care-ful study design to avoid nonbiological arte-facts were able to demonstrate better outcomes, i.e., discovery and validation of potential cancer biomarkers. An example is given by the mul-ticenter study by Zhang et al. (7) validating three biomarkers for the detection of early stage ovarian cancer. Nevertheless, reduction of bias linked to preanalytical and analytical phases, as well as use of prefractionation methods (4,8–10), will most likely improve the potency of these approaches in the future. In this work, we compared using a single bio-informatic algorithm, serum profiles obtained with SELDI-TOF and Clinprot. This indepen-dent evaluation of the relative performance of the two methods could help in choosing a future serum profiling technology.
Experimental Procedures
Study Design and Biological Samples
To mimic a serum proteomic profiling experiment run on the two technologies, we analyzed a group of 12 serum samples from C57BL/6 mice (collected between the age of 150 and 250 d). Similar results were obtained on human samples (not shown). Serum (100 µL) were obtained from 12 different mice by jugu-lar puncture as part of a control group for an ongoing serum profiling experiment. The blood was collected in Eppendorf tubes with-out additive, let clot 20 min at room tempera-ture and centrifuged for 20 min at 3000g. Serum was recovered and frozen at –80°C until used.
SELDI-TOF Analysis
settings for all the samples and for data collec-tion as follows: laser intensity 200, detector sensitivity 7, molecular mass range 1000 to 20,000 m/z, center mass 10,500 m/z, 160 shots per spot. External calibration was done with the All-in-1 Protein Standard II (Ciphergen).
ClinProt Analysis
Each serum sample was diluted 1.5 times in a solution of 8 Murea, 1% CHAPS, and shaken 15 min at room temperature. Ten microliters of MB-WCX (weak cation exchange) binding solution and 10 µL of MB-WCX beads were added to 5 µL of denatured samples. After a 10-min incubation, microbeads were washed twice using 100 µL of the MB-WCX wash solu-tion using the magnetic bead separator (MBS) to collect the microbeads. After removal of the wash solution, 5 µL of MB-WCX elution solu-tion was added during 5 min. Microbeads were then collected with the MBS; the super-natant was transferred into a fresh tube con-taining 5 µL of MB-WCX stabilization solution. Finally, 1 µL of the eluate was mixed 1:1 with the CHCA solution (prepared as previously described) and 0.5 µL was applied on an Anchor chip sample plate. MS analysis was performed on an Ultraflex MALDI-TOF (Bruker Daltonics). The settings used were the following: laser 20 ps (20 MHz), 25–35% power, sum up 1000 satisfactory shots in 100 shot steps, deflector set at 900 m/z and reflector off. The use of the MALDI-TOF in the linear mode, without reflector is adapted to the Clinprot approach that necessitates detection of ions with m/z values greater than 5000.
Exportation and Conversion
of the Raw Data
SELDI spectra were exported as raw data using the function provided in the Pro-teinChip software v3.2 (Ciphergen Biosys-tems). The generated file that contains the intensity values at all the m/z points was imported in R using the function read.table().
R is a language and environment for statistical computing and graphics (http://www.r-pro-ject.org/). R is available as Free Software under the terms of the Free Software Founda-tion’s GNU General Public License in source code form. The software used for this work is available upon request to C.R. For the Clinprot data, the data are stored in a “fid” format that was converted into the “mzXML” format using the software Compass Xport 1.2.3 (Brucker Daltonics). The data in the latter format were imported in R thanks to the library CaMassClass (11).
DATA Processing and Analysis
Combination of Clinprot Spectra
Bruker Daltonics recommended performing four replicates per samples from the same microbeads separation probably as a mean to improve the repeatability. Importantly, the four replicates did not exactly have the same m/z coordinates, as a result of the mass spec-trometer variability, and therefore the simple mean between these spectra was not possible. The four spectra were therefore sorted by ascending m/z and the average of 10 succes-sive points, belonging to the four spectra, was calculated. This decreased the total number of points par spectrum by a factor of two. How-ever, this point density was still higher than that of the SELDI-TOF spectra by a factor 1.2.
Detection of Peaks
Clinical Proteomics ________________________________________________________________ Volume 2, 2006 148 _______________________________________________________________________________ Reynès et al.
following method: first, the spectrum was divided into two equal parts. In each part, the intensity maximum was identified. Then the boundaries of the corresponding peak were located based on the sign changes of the first derivative of the spectrum. For derivative computation, the spectrum was temporarily smoothed using Friedman’s super smoother
(12). These boundaries became the new limits of new zones in which a new local maximum was looked for. This sequence was repeated stops until the distance between two bound-aries was smaller than the mass accuracy (i.e., 0.1% as provided by the companies and veri-fied on the spectra). Then, based on the distri-bution of the valley-depths of all the peaks found in all the spectra (for each technology), a threshold was chosen, below which the peaks can be considered as noise. This thresh-old was determined graphically by locating the intensity below which frequency of points is abnormally high (results not shown).
Alignment of the Spectra
To compare the data generated within each technology and determine if peaks present in different spectra arisen from the same pep-tide/protein species, an alignment was real-ized as follows. The m/z locations of all the peaks from all the spectra were collected and sorted in ascending order. Then, a hierarchical clustering approach was applied to obtain peak clusters which minimum size corre-sponded to the mass accuracy value.
Comparison of Peaks Between
the Two Technologies
Once the peaks were selected for both SELDI-TOF and Clinprot (see Detection of Peaks), the clustering was performed between the two technologies using the peaks identified following the alignment of all the spectra. The same clustering method was used, but as one could consider that there is a shift between the
two technologies, the threshold used corre-sponded to twice the mass accuracy.
Results and Discussion
The purpose of this work was to compare proteomic profiles obtained with two related approaches, SELDI-TOF and Clinprot. These two leading profiling technologies are pro-posed by two different companies, Ciphergen and Bruker Dynamics, respectively. We carry out this study using as initial step of the pro-filing, the capture of proteins on comparable weak cation exchange chromatographic matri-ces, coupled to surfaces (CM10, SELDI-TOF) or microbeads (WCX, Clinprot). Twelve mouse sera were analysed using recommended ana-lytical protocols and the same CHCA matrix for MS. The idea was to mimic a small group of serum samples, as analyzed in many serum profiling studies (13). To avoid bias related to the different software used by the two compa-nies, raw data were exported to the statistical software R before normalization and peak detection (see Experimental Procedures). We focused our analysis on the 1500 to 10,000 m/z range which is optimal with the CHCA MS matrix used.
Fig.
1.
(A)
Distribution of the backgr
ound signal variability
,or noise
,f
or Clinpr
ot (gr
een) and SELDI-T
OF (r
ed) betw
een 6400 and 6700 m/z.
Note that the distribution is mor
e homogeneous in Clinpr
ot.
(B)
General vie
w of a r
epr
esentativ
e SELDI-T
OF (r
ed) and Clinpr
ot (gr
serum pr
ofile
.
In the inser
t,
some peaks ar
e pr
esent in one technolog
y and not in the other (stars),
wher
eas others (triangle) ar
e
common
to both.
(C)
Comparison f
or the tw
o technologies of the r
esolution obtained f
or the same peak located near 2800 m/z.
(D)
General
ov
er
vie
w of the 12 spectra fr
om the tw
o technologies betw
een 1500 and 10,000 m/z.
The pr
esence of ad
ditional peaks in the high m
/z ratio
is clearl
y visible in SELDI-T
OF
Clinical Proteomics ________________________________________________________________ Volume 2, 2006 150 _______________________________________________________________________________ Reynès et al.
81828.43 and for SELDI-TOF from –11.28 to 342.56. To facilitate the comparative analysis of the two types of spectra, the values of the raw SELDI intensities were multiplied by 1000 and used as a common arbitrary unit for the inten-sity. This did not affect the overall analysis of the spectra as the same peaks were detected before and after applying the multiplication factor (not shown). Importantly, for the analy-sis of the Clinprot data, Bruker Daltonics rec-ommended performing four replicates of each spectrum from the same microbeads separa-tion. To conform to this recommendation, the mean of these four spectra was calculated before analysis (see Experimental Procedures).
As illustrated Fig. 1B, the general aspects of SELDI-TOF and Clinprot spectra obtained using similar capture matrices were alike. However, differences in terms of peak presence or absence, height, and resolution were clearly apparent (insert, Fig. 1B). The latter parameter is important for the detection and quantifica-tion of different peaks; a high resoluquantifica-tion leads to rapid comeback to the baseline and a good separation of two peaks without contamina-tion of each species. In our case, the Ciphergen PBSIIc mass spectrometer has a lower resolu-tion, as illustrated in the vicinity of the 2800 m/z peak (Fig. 1C). This difference with the Clinprot Ultraflex I mass spectrometer will be reduced with the new generation of Cipher-gen mass spectrometer (PBS4000). Interestingly, the difference in resolution did not dramatically
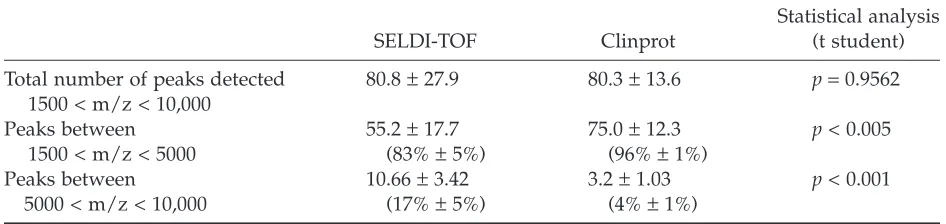
modify the total number of peaks detected in both technologies (seeTable 1).
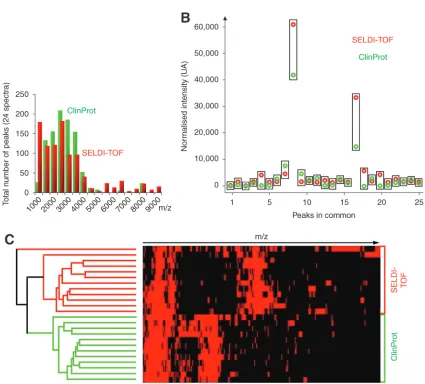
To validate our observation independently from a particular sample, we have performed the analysis of 12 different mouse sera using both technologies (Fig. 1D). The detection of the peaks in all the spectra was realized based on sign changes of the derivated spectra. An equiv-alent number of peaks (close to 80 between 1500 and 10,000 m/z, see Table 1) was detected in both technologies. Interestingly, analysis of the SELDI-TOF spectra with the Ciphergen biomarker software also resulted in an average 80 peaks detected when a signal/noise ratio of three was used (not shown). This validates the performance of our biostatistical method. Importantly, significant differences were observed between the two technologies for the peak dis-tribution in regards to the m/z values (Fig. 2A). In fact in the lower m/z range, less than 5000 m/z, Clinprot could detect more peaks than SELDI-TOF, whereas above this value, it was the opposite (Table 1). This difference is most likely related to the higher resolution of the Clinprot mass spectrometer that resolves more peaks for small peptides. A high MS resolution is in fact essential for peptide mass fingerprint and iden-tification purposes (14). It is also valuable for profiling of small ions, but based on our results it seems less critical here (in the high mass range) because we analyzed nonprotease digested proteins from complex biological sam-ples like serum.
Table 1
Summary of the Peaks Detected for the 12 Samples, in Both Technologies, and Their Relative Distribution Between Low and High m/z Ratio
Statistical analysis
SELDI-TOF Clinprot (t student)
Total number of peaks detected 80.8 ±27.9 80.3 ±13.6 p=0.9562 1500 < m/z < 10,000
Peaks between 55.2 ±17.7 75.0 ±12.3 p< 0.005
1500 < m/z < 5000 (83% ±5%) (96% ±1%)
Peaks between 10.66 ±3.42 3.2 ±1.03 p< 0.001
To directly compare the results obtained in the two technologies, the alignment of the peaks between all the spectra was realized using hierarchical clustering with a threshold corresponding to the m/z accuracy. Twenty five m/z peaks were detected in more than half the spectra in the two technologies. The intensity of these twenty five peaks was correlated between the two technologies (see example Fig. 2B, correlation factor =0.84 ±0.1).
This suggested that the binding and the detec-tion of common peaks were somehow compa-rable in the two technologies. However, as we mentioned before, many peaks were detected only in one technology or the other, as illus-trated by the result of the hierarchical cluster-ing realized between SELDI-TOF and Clinprot peaks (Fig. 2C).
Taken together our results indicate that SELDI-TOF and Clinprot technologies could
Clinical Proteomics ________________________________________________________________ Volume 2, 2006 152 _______________________________________________________________________________ Reynès et al.
achieve a comparable proteomic profiling from unfractionated serum which could then be used for detection of potential blood biomark-ers. However, the ClinProt technology allows to analyse, for one sample, not only the subset of proteins retained by the chromatographic sur-face as in SELDI-TOF, but also the nonretained fraction and the eluted fractions, as on chro-matographic columns. This represents an attrac-tive possibility for this technology, which also allows the use of several type of MS matrices for a single capture experiment. The use of a mass spectrometer with a better resolution, here Ultraflex I vs PBSIIc, and for SELDI the new PBS4000 vs PBSIIc, facilitates peaks detection and quantitation (especially in the lower m/z range) and should be favoured. Interestingly, although some peaks appeared to be present in both profiles using the two technologies, many differences in the profiles still exist suggesting that they address different proteome fractions and could be complementary. In conclusion, our study does not definitely favor the choice of one technology or the other, and additional param-eters like purification procedures of candidates, cost, or possibilities for clinical multisite valida-tion, need to be taken into account before choos-ing between these two approaches.
Acknowledgments
We thank Prof. Jean-Paul Cristol for his sup-port. Supported by grants from the CHU Montpellier AOI 2004, the EC network of Excellence “Neuroprion” FOOD-CT-2004-506579 and the CNRS.
References
1. Anderson, N. L. and Anderson, N. G. (2002) The human plasma proteome: history, charac-ter, and diagnostic prospects. Mol. Cell. Pro-teomics 1,845–867.
2. Pieper, R., Gatlin, C. L., Makusky, A. J., et al. (2003) The human serum proteome: display of nearly 3700 chromatographically separated protein spots on two-dimensional
electro-phoresis gels and identification of 325 distinct proteins. Proteomics 3,1345–1364.
3. Yang, Z., Hancock, W. S., Chew, T. R., and Bonilla, L. (2005) A study of glycoproteins in human serum and plasma reference standards (HUPO) using multilectin affinity chromato-graphy coupled with RPLC-MS/MS. Pro-teomics 5,3353–3366.
4. Hortin, G. L. (2006) The MALDI-TOF mass spectrometric view of the plasma proteome and peptidome. Clin. Chem. 52,1223–1237. 5. Petricoin, E. F., Ardekani, A. M., Hitt, B. A.,
et al. (2002) Use of proteomic patterns in serum to identify ovarian cancer. Lancet359,572–577. 6. Coombes, K. R., Morris, J. S., Hu, J., Edmon-son, S. R., and Baggerly, K. A. (2005) Serum proteomics profiling: a young technology begins to mature. Nat. Biotechnol.23,291–292. 7. Zhang, Z., Bast, R. C., Jr., Yu, Y., et al. (2004) Three biomarkers identified from serum pro-teomic analysis for the detection of early stage ovarian cancer. Cancer Res. 64,5882–5890. 8. Issaq, H. J., Conrads, T. P., Janini, G. M., and
Veenstra, T. D. (2002) Methods for fractiona-tion, separation and profiling of proteins and peptides. Electrophoresis23,3048–3061. 9. Pieper, R., Su, Q., Gatlin, C. L., Huang, S. T.,
Anderson, N. L., and Steiner, S. (2003) Multi-component immunoaffinity subtraction chro-matography: an innovative step towards a comprehensive survey of the human plasma proteome. Proteomics3,422–432.
10. Guerrier, L., Thulasiraman, V., Castagna, A., et al. (2006) Reducing protein concentration range of biological samples using solid-phase ligand libraries.J. Chromatogr. B Analyt. Technol. Biomed. Life Sci. 833,33–40.
11. Tuszynski, J. (2006) caMassClass: processing and classification of protein mass spectra (SELDI) data. http://cranr-projectorg/src/ contrib/Descriptions/caMassClasshtml (The caMassClass Software License, Version 1.0). 12. Friedman, J. (1984) A variable span scatterplot
smoother: Laboratory for Computational Statistics, Stanford University, report no.: Tech-nical Report No. 5.
13. Fung, E. T., Wright, G. L., Jr., and Dalmasso, E. A. (2000) Proteomic strategies for biomarker identification: progress and challenges. Curr. Opin. Mol. Ther. 2,643–650.