Time triggered wireless accelerometer power saving architecture
Apinan
Aurasopon
1*, Sanya Kuankid
2(1. Faculty of Engineering, Mahasarakham University, Kantharawichai district, Maha Sarakham, 44150, Thailand;
2. Faculty of Science and Technology Nakhon Pathom Rajabhat University 85 Malaiman Road, Muang, Nakhon Pathom 73000 Thailand)
Abstract: The development of wireless embedded systems for classifying and monitoring animal behaviors has become
increasingly appealing for animal production and health monitoring purposes. In recent years, there has been an emphasis on using wireless accelerometer systems to identify cow behaviors because they can offer significant data for efficient classification. However, while implementing such a system in outdoor environments, the high power consumption of the wireless transceiver is one of the main drawbacks and has been shown to be a big challenge to maintain, especially when transmitting data through XBee RF modules. To fulfill the requirements of power reduction, this paper proposes a technique based on time-triggered architecture for controlling the transmitted rate of XBee RF modules. In the proposed architecture, changes in behavior of the cow result in the XBee RF module being in active mode. Otherwise, when the cow does not change its behavior the XBee RF module is in sleep mode. The results show that the proposed architecture can help to achieve a significant reduction in power consumption of the wireless embedded system and improve the battery lifetime.
Keywords: wireless embedded system, XBee module, accelerometer, cow behaviors
Citation: Apinan, A., and S. Kuankid. 2018. Time triggered wireless accelerometer power saving architecture. Agricultural
Engineering International: CIGR Journal, 20(3): 245–252.
1 Introduction
The detection of animal behavior has been the subject for a wide range of studies. An analysis of cow activity to identify health problems or the risk of cows for a disease would have a significant impact on practical farming and also be useful in alleviating health and economic costs associated with the illness. When designing the automated system for monitoring animal behaviors, especially in outdoor environments, many recent studies have focused on using remote sensor systems to objectively classify and monitor cow behaviors. In addition, most researchers have stated that cow behavior monitoring represents a class of wireless sensor network applications with enormous potential benefits for practical farming (Mainwaring et al., 2002; Guo et al., 2006; Nadimi et al., 2008a and 2008b; Darr and Epperson, 2009; Robert et al., 2009; Martiskainen et al., 2009;
Received date: 2015-3-05 Accepted date: 2017-10-24 * Corresponding author: Apinan, A., Ph.D., Associate Professor
of Faculty of Engineering, Mahasakham University, Thailand 44150, Email: [email protected].
Nadimi et al., 2012; Santonia et al., 2015; Ritaban et al., 2015; Apinan and Kuankid, 2016; Apinan et al., 2015). In the design and implementation of wireless sensor devices, most relevant papers employed an XBee RF module as a wireless transceiver. However, such a module requires high power consumption when it operates in an active mode. For example, the implementation of a wireless accelerometer system, employed XBee RF module as a transceiver. The peak current while transmitting and receiving data, and power down mode were 150 (International variant), 55 and 0.01 mA, respectively (Digi International Inc., 2009).
studies exploring the way to maintain the power reduction, particularly in the XBee RF module in the analysis and implementation phases of such a system.
Therefore, the objective of this paper was to reduce the power consumption for automated classifying system architecture. For the proposed system, cow behavior is detected. If behavior changes, the XBee RF module will be awakened to send data to the base station. After processing of the data transmission has finished, the XBee RF module returns to sleep mode. This process results in very low power consumption of the XBee RF module. This paper is organized as follows: section II describes the materials and methods used for reducing the power consumption of the wireless embedded sensor device; section III explains the experimental measurement and evaluates the results; the final section provides a conclusion.
2 Materials and methods
2.1 Power consumption of high transmission rate of
wireless embedded sensor device
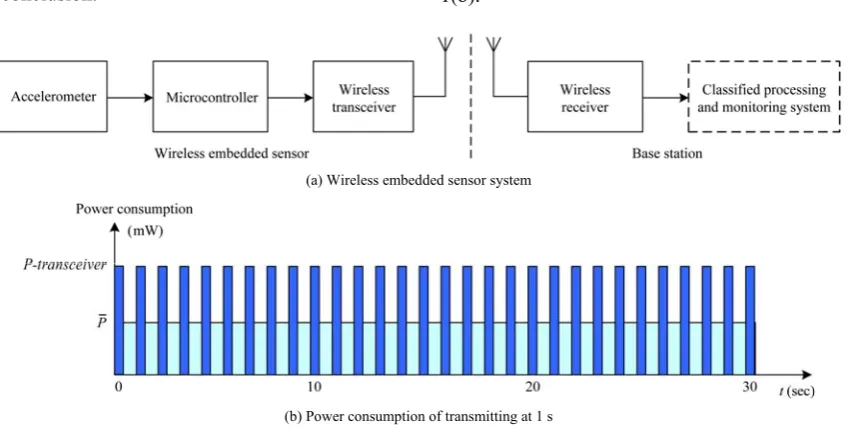
To monitor cow behaviors, the wireless embedded sensor device is attached to the neck or a leg of the cow for measuring movement data. These data are sent through the wireless transceiver or the wireless sensor network to the base station for classifying the behaviors. Figure 1(a) shows a diagram of the wireless embedded sensor system for measuring the cow’s movements. In an ideal situation, the acceleration data corresponding the cow’s movements should be continuously sent via the XBee RF module to the base station with a high transmission rate to preserve an accurate classification. This causes high power consumption as shown in Figure 1(b).
(a) Wireless embedded sensor system
(b) Power consumption of transmitting at 1 s
Figure 1 General system architecture for classifying the animal behavior 2.2 Proposed system architecture
In the design of the target architecture, the wireless transceiver should send the data to the base station just in case of the cow changing its behavior. Figure 2(a) shows the architecture of the wireless embedded sensor system for classifying and monitoring cow behaviors using the accelerometer.
In the proposed system, the behavioral classification is processed in the wireless embedded sensor device. Between the processing, if the cow changes to a different behavior, the wireless transceiver will be set in an active mode and send the results to the base station for system monitoring. If the cow does not change its behavior, the
wireless transceiver will be set in sleep mode to reduce power and would not send any data to the base station. Consequently, this architecture is able to significantly reduce the transmission rate to the wireless transceiver instead of sending a sequence of fixed periodic time. This means that such architecture can reduce the average transmitting power in the automated system as shown in Figure 2(b).
and dynamic time warping are necessarily constructed with an excessive amount of mathematical operations and high highly-resource requirements (Nadimi et al. 2012;
Santonia et al. 2015; Ritaban et al. 2015; Apinan and Kuankid. 2016; Apinan et al. 2015).
(a) System architecture for classifying cow behaviors
(b) Cow behaviors versus power consumption with behavioral classification
Figure 2 Proposed system Therefore, these techniques may be unsuitable to the
resource-constrained embedded devices, particularly when employing a low-cost microprocessor. Therefore, this paper uses a simple classification technique based on a decision tree methodology by classifying the cow behaviors into three groups that are standing, walking-grazing, and lying behaviors (Apinan et al., 2015). Because of the simple algorithm, this technique uses a much lower computational cost and can easily be implemented within the wireless embedded sensor system.
2.3 Behavioral classification based on magnitude and
variance of acceleration signals
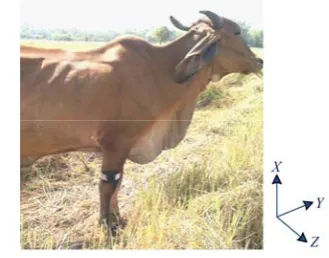
In practical terms, to measure the data of the cow’s movements, the wireless embedded sensor system, containing the accelerometer, microcontroller and wireless transceiver, is fitted around its leg. Figure 3 shows the relationship between the acceleration and the angles of each axis. Please note that, when the animal is standing, the Y and Z axes are perpendicular to a leg
while the X-axis is perpendicular to the ground.
by measuring the voltage level of the cow behaviors and computing the average value for each behavior. These threshold values are determined initially and applied to classify the behaviors of all cows.
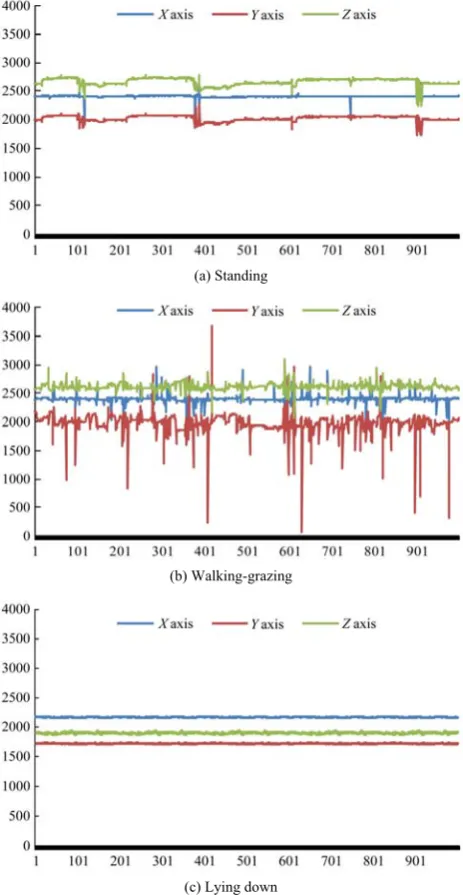
(a) Standing
(b) Walking-grazing
(c) Lying down
Figure 4 Graphical representation of acceleration data collection classified by behavior groups
In the process of classification, considering Figure 4, the voltage levels of the three-axes of lying behavior are different from the other behaviors. Therefore, lying behavior can be classified by using the threshold voltage levels. Because the voltage levels of standing behavior are very similar to those of walking-grazing behaviour, it is difficult to use the threshold voltage levels for classifying. As can be seen, the variation of the Y axis of walking-grazing is very oscillatory when compared with that of X and Z axes. Therefore, the walking-grazing mode
can be identified by using variance of Y axis.
To implement such algorithms in the embedded system, we firstly represent two steps as follows:
(1) In the first step, the cow behaviors are divided into two groups: 1) the standing and walking-grazing behaviors, and 2) the lying behavior. Considering Figure 4, the threshold of each axis can be found as follows:
While the cow is standing or walking-grazing, the average voltage of each axis can be found by Equation (1) and (2), respectively.
1
1 N
srj i
i
R
N =
=
∑
μ (1)
1
1 N
wrj i
i
R
N =
=
∑
μ (2)
Therefore, the average voltage of each axis of the standing and walking-grazing behaviors are found by
2
srj wrj
swrj
−
=μ μ
μ (3)
While the average voltage of each axis when the cow is lying.
1
1 N
lrj i
i
R
N =
=
∑
μ (4)
Therefore, the threshold of each axis using in classifying the standing and walking-grazing behaviors with the lying behavior is found by
2
swrj lrj
rj
R =μ −μ (5)
The behavior is classified every 60s, therefore, the average voltage of the present data of each axis can be found
60
1
1 60
j i
i
C R
=
=
∑
(6)where, Ri is the acceleration data of cow’s movements for
i = 1, 2…N; N is the data number, 1, 2…300; j is the axis for X, Y and Z.
The acceleration data of each axis, Ri is received every
second where i = 1, 2…60. Then, these data are averaged
to giveCX , CY and CZ that are compared with the
thresholdsRrX, RrY and RrZ respectively, based on the
(2) The second step is to classify the standing and walking-grazing behaviors using the variance of the Y axis. The average voltage of the variance of the Y axis while the cow is standing found by
(
)
22 1
N
i srY
i srY
R N
= −
=
∑
μσ (7)
And, the average voltage of the variance of Y axis while the cow is walking-grazing as
(
)
22 1
N
i wrY
i wrY
R N
= −
=
∑
μσ (8)
Therefore, the threshold for classifying these behaviors can be found by
2 2
2
srY wrY
PY
P =σ +σ (9)
For the variance of the present data of the Y axis acceleration is
60 2
2 1( )
60
i Y
i Y
R C
= −
=
∑
σ (10)
where, CY is the Y axis average voltage of the
acceleration data. The result of the variance of Y axis from Equation (10) is compared with the threshold value from Equation (9). If the variance value of the Y axis is higher than that of the threshold, it means the result is classified as walking-grazing behavior. On the other hand, if the value is lower than the threshold, the result is classified as standing behavior.
2.4 A wireless embedded sensor system based on
time-triggered architecture
The system software of this application is designed based on a “clock-driven” or “time-triggered” system. Such a system will be activated by all tasks with a specific time instant based on a periodic timer (Jane, 2000). Therefore, TT architecture is suitable for a wireless embedded sensor system that prepares all tasks in a fixed time step. In addition, the TT architecture will place the processor into sleep mode after complete execution of tasks in order to reduce the power of the operating system.
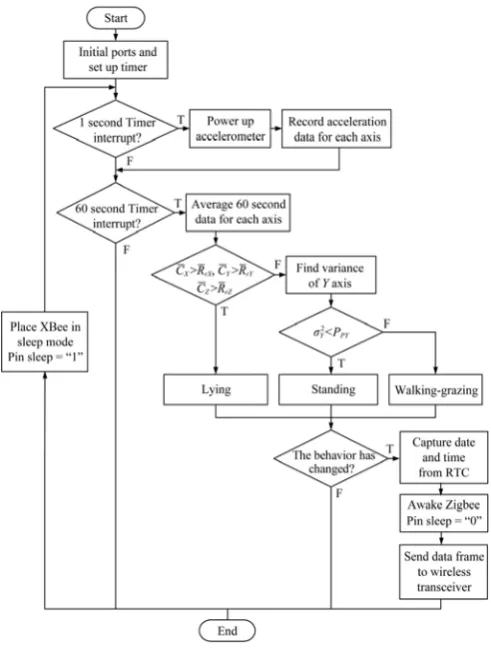
In the TT architecture, the behavioral classification approach is designed with the algorithm as shown in Figure 5. In this flowchart, the system will generate a tick interval every 1s to power up the accelerometer and record raw data from three-axes values. The consecutive
acceleration data of 60s are used to calculate the mean value for each axis and for sorting the behavior by using the classification approaches from Equations (1)-(10). After classified processing has finished, the current behavior is compared with the previous behavior. If the behavior has changed, the XBee RF module is awakened by setting its pin sleep to low. Then, the data frame consisting of date and time from the real-time clock, and current behavior, are sent to a wireless transmitter. Finally, the scheduler then places the XBee RF module into sleep mode, the pin sleep is set to high, and waits for the next tick interval after completing their execution.
Figure 5 Flowchart of wireless sensor software based on time-triggered architecture
To ensure that the system obtained accurate date and time for system monitoring of cow behaviors, the microcontroller was interfaced with a serial real-time clock DS1307 (Dallas semiconductor). The DS1307 was transferred serially with a 2-wire, bidirectional bus. The real-time clock provides accurate date and time information.
802.15.4 standards which operate at 2.4 GHz. It was connected to the microcontroller via a UART interface. This can connect directly to the pins of the RF module.
This firmly integrated with all the components that were assembled onto the printed circuit board. Battery power was supplied to the embedded device by a rechargeable Lithium-ion 3.7V, 1,000 mAh.
3 Experimental results
The performance of the proposed system was tested at the centre for the technology transfer agriculture (CTTA), Mahasarakham University, Thailand. In the experiments, we examined the results of the accuracy rate of the classification and the current consumption of the XBee RF module. The classified results of the proposed system were compared with those of manual observations in order to approximate the accuracy rate. The current consumption and the time duration during the transmission operation of the XBee module was measured to verify the reduction of the power consumption in the proposed system.
3.1 Classification success rate
Five cows were used in the experiments. The experimental data were recorded for 5 days (between 8.00 AM and 4.00 PM). To find the success rate of classification, the wireless embedded sensor device was installed around a leg of the cow. The acceleration data relate to the cow’s movements measured with a sampling rate at 1 Hz. The threshold value of each axis used in the classification of the standing and walking-grazing behaviors from the lying behavior were found by using
Equation (5), RrX =1820, RrY =1520 and RrZ =1570
While the threshold of the variance value of the Y axis for classifying the standing and the walking-grazing activities,
PPY was 3.1, found by using Equation (9). The results of
behavioral classification were sent to the base station for recording the behaviors versus time. The success rates were determined by comparing the percent agreement between manual observation and the proposed classification method during the entire experiment. Table 1 shows the percentages of correct classification of the proposed method. According to the table, the proposed techniques were able to classify the cow behaviors with a high classification success rate.
Table 1 Percentages of correct classification during the entire
experimental period
Behavioral mode Cattle number
Walking and looking for the grass (%)
Standing (%)
Lying down (%) Cow #1 98 87 93 Cow #2 98 95 95 Cow #3 97 89 93 Cow #4 98 91 95 Cow #5 97 95 93
Mean (µ) 97.6 91.4 93.8 Standard deviation (σ) 0.55 3.58 1.10
3.2 Power consumption The XBee PRO S1, 60mW module from Digi
International, XB24-ZB model, was used in the experiments. The UART data frame consists of 8 bytes. There is an identification number of the cow (1 byte), the result of classification (1 byte), and grouping of the date and time parameters (6 bytes). Experiments were set up in the laboratory for measuring the current consumption of the XBee module. All parameters of the experiment were configured as follows:
• Each transmitting frame consisted of 8 bytes.
• The transmit power was set at maximum power (PL=4).
• Supply voltage was 3.3 V.
• Time to wake up the XBee module was set at 15 ms and to transmit the data frame was 30 ms.
• Shunt resistor for measuring the current was 5Ω. To find the current consumption, the transmission rate
was set at 1 s. Time period to wake up the XBee module and the time periods used in transmission of the data frame were set at 15 and 30 ms. The experimental results are shown in Figure 6(a). The maximum current peak is equal to 128 mA (640 mV 5Ω-1). The zoom version of the current is shown in Figure 6(b). Its average was calculated about 18mV for completing the cycle 1 s, therefore, the current consumption is equal to 3.6 mA (18 mv 5Ω-1) resulting in the battery lifetime of about 277.7 hours. Reduction of the transmission rate can extend the battery lifetime but it causes errors in the classification.
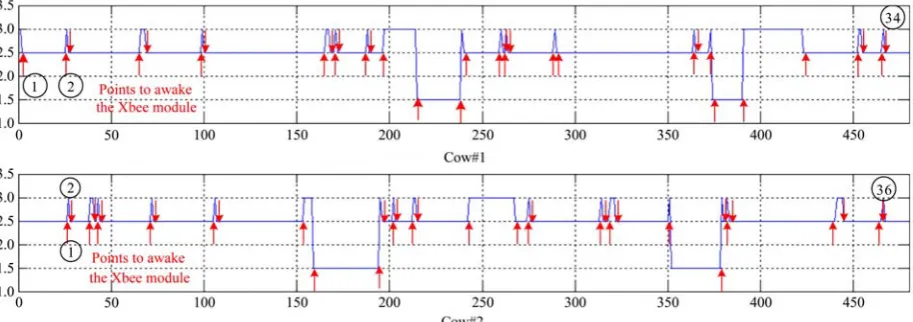
points show the time triggers to wake up the XBee modules when the cow was changed to a different behavior. At each point, the XBee module uses the time period in the active mode, for completing the transmission the data frame 8 bytes, 45 ms. From the results, the cow#1
and cow#2 changed their behaviors 34 and 36 times respectively during 8 hours. Therefor current consumptions of each XBee module were very low, approximately 21 and 22.5 µA respectively. The battery lifetime can be extended to 47,169 and 44,444 hours.
(a) Transmission rate at 1s (200 mV div-1, 250 ms div-1) (b) Its zoom version (200 mV div-1, 10 ms div-1) Figure 6 Current consumption of XBee module
Figure 7 Behavioral time periods of two cows and points to awake the XBee RF module
4 Discussion
This paper proposes a technique for controlling the transmission rate of the XBee module. In this technique, the process of the behavioral classification and the time-triggering architecture were implemented in the embedded sensor device. The result of the behavioral classification was checked by the time-triggering process. If the cow changed its behavior resulting in the XBee module operating in active mode. On the other hand, if the cow behavior did not change, the XBee module is placed in the sleep mode. In our experiments, we examined two viewpoints.
Firstly, we examined the results of classification rate.
Five cows were used. From the results, the success rates of the classification were more than 90 percentages all the cases when compared with video observations. However, there were some errors because the variance of the Y -axis is sensitive. When the cow was standing, the result of the system may show the walking-grazing behavior. The parameter choice used within the algorithm, behavioral variation across individual cows could have an effect on the classification performance. Each cow would have different values for the threshold.
reduced. Although, the proposed system shown the performance of the success rates of the behavioral classification and the power consumption reduction. The embedded sensor device was mounted on the cow’s leg. This is difficult in practice and this limitation might be overcome in future work by mounting the sensor on the cow’s neck.
5 Conclusion
This paper presents the design of a wireless embedded sensor architecture to classify cow behavior in an outdoor environment. The sensor uses acceleration data with a low-cost processor and a low-power monitoring system. This is intended to reduce the impact of high-power consumption that occurs in a wireless sensor node while transmitting data through an RF transceiver. The system’s performance is based on the average power consumption, the lifetime of battery, and the success rate of the behavioral classification. Overall, this paper concludes the use of proposed architecture is an efficient wireless embedded system for use with a wide range of outdoor environment.
Acknowlegment
This research was financially supported by Mahasarakham University Research Support and Development Found (2018). Thanks Dr. Adrian Roderick Plant, senior researcher, Division of Research of Facillitaion and Dissemination Mahasarakham University, for valuable comments and suggestions.
References
Apinan, A. T. R., and S. Kaunkid. 2015. Classification of the cattle behaviors by using magnitude and variance of accelerometer signal. Agricultural Engineering International: CIGR Journal, 17(4): 415–420.
Apinan, A., and S. Kuankid. 2016. Dynamic time warping for classifying cattle behaviors and reducing acceleration data size.
Agricultural Engineering International: CIGR Journal, 18(4): 293–300.
Darr, M., and W. Epperson. 2009. Embedded sensor technology for real time determination of animal lying time. Computers and Electronics in Agriculture, 66(1): 106–111.
XBee/XBee-PRO RF Modules, 2009, S1, pp. 4–5, https://www.digi.com: Digi International Inc.
Guo, Y., P. Corke, G. Poulton, T. Wark, G. B. Hurley, and D. Swain. 2006. Animal behaviour understanding using wireless sensor networks. In local computer networks, Proceedings 2006 31st IEEE, 607-614. Tampa, Florida, November 14-16, 2006. Jane, W. S. L. 2000. Real-Time System. Englewood: Prentice Hall. Mainwaring, A., D. Culler, R. Szewczyk, and J. Anderson, 2002. Wireless sensor networks for habitat monitoring. In WSNA '02 Proceedings of the 1st ACM international workshop on Wireless sensor networks and applications, 88–97. Atlanta, Georgia, September 28-28, 2002.
Martiskainen, P., M. Jӓrvinen, J. P. Skön, J. Tiirikainen, M. Kolehmainen, and J. Mononen. 2009. Cow behaviour pattern recognition using a three-dimensional accelerometer and support vector machines. Applied Animal Behavior Science, 119(1-2): 32–37.
Nadimi, E. S., H. T. Søgaard, and T. Bak. 2008a. ZigBee-based wireless sensor networks for classifying the behaviour of a herd of animals using classification trees. Biosystems Engineering, 100(2): 167–176.
Nadimi, E. S. 2008b. Modeling wireless sensor networks for monitoring in biological processes. Ph.D. diss., Department of Electronic Systems, Aalborg University, Denmark.
Nadimi, E. S., R. N. Jorgensen, V. Blanes-Vidal, and S. Christensen. 2012. Monitoring and classifying animal behavior using ZigBee-based mobile ad hoc wireless sensor networks and artificial neural networks. Computers and Electronics in Agriculture, 82(3): 44–54.
Ritaban, D., D. Smith, R. Rawnsley, G. Bishop-Hurley, J. Hills, G. Timms, and D. Henry. 2015. Dynamic cattle behavioural classification using supervised ensemble classifiers. Computers and Electronics in Agriculture, 111(C): 18–28.
Robert, B., B. J. White, D. G. Renter, and R. L. Larson. 2009. Evaluation of three-dimensional accelerometers to monitor and classify behavior patterns in cattle. Computers and Electronics in Agriculture, 67(1-2): 80–84.