journal homepage: http://civiljournal.semnan.ac.ir/
The Effect of Submergence Percentage of the
Submerged Piles on the Reduction of Scour in Bridge
Abutments
M.M. Razmi1*, M. Sanei2 and C. Ershadi3
1. MS Student in Water Engineering Islamic Azad University, Science and Research Branch, Hormozgan, Iran. 2. Faculty Member at Institute of Soil Conservation and Watershed Management.
3. Faculty Member at Hormozgan University.
* Corresponding author: m_tek2003@yahoo.com
ARTICLE INFO ABSTRACT
Article history:
Received: 13 September 2013 Accepted: 22 October 2014
Scour around hydraulic structures is an inevitable phenomenon. Recognition of this phenomenon and dealing with it is an issue considering which will ensure the project success. Local scour at piers has been reported as the most important factor in the destruction of the bridges. The use of submerged and non-submerged piles is one of the scour control methods. Submerged piles have been rarely used to assess scour. In the present study, the results of some tests with different flow rates and submergence percentages are given in the bridge abutment. The tests have been conducted at clear water conditions in a flume with length of 14m, width of 60cm and depth of 60cm. The results show that the increase in the submergence percentage of piles has a significant role in reducing pier scour.
Keywords: Local scour, Bridge abutments, Submerged piles, River engineering.
1. Introduction
The bridge fulcrum narrows the river section and changes the flow patterns. Presence of a fulcrum in the river leads to a high speed, bed shear stress, vortex and upstream cape turbulence [1]. The combination of these factors leads to the erosion of materials around the fulcrum and expansion of a ravine holes. Protection of the fulcrum from the local scour is one of the necessary points in the design of the structures built in rivers.
According to the laboratory studies, the stress concentration region is where the highest scour occurs [2].
scour depth and geometry and shape of the secure hole to immunize the structure against the failure. Therefore, reduction of local scour around this kind of structures is very important to the designers as a perspective [7]. In the mentioned test, there is no vertical motion of bed particles in the flume upstream. Thus, the scour falls in the category of clear water scour [8].
2. Materials and Methods
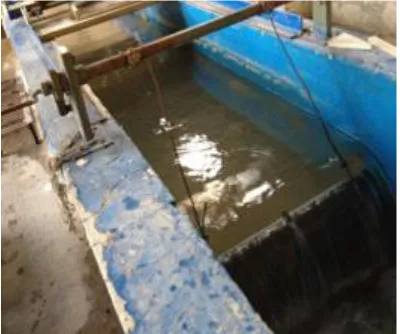
The tests are conducted in a flume with length of 14m, width of 0.6m, depth of 0.6m and longitudinal slope of 0.001. Sand with a thickness of 30cm and diameter 0f 0.9mm was poured into the flume and it is aligned with the bottom of the flume in all tests. All tests are conducted at subcritical conditions. The bridge fulcrum is made of wood with a length of 20cm and a width of 10cm. Piles are cylindrical irons with a diameter of 0.6cm and the distance of pile axes is 1.2cm and for the proper deployment of seven piles in the flume bed, a template with the same specifications was used with the angle of 90° to the flume wall. In all tests, the fulcrum was non-submerged and piles were submerged. A pump with a maximum flow of 40Lit/s is used in the flume upstream. According to the figure 1, the flow is controlled using the triangular weir located at the flume downstream. The height of the water on the weir was adjusted using the depth gauge on it. To adjust the water on the bed, a valve is used at the end of the flume as shown in figure 2. As shown in figure 3,
shape of fulcrum and the piles in the flume are also shown in figure 4. Since the water inlet pipe entered into the flume directly from the pump, the input flow was highly turbulent with a negative impact on the test process. In order to reduce turbulent flow at depth, a metal mesh screen was put in front of the entrance as restrainer and polystyrene was used as restrainer to reduce the turbulence of the flow.
Fig. 1. Triangular weir for flow measurement
Fig. 3. Profiler to measure the bed depth changes
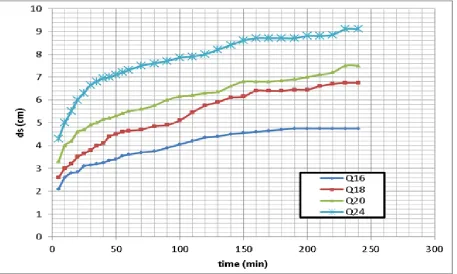
To determine the test time, a balance test was conducted for 240 minutes for fulcrum alone, in which the maximum scour depth
Fig. 4.A view of fulcrum and piles became constant (ds) and finally, as shown in figure 5, it was revealed that if the test takes 2 hours, at least 90% of the maximum scour depth occurs.
of Test depth (Cm)
(Lit/s) percentage of piles
of Test (Cm) (Lit/s) percentage of piles
1 9.5 16 No piles 13 11.5 20 No piles
2 9.5 16 30% 14 11.5 20 30%
3 9.5 16 50% 15 11.5 20 50%
4 9.5 16 70% 16 11.5 20 70%
5 9.5 16 80% 17 11.5 20 80%
6 9.5 16 90% 18 11.5 20 90%
7 10.5 18 No piles 19 12.5 24 No piles
8 10.5 18 30% 20 12.5 24 30%
9 10.5 18 50% 21 12.5 24 50%
10 10.5 18 70% 22 12.5 24 70%
11 10.5 18 80% 23 12.5 24 80%
12 10.5 18 90% 24 12.5 24 90%
Before each test, the bed was aligned at all parts using a trowel and the bed bottom was considered as the base. Then, without turning on the pump, first the water flow entered into the flume and the depth adjust valve was adjusted to increase the height of the water on the flume bed so much that the bed material scouring would not occur due to the high shear stress through turning on the pump in the time required to adjust the flow. After the water in the flume covered the bed, the pump was turned on and the desired flow rate was provided by gradual unhitching the valve. After conducting each test, the pump was turned off and raising the depth adjust valve, it was allowed to drain the water slowly until reading the bed
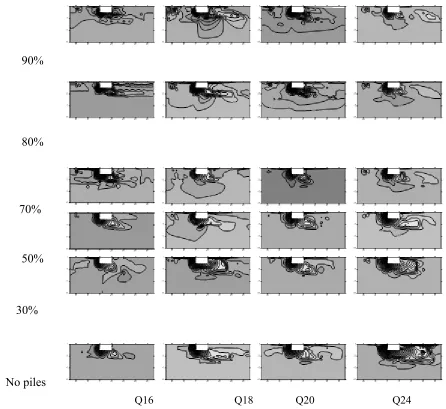
Q16 Q18 Q20 Q24
Fig. 6. Bed profile at different flow rates and different submergence percentages
3. Results and Discussion
Two different types of tests are conducted including changes in flow rate and changes in the pile submergence percentage. The test was conducted so that the fulcrum was first tested alone in four flows of (16, 18.20, and 24) into the flume and the coordinates of its hole were measured and recorded. Then, putting seven piles with different submergence percentages at a distance of 2 times the length of the fulcrum (constant) at the fulcrum upstream, the tests were repeated. The characteristics of all tests
parameters are presented in table 1. The tests showed that preliminary scour has progressed very rapidly and about 60% maximum scour depth occurs about 20 minutes at the beginning of the test, but the speed decreases over time. At the beginning, the scour started from the upstream side of parallel edge of the flow and was gradually expanding to the downstream. The flow had a direct impact on the dimensions of the scour hole and sedimentation and by reducing the flow, scour was removed from the flume upstream wall and the sediment was also shortened. There was no sediment 90%
80%
70%
50%
30%
good balance with very minor differences. Finally, by placing piles at a distance twice the length of the pier, as well as changes in the submergence percentage of piles, bed profile was taken and the maximum depth and volume of scour in the tests were compared. Finally, it was observed that a higher percentage of submergence piles has a significant effect on reduction of volume and the maximum depth of scour and when 90% of the pile is submerged, the flow of the greatest decrease in the maximum depth
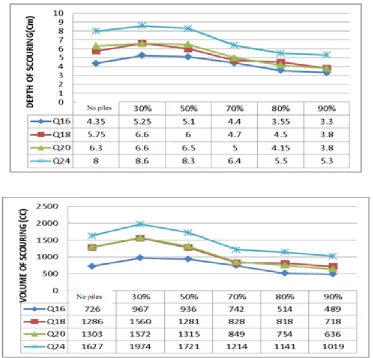
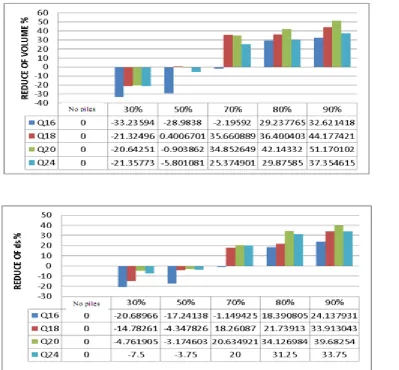
not happen, but also scour increase occurs compared to the case without piles. In the diagram in figure 7, the maximum scour depth and scour volume are shown according to the different pile submergence percentages. In figure 8, the percentage of volume reduction and the maximum scour depth in the different percentages of pile submergence are shown according to the fulcrum. As can be seen, the maximum decrease percentage is related to the submergence percentage of 90%.
Fig. 8. The diagram of reduce of volume and the maximum scour depth according to the submergence percentages of piles
4. Results
The results showed that the maximum volume reduction and the maximum depth of scour occurs when the pile with 90% submergence percentage, and the rate of volume reduction and the maximum scour depth increases through the increase of flow. The use of piles reduces the volume of scour from 18% to 80% and also reduces the maximum depth of scour from 18% to 70% and the maximum number of submergence percentage is 90% and the minimum number of submergence percentage is 30%. In this submergence percentage and submergence percentage of 50%, not only there is no local
scour reduction, but also there is an increased scour. Thus, to use submerged piles, it should be noted that the decrease in the pile submergence at a certain range reduces the scour and if the submergence percentage is less than that, not only scour reduction but also scour increase will be observed.
REFERENCES
dimensions of rectangular collar in the pier scour reduction”, Journal of Soil and Water Science, Volume 19, No.1.
[3] Mahbodi, A., Attari, J., Majdzadeh Tabatabaei, M.R. (2010). “Laboratory study of scour control resulted from horizontal submerged jets using stile”, Ferdowsi University of Mashhad, Iran. [4] Poorhadi, M. H., Ghodsian, M.
(2001).“protection of bridge fulcrum and breakwaters against local scouring”, International Conference on Hydraulic Structures, Department of Civil Engineering, Faculty of Engineering, Shahid Bahonar University of Kerman. [5] Agakhani Afshar, A.H., Maghfoor Maghrebi,
M.; Ismaili, K. (2010).“Evaluation of the effect of pier crack and abutments geometry on the reduction of local scour”, Fifth National Congress of Civil Engineering, Ferdowsi University of Mashhad, Iran.
[6] Beheshti, A.A., Atai Ashtiani, B. (2008). “Numerical investigation of flow and scour pattern around the pile group”, Forth National Congress on Civil Engineering, Tehran University.
[7] Pirayesh, A., Sanei. M. (2011). “The impact of the distance of pile group from the bridge fulcrum in the reduction of local scour”, Tenth Iranian Conference on Hydraulics, University of Guilan,.