© Strojniški vestnik 47C2001 IB,51 2-51B ISSN 0 0 3 9 -2 4 B 0
UDK 5 3 6 .2
Izvirni znanstveni članek C1.01 )
© Journal of Mechanical Engineering 471200138, 512-51S ISSN 0 0 3 9 -2 4 B 0 UDC 5 3 B .2 Original scientific paper C1 .01D
E N E R G Y O P T IM IZ A T IO N O F T H E Y A N K E E -H O O D D RYER
S e lb Ö n el and GQniz G iiriiz
D ep artm en t o f C hem ical E n g in eerin g M iddle E ast T echnical U niversity
A n k ara, 06531 T urkey
ABSTRACT
The Yankee-Hood dryer is the crucial section o f the paper machine due to the consumption o f energy. As a consequence o f continuously increasing energy costs, determination o f the proper operating conditions is essential to operate the tissue machine in the most efficient and economic means while ensuring paper quality. The objective o f this study is to evaluate the Yankee-Hood dryer in 'tpekkagif tissue paper factory, set the mass and energy balances and make optimization studies in order to achieve the desired production rate whilst keeping the drying parameters within limits at the minimum energy costs.
The approach to solve the problem is to develop a steady state analytical model. The complicated drying system is simplified as the overall and sub systems. Material and energy balances are set up for each system. Data o f machine parameters at several paper grades are collected at the factory during production. Material and energy balance equations are solved with the available data for the unknown parameters and for the determination o f the drying parameters most effective on energy consumption. The critical drying parameters are air supply velocity, wet- and dry-hood temperatures, steam pressure in cylinder and exhaust humidity. Efficiency, defined as the ratio o f energy required to evaporate the water to energy input through the system boundaries, is calculated as 28-30% for different grades o f tissue paper production..
Steady state rate o f heat transfer to the wet sheet is analyzed considering the two-way mechanism, from steam through the cast iron shell and from heated air. The transfer o f heat is eased in both mechanisms by the lightweight tissue paper that has a comparatively lower internal thermal resistance with respect to other types o f paper products. Steam side is modeled considering different thermal resistances in series: Condensate layer, shell, shell-sheet contact, and paper sheet. These resistances are to the same order o f magnitude, cast iron shell being the largest and paper sheet the smallest in value. Sheet- shell contact heat transfer coefficient is strongly dependent on sheet moisture content that is assumed to vary almost linearly
due to the angular position on the Yankee. Air side heat transfer is mostly affected by the temperature, humidity and velocity of the air that is blown on to the sheet. Calculations resulted out that rate ofheat transfer front air side is 55-65% while that from steam side is 35-45% o f their total indicating the dominance of air side on drying.
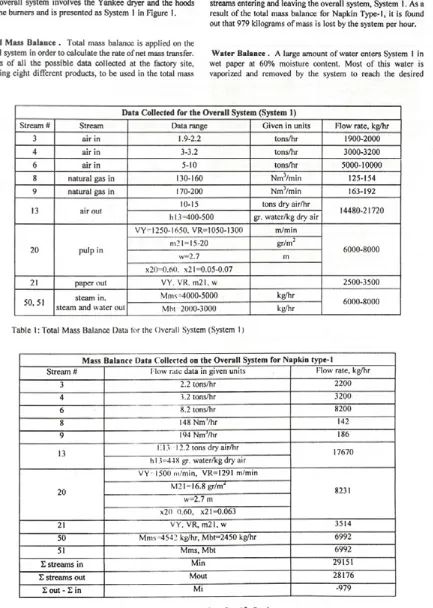
3,4,6: Inlet air 13: Exhaust air 8.9: Natural Gas 20 : Wet paper 21 : Dry paper out
50 : Steam 51 : Steam and condensate out
Figure 1: System 1, Yankee Dryer and the Hood
□ 1 -B M U sfuM iiK
gnnaigfJM Otll& ail
MASS BALANCE System 1: Overall System
The overall system involves the Yankee dryer and the hoods with the burners and is presented as System 1 in Figure 1.
Total Mass Balance . Total mass balance is applied on the overall system in order to calculate the rate o f net mass transfer. Ranges o f all the possible data collected at the factory site, involving eight different products, to be used in the total mass
balance are presented in Table 1. Table 2 involves the machine parameters for the specific product and the flow rate o f the streams entering and leaving the overall system, System 1. As a result o f the total mass balance for Napkin Type-1, it is found out that 979 kilograms o f mass is lost by the system per hour.
Water Balance . A large amount o f water enters System 1 in wet paper at 60% moisture content. Most o f this water is vaporized and removed by the system to reach the desired
Data Collected for the Overall System (System 1)
Stream # Stream Data range Given in units Flow rate, kg/hr
3 air in 1.9-2.2 tons/hr 1900-2000
4 air in 3-3.2 tons/hr 3000-3200
6 air in 5-10 tons/hr 5000-10000
8 natural gas in 130-160 NnrVmin 125-154
9 natural gas in 170-200 Nm3/min 163-192
13 air out 10-15 tons dry air/hr 14480-21720
hi 3-400-500 gr. watcr/kg dry air
20 pulp in
V Y -1250-1650. VR=1050-I300 m/min
6000-8000
m21 = 15-20 gr/m2
w=2.7 m
x20=0.60. x21=0.05-0.07
21 paper out VY. VR. m21, w 2500-3500
50,51 steam in. steam and water out
Mms =4000-5000 kg/hr
6000-8000
Mbt 2000-3000 kg/hr
Table 1: Total Mass Balance Data tor the Overall System (System 1 )
Mass Balance Data Collected on the Overall System for Napkin type-1
Stream # Flow rate data in given units Flow rate, kg/hr
3 2.2 tons/hr 2200
4 3.2 tons/hr 3200
6 8.2 tons/hr 8200
8 148 Nm'/hr 142
9 194 Nm ’/hr 186
13 K13 12.2 tons dry air/hr 17670
h 13=448 gr. water/kg dry air
20
VY = 1500 m/min, VR=I291 m/min
8231 M21 = 16.8 gr/m2
w=2.7 m x20 O.60. x21=0.063
21 VY. VR, m21, w 3514
50 Mms-4542 kg/hr, Mbt=2450 kg/hr 6992
51 Mms, Mbt 6992
E streams in Min 29151
£ streams out Mout 28176
£ out - E in Mi -979
Table 2: Total Mass Balance Data on the Overall System for a Specific Product
□ 1 - 3
moisture content o f the product, usually around 6%. Generally, the wet hood removes 55% o f the total amount o f water removed out o f paper while the dry hood removes the remaining 45%. Table 3 presents the rate o f water removal in kilograms per hour basis for a specific product.
Rate of Water Removal (Drying) for a Product
Product type Napkin Type-l Symbol
Pulp fed, kg/hr 8231 M20
Paper produced, kg/hr 3514 M21
Water removed, kg/hr 4717 Wr
Table 3: Water Removed out o f Wet Paper per hour during Yankee-Drying
Natural gas is assumed to be dry and pure methane. 100% Conversion takes place due to the single reaction o f methane with oxygen. The combustion reaction considered is:
CH„ + 2 0 2 • * C02 + 2H20 .
The amount o f water produced at the wet- and dry-bumers is referred as the water generated. In general, temperature o f the dry side must be slightly higher than the wet side due to the drying requirements. It is more difficult to remove the water out of the wet paper as it gets dried and the water remained is the molecules that have attached to the cellulose fibers (Lehtinen, 1992). Therefore, the amount o f fuel fed to the dry side is more than that fed to the wet side thereby causing the generation of more water in the dry hood.
Water Balance on the Overall System (System 1)
Stream # Stream Napkin Type-1 k g /h r
3 in 3
4 in 4
6 in 10
8 in 0
9 in 0
13 out 5466
20 in 4938
21 out 221
50 in 6992
51 out 6992
Wet side burner generation 313
Dry side burner generation 410
Win 11947
Wgen 723
Wout 12679
( Win+Wgen) -Wout -9
Tabic 4: Water Balance on theOverall System
Table 4 indicates that fresh air entering in streams 3 ,4 and 6 has almost negligible contribution in the overall water balance. Rate o f net water transfer through system boundary is 9 kilograms per hour, which is negligible making an order o f magnitude comparison.
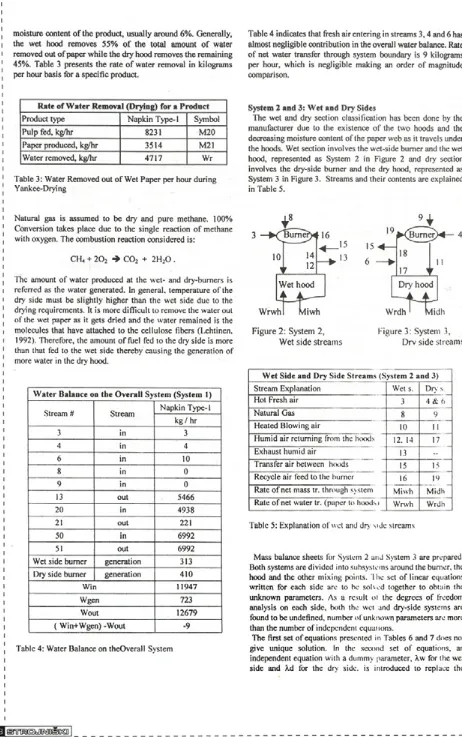
System 2 and 3: Wet and Dry Sides
The wet and dry section classification has been done by the manufacturer due to the existence o f the two hoods and the decreasing moisture content o f the paper web as it travels under the hoods. Wet section involves the wet-side burner and the wet hood, represented as System 2 in Figure 2 and dry section involves the dry-side burner and the dry hood, represented as System 3 in Figure 3. Streams and their contents are explained in Table 5.
Figure 2: System 2, Figure 3: System 3, W et side stream s Drv side stream s
Wet Side and Dry Side Streams (System 2 and 3)
Stream Explanation Wet s. Dry s
Flot Fresh air 3 4 & 6
Natural Gas 8 9
Heated Blowing air 10 11
Humid air returning from the hoods 12. 14 17
Exhaust humid air 13
-Transfer air between htxtds 15 15
Recycle air feed to the burner 16 10
Rate o f net mass tr. through system Miwh Midh
Rate o f net water tr. (paper to hoods i Wrwh Wrdh
Table 5: Explanation o f wet and dry side streams
Mass balance sheets for System 2 and System 3 are prepared. Both systems are divided into subsystems around the burner, the hood and the other mixing points. 'I he set of linear equations written for each side are to he solved together to obtain the unknown parameters. As a result ol the degrees of freedom analysis on each side, both the wet and dry-side systems are found to be undefined, number of unknown parameters are more than the number of independent equations.
The first set o f equations presented in Tables 6 and 7 does not give unique solution. In the second set o f equations, an independent equation with a dummy parameter, A.w for the wet side and h i for the dry side, is introduced to replace the
dependant equation. Xw is the mass fraction o f stream 13 (exhaust stream) in stream 12 (recycle stream). Xd is the mass flow ratio o f stream 18 (part o f the dry-side recycle stream that is fed with hot fresh air), to stream 19 (final part o f the recycle stream that is fed to the burner). The Xw and Xd values are
determined as 0.48 and 0.75 respectively by solving each side using the design values. Results for the unknown mass flow rates are presented in Tables 8 and 9. Solutions o f each side are compared for the flow rate o f air transfer stream, M l 5, and for the validity o f the mass flow rate o f each stream.
Mass Flow Rate Parameters and Equations in the Wet Side Mass Balances
Known Unknown Set o f Equations I Set o f Equations 2: Solution with Xw
M3 MIO M10=f(M12,Miwh, Wrwh) M 10=f(Ml 2,Miwh, Wrwh)
M8 M12 M 12=flM 13,Ml4) M12=f(M13, Xw)
M13 M14 M14=f(M15,Ml6) M14=f(M12,M13)
Mi M15 M 15=f(M3,M8,M 13,Miwh, Wrwh) M15=f(M14,M16)
M16 M16=f(M3.M8,M10) M16=f(M3,M8,M10)
Miwh Miwh=f(Mi,a) Miwh=f(Mi,a)
Wrwh Wrwh=f(Wr,ß) Wrwh=f(Wr,ß)
Table 6: Wet Side Mass Balance Flow Rate Parameters and Equations
Mass Flow Rate Parameters and Equations in the Dry Side Mass Balances
Known Unknown Set o f Equations 1 Set o f Equations 2: Solution with Xd
M4 M il M l l=f(M17,Midh,Wrdh) M ll=f(M17,M idh. Wrdh)
M6 M15 M l 5=f(M4,M6,M9,Midh, Wrdh) M15=f(M18,M19) or M15=f(M4,M6,M9,Midh, Wrdh)
M9 M17 M17=f(M6,M18) M17=f(M6,M18)
Mi M18 M18=fl;M15,M19) M18=f(MI9, Xd)
M19 M19=f(M4,M9,Ml 1) M 19=f(M4.M9,M 11 )
Midh Midh=f(Mi,a) Midh=f(Mi,a)
Wrdh Wrdh=f(Wr,ß) Wrdh=f(Wr,ß)
Table7: Dry Side Mass Balance Flow Rate Parameters and Equations
Mass Flow Rates of the Wet Side Streams, Xw=0.48
Known kg/hr Unknown kg/hr
M3 2200 M10 34700
M8 142 M12 36800
M13 17670 M14 19140
Mi -979 M15 13220
M16 32360
Miwh -490
Wrwh 2594
Table 8: Mass flow rates o f the wet side streams calculated for Xw=0.48 (System 2)
Mass Flow Rates of the Dry Side Streams, Xd=0.75
Known kg/hr Unknown kg/hr
M4 3200 M il 34700
M6 8200 M15 13220
M19 186 M17 44680
Mi -979 M18 52880
M19 39660
Midh -490
Wrdh 2123
Table 9: Mass flow rates o f the dry side streams calculated for Xd=0.75 (System 3)
Hood Operation Depending on Design Values Wet-Side (mass %) Dry-Side (mass %) Total (kg/hr)
Water removed by each hood 55 45 4885
Air infiltration by each hood 50 50 4000
Total infiltration by each hood 53 47 8885
Table 10: Hood operation depending on design values
I mTFftBXJRmtaren MW =1
The hoods not only remove the water in wet paper, but infiltrate air during the suction operation. Fraction o f net mass transfer through wet-section boundaries is shown as a and fraction of wet section water removal in total (Wr) is shown as ß. Using design data, a and ß are found as 0.50 and 0.55. In total, wet hood infiltrates approximately 53% o f the mass and dry hood infiltrates the remaining 47%. The percent removal of water, infiltration o f air and their total is presented in Table 10.
ENERGY BALANCE System 1: Overall System
Overall energy balance is applied on the system in Figure 4. The aim is to calculate the rate o f net heat transfer Q, energy required to evaporate and remove the water out o f the wet paper, and efficiency o f the system under the given conditions. The ranges o f the available intensive parameter data for the production o f several different tissue paper types are presented for each stream in Table 11.
3 ,4 ,6 _ Air T3
9 , 8 Natural Gas T8, P8
13
CU4+2O2 -> CO2 +2H20
20
Pulp . Water
120
n
50Steam T50. P50
~fcr, Water vapor T13
> Q
- 51Steam T51, P51
21 Pulp, Water T21
Figure 4: System I, Overall system (cylinder, hoods, burners)
Wet paper entering Yankee cylinder is assumed to be 30°C and 60% water. Product stream temperature, T21, is constant and around 92°C. Fresh air in streams 3, 4 and 6 is heated up to T3°C at the first heat exchanger before it is fed to the system. Energy generation is due to combustion assumed to be taking place with 100% conversion at the reaction temperature. Trxn.
Data and results o f the overall energy balance for a specific product are shown in Table 12. As a result, on the order o f 106 kilo-joules heat is lost by the system per hour. The rate o f heat energy required to evaporate the water in the wet paper at the average paper temperature (T21) is found as 1.074* 107 kilo joules per hour for Napkin type-1.
Data Collected for the Overall System (System 1)
Stream # Property Data Range
Air in 3,4,6 T3=T4=T6 130-160 °C
Natural gas in 8,9 T8=T9, P8=P9 10-35°C,-1 .4 bar
Air out 13 T13 270-290 °C
Wet paper in 20 T20 -3 0 °C
Dry paper out 21 T21 85-98 °C
Steam in 50 P50 8-9.8 bar
Steam-water out 51 T51 170-180 °C
Combustion Bumers Trxn 350-460 °C
T able 11 : Data for the Overall System (System 1)
Overall Energy Balance for Napkin Type-1 (System 1)
Stream # Temperature (°C) Pressure (bar)
Heat tr. Rate ( k J /h r )
3 ,4 ,6 273 1.721*106
8 ,9 29.1 1.4 3.095*103
In 20 30 6.451* 10s
50 9.5 1.941 * 107
Total in 2.178*107
Generation burners 458 1.645* 107
13 286 1.848* 107
Out 21 92 5.006* 105
51 177 1.444* 107
Total out 3.342* 107
Rate of net heat loss through sys. boundary, Q 4.807* 106
Energy required to remove water at T 2 1, Hv 1.074* 107
Efficiency 28.1 %
Table 12: Energy Balance on System 1 for a Specific Product
System 4: Paper-Hood Interface
Only the hood and paper is involved in System 4. Energy balance and temperature data sheet is presented in fable 13. Summary of the mass and energy balance results on System I and System 2 is shown in fable 14.
Energy Balance at the Shell-Hood Interface (System 4)
Heat
transferred Stream Temp«
f° ■rature □ __ Symbol
Heat tr. Rate (kJ/hrt
By entering streams
20 T20 30 H20 6.451E+5
50 T50 177 H50 1.941E+7
10 T10 452 i 1110 3.822E+7
11 T il 456 l l l l 3.94E+7
By leaving streams
21 T2I 92 H21 5.006E+5
51 T50 177 1151 I.444E+7
12 112 337 1112 3.831E+7
17 T17 365 HI 7 3.621E+7
By net mass transferred
Miwh TI0 452 HMiwh -2.187E+5
Midh T il 456 HMidh -2.208E+5
Rate of net heat tr. through sys. boun. Q -7.774E+6
Table 13: Data and Energy Balance at Paper and Hood Interface (System 4)
Comparison of Systems 1 and 4
Rate of net transfer through system boundary (Napkin Type-1 )
System Heat (kJ/hr) Mass (kg/hr)
System 4:Cylinder+hood+bumers -4.807E+6 -979.422
System 5:Cylinder-hood interface -7.774E+6 -976.989
Table 14: Comparison o f the Energy and Mass Balance Results for Systems 1 and 4
Table 14 indicates that, rate o f net mass transfer in both systems is almost the same meaning that net mass transfer is mainly controlled at the paper surface-hood interface. Rate of net heat transfer is to the same order o f magnitude in both systems. It is greater for System 4 due to the lower temperature reading of the recycle streams 12 and 17and higher reading of the blowing streams. Since the pipe lines transferring air are long, there is temperature variation along the line.
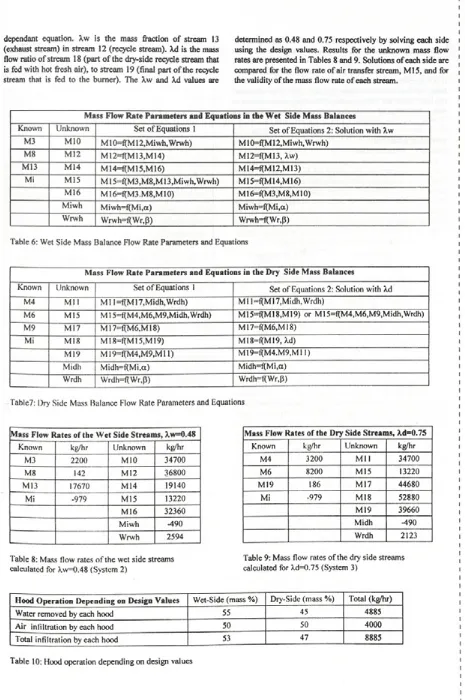
Heat Transfer Between Steam and Web
Transfer of heat to paper by two mechanisms, conduction from steam and convection from air, is represented in Figure 5. Resistances in series are condensate, shell, shell-paper interface, and paper (Chance, 1989). The effect o f each thermal resistance on the overall heat transfer is to be determined. Heat transfer between these layers significantly affects overall drying rate.
condensate shell interface
Figure 5: Thermal resistances and the two-way heat transfer
Paper sheer sticks on the Yankee cylinder at 0=0° and wraps 314° as shown in Figure 6. Hood region starts at 0=22° and dry hood starts at 164°. Totally the hood wraps 257°.
Figure 6: Angular View o f the Yankee Cylinder
Paper is assumed thin enough that temperature and moisture content variation in thickness direction is unimportant (Karlsson and Heikkila. 1987). Circumferential sheet temperature increases in machine direction, but it is assumed to be uniform (Ahrens, 1995). Moisture profile is plotted assuming it decreases l inearly with wrap angle 0 (MC(0)) in the hood region as paper eels dry (Lindeborg, 1982; Ahrens, 1995). Heat transfer coefficient o f shell-web interface, is a function ol moisture content:
hint(0 ) a i P (1)
I MC(0 )
a and p arc 198.7 and 4542 W/m2K respectively (Ahrens, 1995). Paper conductivity, kp(0) is assumed to change linearly between 0.216 and 0.144 due to Han’s calculations for tissue
i i i i i i i I paper (Seyed-Yagoobi et al., 1992). Steam condensing heat i transfer coefficient, hcond, is determined approximately i considering the rimming condition due to high speeds o f the 1 Yankee cylinder, 1200-1700 m/min and the respective values found in literature (Wilhemsson et al., 1996; Ahrens, 1995, | Appel & Hong, 1969). Blowing air heat transfer coefficient, ha, l is assumed to be constant and 227.1 W/m2K (Ahrens, 1995) due 1 to the fact that it is 25-250 W/m2K for gases in forced convection (In ero pera & De Witt, 1990). Figure 7 and Table 15 , indicate that dryer shell is the largest and paper web is the i smallest resistance to heat transfer. Overall thermal resistance 1 for conduction, R, is calculated as a function o f the wrap angle 1 using the equation for resistances in series:
i R(0) = R 1 + R 2 + R3(0) + R4(0) (2) i I
The conduction of heat from steam to paper (Qstp) and the convection o f heat from air to paper (Qap) are calculated as | point values at each angle on the paper sheet. The total amount i of heat supplied by both mechanisms is calculated by taking the 1 sum over the wrap angle ranges specified in Table 16.
0.004
Figure 7: Thermal Resistances versus Wrap Angle
Thermal Resistances Affecting Overall Heat Tr. Rate
Conduction Convection
Thick. (mm)
Heat Tr. Coef.
Ther. Resistivity (W/m2K)*lOJ
Wrap-angle. 0 degrees
0 22 164 279
Steam-cond. 4-8 hcond Rl 5.0 5.0 5.0
Dryer shell 48.6 kshell R2 9.8 9.8 9.8 Shell-web hint(0) R3(0) 1.5 4.6 19.4
Paper web 0.02 kp(0) R4(0) 0.9 l.l 1.3
Blowing Air ha I/ ha 44.0 44.0 44.0
Table 15: Conduction and Convection Resistances
Effects of Conduction and Convection for Napkin Type-1
Heat Transfer Direction Wrap Angle (0 degrees) Symbol
Heat given (kj/hr) from air to paper 22-»279 Qap 8.129*10'’
from steam to paper 0^314 Qstp 4.816*10ò
from steam to cylinder 314-^360 Qstc 0.325* 10°
Heat transferred to paper (Qap-i Qstp) Qp 1.295*10'
Heat required to vaporize water (Wr) Hv 1.074*10°
Table 16: Effects o f Conduction and Convection on Drying
I f=ffTl^)(5yj)o^iti&s[]____________
s tra n 5 1 7 [mE ShMkI
i
The results presented in Table 16 indicate that 6% o f the heat supplied by steam (2.5% o f the total heat) is lost through the uncovered bottom part, 46°, o f the cylinder. 62.8% o f the heat given to paper is from air while 37.2% is from steam. Steam and air contribution in the total heat supplied is 36.3% and 61.2% respectively.
Wrap Angie (degrees)
Figure 8: Heat Transfer Rate Point Values vs Wrap Angle (22° to 279°) at Blowing Air Temperatures 350, 400, 450, 500° C
For different blowing air temperatures within acceptable ranges, variation o f the point values o f heat transfer to paper sheet is presented in Figure 8. The points covered by the hood is considered only. Rate o f heat supplied by steam is not affected. Rate o f heat transferred from air side increases.
Seminar Notes: Practical Aspects o f Pressing and Drying, Atlanta, USA, voi 62, pp. 121-137.
Incropera, F.P. & De Witt, D.P., 1990, Fundamentals o f Heat and Mass Transfer, p. 9, John Wiley & Sons, Singapore.
Karlsson, M. & Heikkila, P„ 1987, Computer Simulation of Yankee Drying, Drying '87, A.S. Mujumdar, Ed., Hemisphere, Washington, pp. 194-202.
Lehtinen J., 1992, The Heat Pipe Process in Intraweb Heat Transfer in Hot Surface Paper Drying, Paperi ja Puu-Paper and Timber, vol. 74, pp. 560-571.
Lindeborg C., 1982, A Method for Analysis o f Cross-Direction Drying Performance in a Paper Machine, TAPPI Journal, voi. 65, pp. 119-122.
Schukow V. & Ileberl A., 1988, Humidity and its Effect on Thermal Efficiency o f Yankee Hoods, Tappi Journal, voi. 71, pp. 68-70.
Seyed-Yagoobi J.. Ng K.H., Fletcher L.S., 1992, Thermal Contact Conductance o f a Bone-Dry Paper Handsheet/Metal Interface, Journal o f Heat Transfer, Transactions o f ASME. vol. 114, pp 326-330.
Tamawski W.Z., Mitera J., Borowski P., Klepaczka A., 1996, Energy Analysis on Use o f Air and Superheated Steam as Drying Media, Drying Technology, voi. 14, pp. 1733-1749.
Toivonen K., 1982, Yankee Drying o f Soft Tissue Paper. Svensk Papperstidning, voi. 85, pp. R 107-R I14.
Wilhemsson B., Stenstrom S.. Nilsson L.. Krook R., Persson H., Wimmerstedt K., 1996, Modeling Multicylinder Paper Drying - Validation o f a New Simulation Program. TAPP! Journal, voi. 79, pp. 157-167.
ENERGY O PTIM IZA TIO N
The same final product can be produced by changing different drying parameters and keeping the rate o f paper production constant. With reference from literature, the most effective drying parameters are the air supply velocity in each end o f air cap (blowing air velocity), hood temperatures, steam pressure in cylinder and exhaust air humidity (Tamawski et al., 1996; Schukow et al., 1988; Toivonen,1982). Total energy, ET, can be written as a function o f the drying parameters:
ET = fl(blow vel.) + f2(steam P) + f3(air T, exhaust hum) (3)
Energy consumption is from three different sources used in the system: Natural gas, steam and electricity. Gas consumption is a function o f the blowing air temperature and exhaust humidity. Steam consumption is a function o f the steam pressure in the cylinder. Electricity consumption is a function o f the blowing air velocity. Contribution o f gas in the total energy use is more. In general, energy from gas is about 50-60%, energy from steam is 40-50%, and energy from electricity is 5-10% o f the total consumption.
REFERENCES
Ahrens F.W., 1995, Effect o f Shell Thermal Dynamics on Predictions o f a Yankee Dryer Model, ASME Heat Transfer Division, vol. HTD 317-2, pp. 427-435.
Appel D.W. & Hong S.H., 1969, Condensate Distribution and Its Effects on Heat Transfer in Steam-Heated Dryers, Pulp Paper Magazine Canada, voi. 70, p 66.
Chance J.L., 1989, Overview o f the Dryer Section, Tappi