INNOVATION IN
HEALTH INFORMATICS
Connecting medical records: an evaluation
of benefits and challenges for primary care
practices
Deborah R. Compeau
Department of Management, Information Systems, and Entrepreneurship, Carson College of Business, Washington State University, Pullman, WA, USA
Amanda L. Terry
Department of Family Medicine, Centre for Studies in Family Medicine, Schulich School of Medicine and Dentistry, The University of Western Ontario, London, ON, Canada, and Department of Epidemiology and Biostatistics, Western Centre for Public Health and Family Medicine, Schulich Interfaculty Program in Public Health, Schulich School of Medicine and Dentistry, The University of Western Ontario, London, ON, Canada
AbstrACt
background Implementation of systems to support health information sharing has lagged other areas of healthcare IT, yet offers a strong possibility for benefit. Clinical acceptance is a key limiting factor in health IT adoption.
Objectives To assess the benefits and challenges experienced by clinicians using a custom-developed health information exchange system, and to show how perceptions of benefits and challenges influence perceptions of productivity and care-related outcomes.
Methods We used a mixed methods design with two phases. First, we con-ducted interviews with stakeholders who were familiar with the health information exchange system to inform the development of a measure of benefits and chal-lenges of the use of this system. Second, using this measure, we conducted a sur-vey of current and former users of the health information exchange system using a modified Dillman method. Data were analyzed using structural equation modelling, implemented in partial least squares.
results 105 current and former users completed the survey. The results showed information quality, ease of completing tasks and clinical process improvement as key benefits that reduced workload and improved patient care. Challenges related to system reliability, quality of reports, and service quality increased workload and decreased impact on care, though the effect of the challenges was smaller than that of the benefits.
Conclusion Even very limited health information exchange capabilities can improve outcomes for primary care users. Improving perceptions of benefits may be even more important than removing challenges to use, though it is likely that a threshold of quality must be achieved for this to be true.
Keywords: computerized medical record, information system, primary care
Research article
Cite this article: Compeau D.R, Terry A.L. Connecting medical records: an evaluation of benefits and challenges for primary care practices. J Innov Health Inform. 2017;24(2):204–215.
http://dx.doi.org/10.14236/jhi.v24i2.855
Copyright © 2017 The Author(s). Published by BCS, The Chartered Institute for IT under Creative Commons license http://creativecommons.org/ licenses/by/4.0/
Author address for correspondence: Deborah Compeau
Department of Management, Information Systems, and Entrepreneurship
Carson College of Business Washington State University Pullman, WA 99163, USA Email: deborah.compeau@wsu.edu
Accepted May 2017
on September 12, 2020 by guest. Protected by copyright.
IntrOduCtIOn
Health information technologies (HIT) offer tremendous potential to improve the quality and cost effectiveness of healthcare. However, projects to implement HIT around the world have met with mixed results.1–4 Central to all the expla-nations for HIT implementation success and failure is clinical adoption.5,6 Various models have been examined including TAM,7 UTAUT8–10 and an integrated model11 based on both TAM and Cenfetelli’s12 dual factors of adoption. In a related research stream, Lau and his colleagues13,14 and van der Meijden and his collegues15 have advanced a benefit evalua-tion framework that also addresses adopevalua-tion issues.
This study examines the clinician’s perceptions of HIT (a common strategy in adoption research), but focuses on their perspectives regarding benefits arising from HIT adop-tion. In this way, this study bridges the two main themes in IS research on HIT identified by Agarwal et al.5: adoption and evaluation. It examines how a health information exchange technology was understood and valued by primary care prac-titioners. This research demonstrates both the potential ben-efits from a provider perspective and the limiting factors that must be addressed in ongoing system development.
The specific goal of the research was to understand the benefits and challenges of ‘PhysicianConnect’ (a pseudonym). PhysicianConnect is a technology designed to share data about patients between hospitals and primary care physicians. Sharing of data through IT remains a particular challenge in e-health. A recent survey16 showed that while primary care phy-sicians have excellent adoption of electronic medical records (EMR) (i.e. internal systems), only about half routinely share information with other providers in an electronic format, even in countries where EMR adoption rates are 98%.
Two characteristics of PhysicianConnect are of particular importance to note. First, only three types of reports are sent through PhysicianConnect: results of in-hospital laboratory tests, in-hospital diagnostic imaging and discharge summaries for patients. Non-hospital-based laboratory tests or diagnostic images are not included nor are detailed patient reports for admitted patients. Second, the flow of data is one way; no data from the primary care EMR is shared with the hospital informa-tion system.
PhysicianConnect was developed in a bottom-up fashion. It was initiated by a physician and a hospital CIO, who saw an opportunity to connect their systems. It was designed using very simple technologies as a custom add-on to existing sys-tems. It did not attempt to identify all of the possible data that a physician might want from a hospital information system, nor did it attempt to include other organizations from which primary care physicians received data, such as private labo-ratories. Regardless, it demonstrated the potential to connect systems, even in a rudimentary way, in order to avoid pro-cessing paper documents. After about two years, the hospital sought additional funding to expand the program to all phy-sicians in its catchment area and to do some ‘recalibrating and adjusting’ of the system based on experience in work-ing with it [interview with PhysicianConnect technologist].
Funding was provided by a government agency with the aim of expanding it beyond the initial hospital to two other hospital groups that existed within the region that had been develop-ing a similar interface. The project ultimately expanded in four phases so that by the time of this research, the hospitals had been using it for at least 2 years, with individual physicians having access for a few months to 2 or more years.
MethOds
The study was conducted in two phases, using a mixed-meth-ods design.17 During the qualitative phase, semi-structured interviews were conducted with two primary care physi-cians who had adopted the technology, two of their admin-istrative staffs and one hospital IT manager who supported PhysicianConnect. A group interview was also conducted with three staff members at the government agency that funded and supported the project. Respondents were asked to explain when/how they had become PhysicianConnect adopters and how they had conducted various tasks related to the receipt of reports before and after the implementation and to identify the various benefits and challenges that they perceived related to the use of PhysicianConnect. Interviews were tape recorded and transcribed. Data were coded to identify salient benefits and challenges.
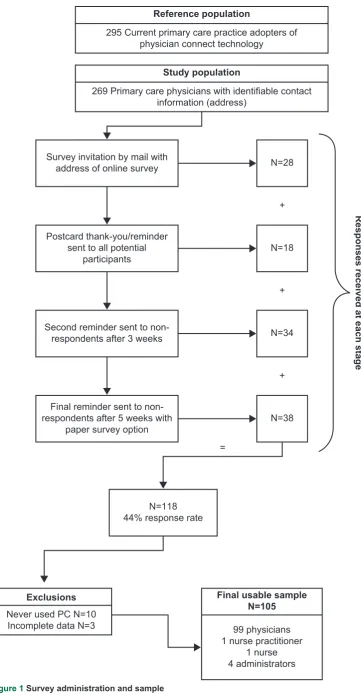
In the quantitative phase of the study, the benefits and chal-lenges identified in phase one were used to develop a survey that was sent to all registered physician users of PhysicianConnect. The questionnaire included 12 items regarding benefits and 13 items focused on the challenges, all measured on a five-point scale. In total, 295 surveys were sent using an adapted Dillman method.18 Figure 1 shows the steps in the survey administra-tion and the responses received at each stage.
Based on the results of the interviews and a review of prior literature, a model for assessing the benefits of PhysicianConnect was constructed (Figure 2). The dual fac-tor model represents the benefits (enablers) and challenges (inhibitors) as second-order latent constructs.19 Benefits are composed of three first-order factors: information quality, pro-cess improvement and ease of completing tasks. Challenges are composed of four first-order factors: reliability, report qual-ity, number of reports and service quality. Dual-factor models are built on the premise that inhibitors influence behaviour differently than enablers and must, therefore, be examined separately. While increasing or decreasing an enabler is expected to promote or inhibit more use, removing an inhibi-tor does not necessarily promote more usage but simply does not discourage it.12,20 This model was assessed in the sec-ond phase of the study. Four hypotheses were tested, linking the benefits and challenges to each of the clinical outcomes.
The model was tested using SmartPLS,21 following the Wetzels et al.22 approach for second-order factors. Box 1 pro-vides a more detailed explanation of the partial least squares (PLS) method. The analysis proceeded in three stages: assessment of first-order measurement model, second-order measurement model and structural model. The seven first-order factors, modelled as reflective constructs, were assessed
on September 12, 2020 by guest. Protected by copyright.
http://informatics.bmj.com/
box 1 structural equation modelling (seM) using PLs – an explanation of the method
PLS is a SEM technique, first developed by Lohmöller (1989). Broadly speaking, SEM tools allow researchers to assess complex relationships between constructs such as attitudes (including direct and indirect relationships) and to simultaneously assess the relationships between constructs and the questionnaire items that are designed to measure them. This holistic assessment of a complete model fits with contemporary views of theory and measurement, where theoretical concepts are deemed to derive part of their meaning from the way they are assessed and by the theoretical model in which they are embedded. In contrast to covariance-based SEM (CB-SEM), the PLS method uses the principals of ordinary least squares (OLS) regression and principal components factor analysis to assess the structural and measurement models.
PLS produces factor loadings (interpreted the same as loadings in factor analysis) to aid in assessment of the measurement model, and standardized regression coefficients to aid in assessment of the structural (path) model. Unlike CB-SEM which uses the assessment of model fit to judge the quality of the models, PLS uses R2 to assess the explained variance in constructs as well as the above-noted statistics.
Because PLS estimates the model iteratively in small portions (thus the term ‘partial’), the sample size requirements are lower than CB-SEM. The sample size requirement is determined as the greater of:
• ten times the number of independent constructs in the most complex regression in the structural model. In our case, the most complex regression involves 2 independent constructs (benefits & challenges) that would demand at least 20 cases.
• ten times the number of items in the construct with the greatest number of measures. In our case, that is process improvements, with 5 items, demanding 50 cases. Most researchers suggest sample sizes greater than 100 are better, as the model estimates can be unstable at very low sample sizes.
In general, the stages of PLS interpretation proceed as follows:
1) Assess internal consistency reliability of constructs. The ICR computed from PLS is similar to Cronbach’s by examining the loadings and cross loadings, and some items were removed to improve measurement quality. The three reflective second-order factors were assessed based on their loadings and cross loadings, internal consistency reliability and discriminant validity. The structural model was assessed using a bootstrapping method with 500 samples. An additional model was run with the second-order factors modelled as formative. The structural model results are similar. The main difference is that only one first-order factor was a significant predictor of the second-order factors, an outcome of the high degree of multi-collinearity between the first order factors.
alpha and can be similarly interpreted – ICR > 0.70 is the common benchmark.
2) Assess convergent and discriminant validity at the item level using the loadings and cross loadings. In general, look for loadings in excess of 0.70 and cross loadings that are significantly lower than the loadings. 3) Assess convergent validity and discriminant validity at
the construct level by looking at the AVE and and inter-item correlations. An AVE > 0.50 implies the construct shares at least 50% variance with its items and this is the common threshold. In practice, the square root of the AVE is reported for ease of comparison with the inter-construct correlations. Thus, the square root of the AVE should be greater than 0.70. For discriminant validity, the square root of the AVE should be higher than the inter-construct correlations, indicating that the construct shares more variance with its measures than it does with other constructs in the model.
4) Assess structural model by examining the significance of the regression coefficients and the substantiveness of the explained variance in dependent constructs. Significance is computed using bootstrapping. Bootstrapping is the preferred method for assessing significance as it does not require conformance to the distributional assumptions of traditional ordinary least squares (OLS) regression and thus produces more robust estimates.
Lohmöller J.-B. Latent Variable Path Modeling with Partial Least Squares, Heidelberg, Germany: Physica, 1989.
resuLts
Interview findings
Participants in the interviews identified both positive and negative aspects of PhysicianConnect as well as numerous outcomes of using it. Appendix 1 summarizes the positive and negative attributes of the system identified along with the key outcomes experienced. For each item, a representative quote from the interviews is shown, along with an explanation of where the item fits within the research model.
Survey results
Of 295 surveys, 26 were returned as undeliverable leaving the potential sample at 269. Of the 118 respondents (44% response rate), three responses had questionable data quality (greater than 20% missingness) and were dropped, leaving 115 responses. Ninety-nine were current users of PhysicianConnect. Six respondents received information via PhysicianConnect but had discontinued their usage, while ten had never used it. No other data were collected from these ten respondents. Our final sample, then, was 105 current and former users. The majority of responses came from users of the three most commonly used EMRs. Ninety-nine surveys were completed by physicians, followed by one nurse, one nurse practitioner and four administrators. They represented each of the three hospital systems who were providing data. They had been using the system for
on September 12, 2020 by guest. Protected by copyright.
http://informatics.bmj.com/
Reference population
295 Current primary care practice adopters of physician connect technology
Responses received at each stag
e
Study population
269 Primary care physicians with identifiable contact information (address)
Never used PC N=10 Incomplete data N=3
Final usable sample N=105
99 physicians 1 nurse practitioner
1 nurse 4 administrators Survey invitation by mail with
address of online survey
N=118 44% response rate
N=28
+
Postcard thank-you/reminder sent to all potential
participants N=18
+
Second reminder sent to
non-respondents after 3 weeks N=34
Final reminder sent to non-respondents after 5 weeks with
paper survey option N=38
+
=
Exclusions
Figure 1 Survey administration and sample
on September 12, 2020 by guest. Protected by copyright.
http://informatics.bmj.com/
tell whether the data are flowing. Three challenges were reported as not being significant concerns. The majority of respondents indicated having had no problems with date for-mats from PhysicianConnect not being compatible with the EMR. Nearly 50% of users reported that they had not expe-rienced or observed an issue with getting too many reports from PhysicianConnect, nor had they been unable to update their EMR because of PhysicianConnect.
Survey – measurement model
First-order factors
For the three first-order factors of benefits, all but two load-ings were above 0.7. The loading for ‘improved ability to search for patient information’ was 0.68, which is very close to the 0.7 threshold, so this item was maintained. The loading for ‘improved legibility compared to paper’ was 0.52. While the item seems to reflect information quality, it clearly did not fit with the other items. One possibility is that most respon-dents were already receiving reports by fax and so were not seeing PhysicianConnect as a replacement for handwriting but rather as a replacement of fax. Regardless, the item was the most variable of all of the benefits items, and since it did not load strongly on the construct, it was dropped.
For the four first-order factors of challenges, the measure-ment model was mixed. The service quality and reliability con-structs both had loadings above 0.7 for each item. The number of reports construct had one very high (0.87) and one very low Ease of
completing tasks Process
improvement
Benefits Impact onworkload
Impact on care Challenges
Information quality
Reliability
Number of reports Report
quality Servicequality
H4 H3
H2
H1
H1: The benefits of using PhysicianConnect will be positively related to impact on workload, such that higher benefits result in a sense of an improvement in workload.
H2: The benefits of using PhysicianConnect will be positively related to impact on care, such that higher benefits result in a sense of an improvement in care-related outcomes.
H3: The challenges of using PhysicianConnect will be negatively related to impact on workload, such that higher challenges result in a sense of a worsening in workload.
H4: The challenges of using PhysicianConnect will be negatively related to impact on care, such that higher challenges result in a sense of a worsening of care-related outcomes.
between one month and five years, with an average usage of 19 months. A comparison of early versus late respond-ers showed no significant differences on the variables of interest.23
Appendix 2 shows descriptive statistics for the survey items. Overall, the responses suggested positive outcomes from the use of PhysicianConnect. All of the means were above the scale midpoint. The most positive effects were for speed of obtain-ing patient results, reduction in filobtain-ing errors and administrative staff workload. Beliefs about the benefits of PhysicianConnect were also generally positive. The most commonly cited benefit from using PhysicianConnect was ease of access to informa-tion. Improved information sharing, greater flexibility in where work can be done, staff ease of response to patient inquires, improved organization of information, improved ability to search for patient information and better follow-up with patients were also widely reported as benefits. Improved legibility of infor-mation was reported by some, but not all respondents. Three benefits were not as widely reported (average was less than 3): ease of creating referrals, updating the cumulative patient profile (CPP) and creating alerts.
The respondents report fewer challenges from using PhysicianConnect than they did benefits, and fewer than expected based on the phase one interviews, though most reported having experienced or observed each challenge. Duplicate reports were most often reported as a significant problem. Two other challenges were reported frequently: lack of support from the EMR vendor and not being able to
Figure 2 Research model and hypotheses
on September 12, 2020 by guest. Protected by copyright.
http://informatics.bmj.com/
table 1 Loadings and cross loadings
Benefits Challenges Impact on workload Impact on care
Information
quality 0.92 −0.32 0.44 0.46
Ease of completing tasks
0.71 −0.27 0.21 0.31
Process
improvement 0.93 −0.24 0.36 0.49
Reliability −0.11 0.65 −0.25 −0.05
Report quality −0.39 0.89 −0.34 −0.47
Service quality −0.13 0.79 −0.22 −0.28
Admin workload 0.23 −0.36 0.79 0.38
Nursing
workload 0.40 −0.26 0.92 0.52
Physician
workload 0.41 −0.31 0.88 0.50
Filing errors 0.37 −0.24 0.28 0.68
Speed of
results 0.37 −0.17 0.38 0.67 Speed of
referrals 0.33 −0.19 0.51 0.67 Report
reordering 0.34 −0.49 0.38 0.79
loading (0.23). Since removing the latter would leave a con-struct with a single item, and since both the number of reports and report quality issues related to the functionality of the sys-tem, the construct was merged with the report quality issues. The construct reflecting report quality had no loadings over 0.7. Examination of the items and reviews of the interview data suggested one possible explanation for this outcome. Several of the items in the report quality item reflected issues with a single EMR product: ‘inability to upgrade’, ‘incompatible date formats’ and ‘reports received in a way that does not enable cut and paste’. Since they were not experienced universally by respondents, they were dropped from the analysis.
The items for impact on workload are all loaded > 0.7. The loadings for the care outcomes construct were weaker, with one loading over 0.7, one loading (errors compared to reports that were scanned) of 0.56 and three items with loadings between 0.65 and 0.7. The higher loading items were retained consistent with prior decisions and the lower one was dropped.
With these modifications, the measurement model was reassessed. All internal consistency reliabilities were above 0.70 and each item loaded more strongly on its own con-struct than on the related concon-structs, indicating adequate
discriminant validity. To proceed to the next phase of the assessment, the factor scores were saved for the first-order dimensions.
Second-order factors
The second-order factors were also modelled as reflective, since they were expected to be highly correlated. The three items reflecting benefits all had loadings (Table 1) greater than 0.7. Two of the three items reflecting challenges had loadings greater than 0.7 with reliability loading at 0.65. Since reliability is an established dimension of the benefits evalu-ation framework, it was retained despite the lower loading.
The cross loadings for the items were also examined showing that each item loaded more strongly on its intended construct than on any of the others. To assess discriminant validity at the construct level, the square root of the aver-age variance extracted (AVE) was compared with the inter-construct correlations. In all cases, the analysis showed that there was more variance in common between the constructs and their measures than between constructs, supporting dis-criminant validity. Each construct also had an internal consis-tency reliability above 0.70 (Table 2).
Survey – structural model
As shown in Figure 3, all four hypotheses were supported. The benefits of using PhysicianConnect significantly and positively influenced the workload and care outcomes expe-rienced by physicians. Stronger perceptions of information quality, process improvement and ease of completing tasks resulted in a perception that nursing, administrative and even physician workload were improved. They also influenced per-ceptions that care was improved by reducing errors and by improving the speed of referrals and receipt of patient results. Challenges with using PhysicianConnect also significantly influenced the outcomes, negatively as expected. Greater chal-lenges with reliability, report quality and service quality promoted perceptions of worsening workload and worsening care.
The analysis also showed that benefits had a stronger pos-itive influence on the outcomes than challenges had a nega-tive one (p<0.001). Improving (perception of) benefits had a
table 2 Correlations between constructs
ICRa Benefits Challenges Care
outcomes Workload
Benefits 0.89 0.86
Challenges 0.82 −0.32 0.78
Impact on
care 0.79 0.50 −0.41 0.70
Impact on
workload 0.90 0.41 −0.35 0.55 0.87
Diagonal elements represent the square root of the AVE.
aICR = internal consistency reliability
on September 12, 2020 by guest. Protected by copyright.
http://informatics.bmj.com/
Ease of completing
tasks Process
improvement
Benefits Impact onworkload
R2=22%
Impact on care R2=32%
Challenges Information
quality
Report quality
Reliability Servicequality
.71 .92
.65 .79
.89
.93
.33
.41
-.25
-.28
Figure 3 structural model results
stronger impact than reducing (the perception of) challenges. This differential impact is consistent with the dual-factor con-ceptualization of enablers and inhibitors.
dIsCussIOn
Findings
This study suggests that benefits were realized from the use of PhysicianConnect, particularly in relation to quality of care and productivity. Even a very limited form of connectiv-ity (one-way communication of test results in a simple text format) resulted in perceived net benefits to clinical produc-tivity and quality of care. This finding supports the view that integration of health records is a source of clinical value, and further demonstrates that even limited integration can pro-vide some benefits.
Some what surprisingly, these benefits were realized in spite of challenges in both system and service qualities. Viewed from the perspective of traditional IS evaluation models,24 this should not be successful. Chatterjee et al.25 report that system and service qualities were essential to the realization of benefits in the context of mobile health tech-nologies. They contend that if clinicians cannot depend on a system to function reliably or do not receive adequate sup-port when there are problems, they will reject the system. A conversation with one of the staffs who had been managing the PhysicianConnect program echoed this view. Yet, despite acknowledged problems with PhysicianConnect, clinicians in this study were very positive towards it. They did not report
a lot of problems with it (the average scores in the survey on the challenges related to system reliability and service quality are not as high as one might have expected given the acknowledged challenges from phase one). More impor-tantly, the impact of the challenges construct on productivity and workload was lower than the impact of benefits.
It appears as though, in this case, the strong benefits related to information quality outweighed the limitations in system and service quality, and resulted in clinical acceptance of the system and ultimately the desired benefits. It appears as though the system and service were ‘good enough’ for adopters to realize the benefits associated with the access to information. This reflects quadrant II in Cenfetelli’s12 dual-factors model, and the results support his prediction that this quadrant can yield positive results (for adoption in his case, but benefits as observed here).
This finding is important because it shows that a new tech-nology can be successful in a healthcare environment even if it falls short of the ideal on some quality aspects. Providing a workable system that gives clinicians tangible benefits in terms of health outcomes may be sufficient to encourage initial adoption, and thus may create the opportunity for continuing technology development to improve the system and extend its use. Thus, while the benefits evaluation framework that has been used in much of the literature24 presents system quality and service quality as linear predictors of use and satisfac-tion, our results suggest that they may represent a threshold factor. Whether this is unique to the PhysicianConnect con-text or whether this finding would generalize more broadly is unknown, and requires further investigation.
on September 12, 2020 by guest. Protected by copyright.
http://informatics.bmj.com/
Limitations
A key limitation is the cross-sectional design with a single source of data (user perceptions). Still, examining perceptual data does provide some basis to estimate the potential benefits, and other studies26 have focused more on the quantification of benefits from HIT. As Goh et al.27 note, further research is needed on the complex processes of clinical adoption and acceptance that result in these benefits. This study extends prior literature to demonstrate how beliefs about enablers and inhibitors associ-ated with the system influence perceptions of the benefits.
COnCLusIOn
This study demonstrates the potential effectiveness of health information exchange, even in a limited fashion, and contributes to our understanding of benefits evaluation by linking the benefits evaluation model14,24,28 to the dual fac-tors model of IT acceptance.11,12 In doing so, this study of PhysicianConnect shows the potential for successful HIT implementation and benefits realization, even in the face of system limitations.
reFerenCes
1. Abraham C and Junglas I. From cacophony to harmony: a case study about the IS implementation process as an opportunity for organizational transformation at Sentara Healthcare. Journal of Strategic Information Systems 2011;20(2):177–97. Available at: https://doi.org/10.1016/j.jsis.2011.03.005.
2. Jensen TB. Design principles for achieving integrated healthcare information systems. Health Informatics Journal 2013;19(1): 29–45. Available at: https://doi.org/10.1177/1460458212448890.
3. Cho S, Mathiassen L and Nilsson A. Contextual dynam -ics during health information systems implementation: an
event-based actor-network approach. European Journal of Information Systems 2008;17:614–30. Available at: https://doi. org/10.1057/ejis.2008.49.
4. Lapointe L and Rivard S. A triple take on information system implementation. Organization Science 2007;18(1):89–107. https://doi.org/10.1287/orsc.1060.0225.
5. Agarwal R, Gao G, DesRoches C and Jha AK. Research commen -tary--The digital transformation of healthcare: current status and
the road ahead. Information Systems Research 2010;21(4):796– 809. Available at: https://doi.org/10.1287/isre.1100.0327.
6. Boonstra A and Broekhuis M. Barriers to the acceptance
of electronic medical records by physicians from
system-atic review to taxonomy and interventions. BMC Health Services Research 2010;10(1):231. Available at: https://doi. org/10.1186/1472-6963-10-231.
7. Holden RJ and Karsh BT. The technology acceptance model: its past and its future in health care. Journal of Biomedical Informatics
2010;43(1):159–72. Available at: https://doi.org/10.1016/j. jbi.2009.07.002 PMid:19615467 PMCid:PMC2814963.
8. Kijsanayotin B, Pannarunothai S and Speedie SM. Factors influ -encing health information technology adoption in Thailand’s
com-munity health centers: applying the UTAUT model. International Journal of Medical Informatics 2009;78(6):404–416. Available at: https://doi.org/10.1016/j.ijmedinf.2008.12.005.
9. Li J, Talaei-Khoei A, Seale H, Ray P and Macintyre CR. Health care provider adoption of eHealth: systematic literature review.
Interactive Journal of Medical Research 2013;2(1):e7. Available at: https://doi.org/10.2196/ijmr.2468.
10. Venkatesh V, Sykes T and Zhang X. “Just what the doctor ordered”: a revised UTAUT for EMR system adoption and use by doctors.
Proceedings of the 44th Hawaii International Conference on System Sciences, Vol Koloa, Kauai, IEEE Computer Society 2011;1–10. Available at: https://doi.org/10.1057/palgrave.ejis.3000717.
11. Bhattacherjee A and Hikmet N. Physicians’ resistance toward
healthcare information technology: a theoretical model and
empirical test. European Journal of Information Systems
2007;16(6):725–37. doi: 10.1057/palgrave.ejis.3000717.
12. Cenfetelli R. Inhibitors and enablers as dual factor concepts in technology usage. Journal of the Association for Information Systems 2004;5(11):472–492.
13. Lau F, Hagens S and Muttitt S. Framework for health information systems in Canada. Healthcare Quarterly 2007;10(1):112–18.
14. Lau F, Price M and Keshavjee K. From benefits evaluation to clini -cal adoption: making sense of health information system success
in Canada. Healthcare Quarterly 2011;14(1):39–45. Available at: https://doi.org/10.12927/hcq.2011.22157. PMid:21301238.
15. van der Meijden MJ, Tange HJ, Troost J and Hasman A. Determinants of success of inpatient clinical information systems: a literature review. Journal of the American Medical Informatics Association 2003;10(3):235–43. Available at: https://doi. org/10.1197/jamia.M1094. PMid:12626373 PMCid:PMC342046.
16. Schoen C and Osborn R. The commonwealth fund 2012 inter
-national health policy survey of primary care physicians. 2012 International Symposium on Health Care Policy 2012:33.
17. Cresswell JW and Plano VL. Designing and Conducting Mixed Methods Research, 2nd edition. Thousand Oaks, CA: Sage, 2011.
18. Dillman DA. Mail and Internet Surveys: The Tailored Design Method, 2nd edition. New York: John Wiley, 2000.
19. Law KS, Wong CS and Mobley WH. Towards a taxonomy of multidimensional constructs. Academy of Management Review
1998;23(4):741–55. Available at: https://doi.org/10.5465/ AMR.1998.1255636. Available at: https://doi.org/10.2307/259060.
20. Bhattacherjee A and Hikmet N. Physicians’ resistance toward
healthcare information technology: a theoretical model and
empiri-cal test. European Journal of Information Systems 2007;16(6):725– 37. Available at: https://doi.org/10.1057/palgrave.ejis.3000717.
21. Ringle CM, Wende S and Will A. SmartPLS. 2005. SmartPLS 2.0.M3. Hamburg: SmartPLS. Retrieved from Available at: http://www.smartpls.com. Accessed 3 February 2015.
22. Wetzels M, Odekerken-Schroder G and van Oppen C. Using PLS path modeling for assessing hierarchical construct models: guidelines and empirical illustration. Management Information Systems Quarterly 2009;33(1):177–95.
23. Armstrong JS and Overton TS. Estimating nonresponse bias in mail surveys. Journal of Marketing Research 1977;14(3):396– 402. Available at: https://doi.org/10.2307/3150783.
24. Delone W and McLean E. The DeLone and McLean model of information systems success: a ten-year update. Journal of Management and Information Systems 2003;19(4):9–30.
25. Chatterjee S, Chakraborty S, Sarker S, Sarker S and Lau FY. Examining the success factors for mobile work in healthcare: a deductive study. Decision Support System 2009;46(3):620– 633. Available at: https://doi.org/10.1016/j.dss.2008.11.003.
26. Devaraj S and Kohli R. Performance impacts of information tech -nology: is actual usage the missing link? Management Science
2003;49(3):273–289. Available at: https://doi.org/10.1287/ mnsc.49.3.273.12736.
27. Goh J, Gao G and Agarwal R. Evolving work routines: adap
-tive routinization of information technology in healthcare.
Information Systems Research 2011;22(3):1–51. Available at: https://doi.org/10.1287/isre.1110.0365.
28. Lau F, Hagens S and Muttitt S. A proposed benefits evalu
-ation framework for health inform-ation systems in Canada.
Healthcare Quarterly 2007;10(1):112–118.
on September 12, 2020 by guest. Protected by copyright.
http://informatics.bmj.com/
AppEnDIx 1: ASSESSMEntS of phySICIAn ConnECt In phASE 1 IntERVIEwS
Item identified Representative quote
Construct: Process improvement
Better follow-up with patients We’re now being more diligent with following up on tests. We have new guidelines from the [regulatory body] about having a tracking system for tests. Do you know what’s been ordered, whether it’s been received, whether the patient is aware, whether it’s been acted upon? (physician 2)
Greater focus on preventative care for patient Staff are doing different things. There’s more shifted now to looking at preventative care criteria. (physician 2)
Greater flexibility in where work can be done If I’m tired at 5:30 when everything is closed up I can go home and do this at night or in the morning when I wake up. It doesn’t matter where I’m at I can actually ‘do management’. (physician 1)
Staff ease of response to patient inquiries I love it. It definitely is… the turnaround time to have the results in the chart. A lot of patients come in
and they’re like ‘oh I want to follow-up with such and such’, so it’s great (Admin 2)
Improved information sharing among team This is important because ‘only whoever has the report can see it. The idea of the electronic chart is
that everyone can share it. That’s one of the greatest benefits is that everybody can look at it at the same time. It’s not this one piece of paper floating around’. (physician 1)
Construct: Information quality
Improved organization of information The reports all are very standardized so that’s neat. It’s boring but they all look very standard— everything is here. Sometimes with the hospital reports you get different things, nice headers etc. which is nice but with this you know everything is here and standardized. (physician 1)
Improved ability to search for patient
information We [are able to] do all kinds of searches. We do searches for whether people have had different types of screening (mammograms, colonoscopies). We do searches for diagnostic criteria, so for patients who have diabetes or other disease states. (physician 2)
Improved legibility of information compared to
paper And the other thing is the legibility of a doctor’s handwriting. You know, in those charts, I look at them and think how can they read this? Seriously! It’s just chicken scratch. But now everybody can read it, everybody knows if it’s a 7 or a 0 for the meds and all this kind of stuff and I really think that that
helps the next person to come along. (admin 1)
Ease of access to information What I was doing differently before? Chasing down paper sometimes, so that’s an advantage too …
I mean, it’s electronic so anybody can access the report even if it’s signed off or not. But if it’s sitting
in my box here {referring to the inbox from the paper world} and I’m away for a day and a half, it’s
locked up. It’s mine; people have to come in here to take a look at it (physician 1).
Construct: Ease of completing tasks
Ease of creating alerts by cutting and pasting So you can actually highlight this with your text and cut and paste and put it into an alert and then
with the electronic chart the advantage would be that you can also put it into a recall. (physician 1)
Ease of creating referrals by cutting and
pasting Plus you have the ability to cut and paste within the report. So you can search it and you can…if I’m doing a letter to a consultant and there’s a certain paragraph in the [computed tomography] (CT) report I can just copy and paste into my letter and it’s wonderful. (physician 2)
Ease of updating CPP The other part of my job is to update the CPP for bone density, mammograms and that type of thing so anybody can pick that up and see that a patient is due in two years or whatever.
Instead of flipping through the chart [and deciphering hand written notes] the doctor now sends
a task for me to update the CPP with the information.
Construct: Report quality issues
Extra space in reports that makes reading
difficult Sometimes the way the reports come in is a bit awkward still. So, if it’s a short report (here he picks up a piece of paper and indicates a report where the text occupies only about quarter of the page)
and the rest is all blank, when it actually comes into the chart, this will be it and there will be a
big blank space. So when I put my next entry into the EMR it will be down here (below the blank space). And I find myself putting the cursor in and deleting the extra space. (physician 2)
Lack of support for images PhysicianConnect has no images, just text. Before a doctor could draw a simple image to
represent part of a note. Date formats from reports not compatible with
EMR And dates sometimes get confused, that’s another one that happens to (e.g., DMY versus MDY). Sometimes they file backwards. (Admin 2)
on September 12, 2020 by guest. Protected by copyright.
http://informatics.bmj.com/
Not enough reports are available through
PhysicianConnect I was asking our vendor this too…we should stick [lab tests from private labs] in there too. We should stick everything we possibly can through there. Do not want all of the reports that currently
come Initially, we received data on things happening during a hospital stay (e.g. bloodwork, ICU, etc.). This is problematic because of the risk of information overload and also for medical-legal
reasons. We need to have it filtered so we only get what we previously received via fax.
(physician 1)
Duplicate reports received There was a while there where we were getting multiple copies of reports and it had to do with any time the transcriptionist at the hospital edited something or changed the transcription, it would generate another copy of the report. So there was a while there where we were getting 3-4-5-6-7 copies of a discharge summary and it was just because every time there was a change or addendum made, we would get another copy. (physician 2)
Unable to upgrade EMR due to version
incompatibility We like it so much that we have in fact delayed our upgrade to the next version of [our EMR]. We’ve heard from other clinics that the new version of the EMR somehow broke the interface. … But
lose the features of the upgrade that we can’t take advantage of. That was a big downside. (physician 2)
Construct: System reliability
System reliability (i.e. stops sending reports) Even though, going into this, we were of the same mind; we can change what we want, but we went down a bit of a rabbit hole there and found out that it’s a pretty temperamental interface. If you
start changing things, for some reason, on the other side of the fence {the vendor side} things go
south. We don’t know why. (Hospital 1) Reports received in a way that does not allow
cut-paste Now sometimes when the reports come in they’re not cut and paste-able. And that’s another weird negative. And I know every once in a while they go through a thing where ‘we can’t do this now’
so I don’t understand how that happens or works but…. (physician 2)
Reports received for mis-identified or unknown
patients Occasionally we get unidentified patients or unknown patients and I think it has to do something with maybe the way a name is spelled or … but it’s happening less and less, that. (physician 2)
No way to tell whether data are flowing I don’t really have an understanding about when they are coming in, how often they are coming in. I just see them and when I stop seeing them I realize that maybe something is wrong. And that’s when I say to the staff gee I haven’t had any hospital reports in a while. (physician 2)
Construct: Service quality
Lack of support from hospitals about system Support is very frustrating when you are working with two different places and you’re working with your EMR and with the hospital who’s sending the reports, you don’t know who to go to
and how…that’s a big one that’s hard to deal with cause no one’s really helpful and you’re just expected to figure it out. (admin 2)
Lack of support from EMR vendor about
system And I don’t think that the vendor has been quite as forthcoming as they could have been with what the problems are. I think [they] are a very popular company but they’ve grown really really quickly and they’re probably in a little over their head right now trying to keep up. (physician 2)
Construct: Impact on care
Speed of obtaining patient results It is very cool, for instance, that if I see somebody in the morning, and I order a chest X-ray, that by
the afternoon that chest X-ray is already on the interface and may be in my inbox and could well be in the chart. I mean, that’s just never happened before…that quickly (physician 2).
Filing errors Now we are finding that there’s less error. Nobody’s perfect because if you’re coming in at 6 in the morning…a Smith’s a Smith and unless you’re checking the birthdate and the health card you
could easily put it in the wrong Smith. You might get it on the right team but it might be in the
wrong chart. So that used to happen, not a lot, but everybody’s human. But now they’re finding it’s
less error. (admin 1)
Errors versus reports that were scanned Before PhysicianConnect, we would have had to read through [the incoming reports] to check them because they are [optical character recognized] and they’re not 100%.
Report reordering There were a lot more not found or not received reports prior to PhysicianConnect so it saves [having to reorder tests]. (Physician 2)
Speed of referrals You get the report electronically and when it comes into the chart it’s there and you can generate a referral [very quickly] (physician 2)
on September 12, 2020 by guest. Protected by copyright.
http://informatics.bmj.com/
Construct: Impact on workload
Administrative staff workload Seriously [filing] was a 3-4 hour a day job. But it never got done. It was never completed. Whereas
now you could actually say ‘my pile is done for today’. (admin 2)
APPendIx 2: MeAsureMent IteMs
physicianConnect impact (net benefits)
How does having the PhysicianConnect interface for receiving patient results in your practice affect each of the following outcomes?
Item Model construct Mean Std. Dev
Errors as compared to reports that were scanned using
optical character recognition Impact on care 3.92 0.81
Filing errorsa Impact on care 4.07 0.87
Speed of obtaining patient resultsa Impact on care 4.40 0.77
Speed of referralsa Impact on care 3.41 0.74
Report reorderinga Impact on care 3.49 0.72
Administrative staff workloada Impact on workload 4.13 0.85
Nursing staff workloada,b Impact on workload 3.65 0.89
Physician workloada,b Impact on workload 3.41 1.00
All items measured on a five-point scale where 1 = much worse with physicianConnect, 2 = worse with physicianConnect, 3 = no difference, 4 = better with physicianConnect and 5 = much better with physicianConnect
aindicates items retained in final model
bnursing and physician workload were discussed during phase 1 but not as having been significantly improved. they were
included in the survey to provide a more fulsome assessment of the impact on workload in the practice.
physicianConnect benefits
To what extent have you personally observed or experienced each of the following potential benefits from having the PhysicianConnect interface for receiving patient results in your practice?
Item Model construct Mean Std. Dev
Improved legibility of information as compared to handwritten notes Information quality 3.79 1.48
Ease of access to informationa Information quality 4.22 0.86
Improved organization of informationa Information quality 3.65 1.20
Improved ability to search for patient informationa Information quality 3.63 1.20
Ease of creating alerts by cutting and pasting information from electronic
reportsa Ease of completing tasks 2.89 1.32
on September 12, 2020 by guest. Protected by copyright.
http://informatics.bmj.com/
Ease of creating referrals by cutting and pasting information from
electronic reportsa Ease of completing tasks 2.84 1.47
Ease of updating CPP by cutting and pasting information from electronic
reportsa Ease of completing tasks 2.55 1.41
Improved information sharing among members of the clinical team (e.g.
doctors, nurses and reception staff)a Process improvement 3.79 1.08
Greater flexibility in where work can be donea Process improvement 3.75 1.26
Better follow-up with patientsa Process improvement 3.62 1.02
Greater focus on preventative care for patients using information in the
EMRa Process improvement 3.16 1.23
Staff ease of response to patient inquiries about test resultsa Process improvement 3.66 1.10
All items measured on a 5 point scale where 1 = not at all, 3 = to some extent and 5 = to a very great extent
aindicates items retained in final model
physicianConnect challenges
To what extent have you personally observed or experienced each of the following potential challenges from having the PhysicianConnect interface for receiving patient results in your practice?
Item Model construct Mean Std. Dev
Not enough reports are available through PhysicianConnecta Number of reports 2.64 1.16
Do not want all of the reports that currently come through PhysicianConnect Number of reports 2.26 1.46
Extra space in reports that makes reading awkwarda Report quality issues 2.67 1.27
Lack of support for images making information more difficult to conveya Report quality issues 2.49 1.18
Date formats from reports not compatible with our EMR Report quality issues 1.78 1.01
Duplicate reports receiveda Report quality issues 3.48 1.29
Reports received in a way that does not allow cut/paste of information Report quality issues 2.53 1.38
Reports received for mis-identified or unknown patientsa Report quality Issues 2.40 1.10
Unable to upgrade EMR due to version incompatibility Report quality issues 2.16 1.28
System reliability (i.e. stops sending reports)a System reliability 2.31 1.06
No way to tell whether data are flowing through the system or nota System reliability 2.73 1.38
Lack of support from hospitals about system issuesa Service quality 2.49 1.27
Lack of support from EMR vendor about system issuesa Service quality 2.91 1.33
All items measured on a 5-point scale where 1 = not at all, 3 = to some extent and 5 = to a very great extent
aindicates items retained in final model
on September 12, 2020 by guest. Protected by copyright.
http://informatics.bmj.com/