BMJ
Paediatrics
Open
AbstrAct
background Low blood glucose levels (BGLs) in infants are known to adversely affect neurodevelopmental outcomes. However, this risk is not well explored in infants with hypoxic ischaemic encephalopathy (HIE) that receive therapeutic hypothermia (TH). Additionally, little information is available on the optimal BGLs to target in infants with HIE.
Aim To explore the association between hypoglycaemia and neurodevelopmental outcomes at different BGL thresholds (2.6 and 3.0 mmol/L) in neonates with HIE treated with TH.
Methods Retrospective cohort study. Clinical information and 2-year neurodevelopmental data using Bayley Scales of Infant Development, third edition (BSID-III) and disabilities were recorded for infants born in Western Australia with HIE and treated with TH between February 2008 and February 2012. Multivariable logistic regression models explored the association between hypoglycaemia and neurodevelopmental outcomes.
results 122 infants underwent a total of 1616 BGL estimations before and during 72 hours of TH. Hypoglycaemia (BGL<2.6 mmol/L) occurred in 38/122 (31%) infants and 11/122 (9%) had recurrent hypoglycaemia (three or more episodes). Infants with recurrent hypoglycaemia (<2.6 mmol/L) had significantly lower mean BSID-III cognitive, language and socioemotional subscale scores. On multivariable analysis, recurrent hypoglycaemia (<2.6 mmol/L) was associated with increased odds of death or disability (adjusted OR 8.15; 95% CI 1.31 to 50.58; p=0.024). Recurrent hypoglycaemia (<3.0 mmol/L) during the first 12 hours of life was also associated with severe disability among survivors (adjusted OR 11.13; 95% CI 2.06 to 59.89; p=0.005).
conclusions Early recurrent hypoglycaemia was associated with increased risk of death or severe disability in neonates undergoing TH for HIE. Prospective studies are needed to identify the ideal target BGL in this population.
IntroductIon
Hypoxic ischaemic encephalopathy (HIE) in newborn infants is associated with high rates of mortality and neurodevelopmental
morbidity.1–3 Therapeutic hypothermia
(TH) is known to improve short-term and long-term outcomes and has become the standard of care for moderate to severe
HIE.4–6 Glucose control is an important
management goal in intensive care units with studies showing that hypoglycaemia is associated with poor neurodevelopmental
outcomes.7–9 However, there is controversy
over the definition of hypoglycaemia in
neonates with HIE.10–12 There are only four
studies that have explored the effect of hypo-glycaemia on the outcomes of neonates with
HIE or suspected asphyxia,13–16 of which two
studies included neonates with HIE that
received TH.14 16
Hence we aimed to further explore the relationship between hypoglycaemia and neurodevelopmental outcomes in neonates with HIE that received TH. Another aim was to examine whether targeting higher blood glucose levels (BGLs) may reduce the risk of adverse neurodevelopmental outcomes.
What this study hopes to add?
► Hypoglycaemia is common in patients with HIE.
► Avoiding recurrent hypoglycaemia in infants with
HIE is important to reduce secondary brain injury.
► We hypothesise that targeting blood glucose
levels >3.0 mmol/L may reduce the risk of unfavourable outcomes in these infants.
Impact of hypoglycaemia on
neurodevelopmental outcomes in
hypoxic ischaemic encephalopathy: a
retrospective cohort study
Jason Khay Ghim Tan,1,2 Corrado Minutillo,1,2 Judy McMichael,2,3 Shripada Rao1,2
To cite: Tan JKG, Minutillo C,
McMichael J, et al.
Impact of hypoglycaemia on neurodevelopmental outcomes in hypoxic ischaemic encephalopathy: a retrospective cohort study. BMJ Paediatrics Open
2017;1:e000175. doi:10.1136/
bmjpo-2017-000175
Received 14 July 2017 Revised 16 August 2017 Accepted 17 August 2017
1Neonatal Intensive Care Unit,
Princess Margaret Hospital for Children, Perth, Western Australia, Australia
2Centre for Neonatal Research
and Education, The University of Western Australia, Perth, Western Australia, Australia
3State Child Development
Centre, Perth, Western Australia, Australia
correspondence to
Dr Jason Khay Ghim Tan; Jason. Tan@ health. wa. gov. au
What is already known on this topic?
► Infants with hypoxic ischaemic encephalopathy
(HIE) are at high risk of neurodevelopmental disability.
► Hypoglycaemia in HIE may increase the risk of
unfavourable neurodevelopmental outcomes.
► This risk is not well explored in infants who receive
therapeutic hypothermia.
on September 12, 2020 by guest. Protected by copyright.
Figure 1 Variation of blood glucose levels over time. Methodology
This was a population-based retrospective case-control study of all neonates with HIE and managed with TH in Western Australia (WA) between February 2008 and February 2012. During this period all infants with HIE that required TH in WA were managed in the neonatal intensive care units (NICU) of Princess Margaret Hospital for Children (PMH) or King Edward Memorial Hospital for Women (KEMH). Both units function as a single clinical care unit and follow the same management protocols. Neonates with HIE were started on a mainte-nance intravenous infusion of 10% dextrose at 50 mL/ kg/day without enteral feeds. A BGL below 2.6 mmol/L was managed with an intravenous bolus of 2 mL/kg of 10% dextrose and the maintenance infusion increased by 10–20 mL/kg/day with a repeat BGL within 60 min. If the total fluid rate reaches 80–90 mL/kg/day then the concentration was incrementally increased by 5%. Hyperglycaemia was managed by reducing glucose infu-sion rates; insulin was not administered to any infant in this study. The majority of neonates were outborn and transferred to PMH or KEMH by the Newborn Emer-gency Transport Service of WA, which is based within the PMH neonatal unit and advise the same protocol as above when calls for transfer are received.
The cohort was identified using the neonatal database
at both NICUs. All infants who were ≥35 weeks
post-menstrual age with HIE and treated with whole body TH were included in this study. TH was commenced in
infants ≥35 weeks postmenstrual age that were less than
6 hours old, had moderate or severe encephalopathy
based on the Sarnat Grading Scale17 and had evidence
of asphyxia as defined by the presence of at least two of the following criteria: (1) Apgar score <6 at 10 min or continued need for resuscitation with positive pres-sure ventilation or chest compressions at 10 min, (2) any acute perinatal event that may result in HIE (ie, placental abruption, cord accident, prolonged fetal bradycardia, etc), (3) cord blood (or if cord blood is not available, arterial blood sample within 60 min of birth) with a pH <7.0 mmol/L or base deficit of 12 or more. Some infants with mild HIE received TH because of initial uncertainty of the severity of the enceph-alopathy prior to or during transfer. Some of these infants were subsequently reclassified to Sarnat grade 1 encephalopathy by the clinical team but completed 72 hours of cooling. These infants were included in the final analysis.
Infants were excluded if they had an inborn error of metabolism or congenital structural brain defect. Our unit protocol was to measure BGLs at least four hourly in the first 24 hours and then six hourly until the end of TH. More frequent measurements were undertaken in infants with poor glucose control.
The demographic, BGLs and 24-month neurode-velopmental outcome data were recorded. All BGLs
from birth until the end of the 72 hours cooling
period were recorded. Hypoglycaemia was defined as
BGL <2.6 mmol/L,10 and hyperglycaemia was defined as
BGL >8.3 mmol/L.16 If more than one episode of
hypo-glycaemia or hyperhypo-glycaemia was detected within the same hour it was considered as one episode with the lower level recorded. BGLs were analysed using a point of care blood gas analyser at each NICU (ABL800 Flex; Radiom-eter, Copenhagen, Denmark). Glucose levels at the refer-ring hospitals and durefer-ring transfer were measured using a variety of methods, including reagent strips or iSTAT (Abbott Point of Care, Princeton, New Jersey, USA) and these were included in this analysis.
Neurodevelopmental measures recorded at 24 months include Bayley Scale of Infant and Toddler Development III (BSID-III) subscales (cognitive, language, motor and socioemotional), blindness, sensorineural deafness and cerebral palsy using the Gross Motor Function Classifi-cation System (GMFCS). Severe disability was defined as one or more of the following:
1. A cognitive or language subscale score <70 (standardised score of 100±15, mean±SD) on BSID-III. Infants who were unable to complete an assessment due to their disabilities were given a score of 40 (4 SDs
from the mean) for all subscales.18 19
2. Blindness: defined as 6/60 vision in the better eye. 3. Sensorineural deafness: defined as the need to use
bi-lateral hearing aids.
4. Cerebral palsy: GMFCS ≥3.
Statistical analysis was done using IBM SPSS statis-tical software for Macintosh;V.21.0 (IBM, 2012; IBM, Armonk, New York, USA). Summary statistics are presented as median and IQR for skewed data and mean and SD for normally distributed continuous data. Frequency distributions and percentages were used to describe categorical data.
Infants were divided into two groups: no
hypogly-caemia (all BGLs were ≥2.6 mmol/L) and
hypogly-caemic group (at least one BGL <2.6 mmol/L). The hypoglycaemic group was further divided into those with one episode, two episodes and three or more episodes of hypoglycaemia (recurrent). For univariate
anal-ysis, continuous normally distributed outcomes were on September 12, 2020 by guest. Protected by copyright.
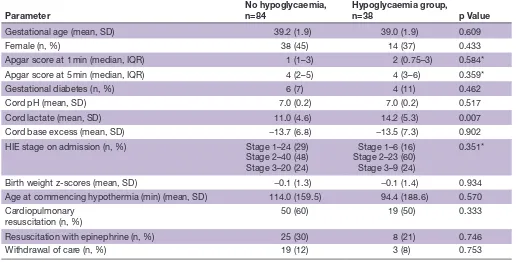
Table 1 Comparison of no hypoglycaemia versus hypoglycaemic infants
Parameter
No hypoglycaemia, n=84
Hypoglycaemia group,
n=38 p Value
Gestational age (mean, SD) 39.2 (1.9) 39.0 (1.9) 0.609
Female (n, %) 38 (45) 14 (37) 0.433
Apgar score at 1 min (median, IQR) 1 (1–3) 2 (0.75–3) 0.584*
Apgar score at 5 min (median, IQR) 4 (2–5) 4 (3–6) 0.359*
Gestational diabetes (n, %) 6 (7) 4 (11) 0.462
Cord pH (mean, SD) 7.0 (0.2) 7.0 (0.2) 0.517
Cord lactate (mean, SD) 11.0 (4.6) 14.2 (5.3) 0.007
Cord base excess (mean, SD) −13.7 (6.8) −13.5 (7.3) 0.902
HIE stage on admission (n, %) Stage 1–24 (29)
Stage 2–40 (48) Stage 3–20 (24)
Stage 1–6 (16) Stage 2–23 (60) Stage 3–9 (24)
0.351*
Birth weight z-scores (mean, SD) −0.1 (1.3) −0.1 (1.4) 0.934
Age at commencing hypothermia (min) (mean, SD) 114.0 (159.5) 94.4 (188.6) 0.570 Cardiopulmonary
resuscitation (n, %) 50 (60) 19 (50) 0.333
Resuscitation with epinephrine (n, %) 25 (30) 8 (21) 0.746
Withdrawal of care (n, %) 19 (12) 3 (8) 0.753
*Mann-Whitney U test.
HIE, hypoxic ischaemic encephalopathy.
compared using two-sided Student’s t-test and Mann-Whitney U was performed for non-normally distrib-uted continuous outcomes. Categorical outcomes were compared using Fisher’s exact test. Logistic regression models were used to analyse the relationship between neurodevelopmental outcomes and hypoglycaemia as defined at two different levels (2.6 and 3.0 mmol/L) and time periods (hypoglycaemic episodes in the first 12 hours of life and first 72 hours of life). Effect size esti-mates were derived after adjusting for HIE stage, time of commencement of TH and any episode of hypergly-caemia. Statistical significance was defined as a p value of less than 0.05.
Hospital ethics and governance committee approval was obtained for this study. Parent consent was deemed not necessary given the retrospective nature of the study.
results
A total of 122 infants were included in this analysis of which 18 (14.7%) died in the first 2 years of life (all had HIE Sarnat stage 3). Eight died during the first 72 hours of life, eight between 72 hours and 28 days and the remaining two at 17 and 22 months of age. Of the 104 survivors, follow-up data were available for 87 (84%) infants. Severe disability was seen in 15/87 (17%) infants. Nine had cerebral palsy, four were deaf, one was blind and 11 had a BSID-III cognitive or language score <70). None of the infants reclassified to Sarnat grade 1 died or had severe disability.
glucose homoeostasis
A total of 1616 BGL measurements were recorded from 122 infants from birth to the end of TH or death when this occurred within 72 hours of birth. Half of the samples
were measured in the first 24 hours of life. Of the 122
infants, 38 (31%) had at least one episode of hypogly-caemia (BGL <2.6 mmol/L); 22 (18%) had two episodes and 11 (9%) had three or more episodes of hypogly-caemia. Glucose homoeostasis of the infants appeared to improve over the period of TH as seen on the
scatter-plot (figure 1). The majority (86.5%) of hypoglycaemic
episodes occurred during the first 24 hours, 9.5% in the second 24 hours and 4% in the last 24 hours of TH.
Table 1 compares the basic demographic data of the no hypoglycaemia group and hypoglycaemic group. The only significant difference was that the hypoglycaemic group had a higher cord blood lactate level.
relationship between hypoglycaemia and neurodevelopmental outcomes
The BSID-III and adverse neurodevelopmental outcomes
at 24 months of life are shown in table 2, which compares
infants with no episodes of hypoglycaemia (baseline) to infants who have varying frequency of hypoglycaemia. The cognitive, language and motor mean BSID-III subscale scores were significantly lower in the group with three or more episodes of hypoglycaemia than the no hypogly-caemia group. Deafness, any severe disability and composite of death and/or severe disability were significantly more common in the group with three or more episodes of
on September 12, 2020 by guest. Protected by copyright.
Table 2 Neurodevelopmental outcomes at 24 months
No episodes of hypoglycaemia
At least one episode of hypoglycaemia
(<2.6 mmol/L) p Value*
Two or more episodes of hypoglycaemia
(<2.6 mmol/L) p Value*
Three or more episodes of hypoglycaemia
(<2.6 mmol/L) p Value* BSID-III scores (mean, SD)
Cognitive subscale 99 (19) 98 (18) 0.813 96 (21) 0.499 83 (25) 0.030
Language subscale 93 (20) 92 (21) 0.875 87 (23) 0.349 71 (26) 0.020
Socioemotional subscale
99 (20) 99 (22) 0.915 93 (25) 0.640 74 (23) 0.004
Motor subscale 97 (18) 97 (18) 0.976 94 (22) 0.316 86 (30) 0.385
Adverse outcomes in survivors (n, %) BSID cognitive or
language<70 7/70 (10) 4/34 (12) 0.747 3/20 (15) 0.686 3/9 (33) 0.082
Blindness 0 (0) 1/34 (3) 0.327 1/20 (5) 0.222 1/9 (11) 0.114
Deafness 1/70 (1) 3/34 (9) 0.101 3/20 (15) 0.033 2/9 (22) 0.033
Cerebral palsy 5/70 (7) 4/34 (12) 0.470 3/20 (15) 0.369 2/9 (22) 0.179 Any disability 8/70 (11) 7/34 (21) 0.242 6/20 (30) 0.074 5/9 (55) 0.005 Composite outcome (n, %)
Death 14/84 (17) 4/38 (11) 0.425 2/22 (9) 0.515 2/11 (18) 1.0
Death or disability 22/84 (26) 11/38 (29) 0.827 8/22 (36) 0.426 7/11 (64) 0.031
*p Value compared with no hypoglycaemia group.
BSID-III, Bayley Scale of Infant and Toddler Development III.
hypoglycaemia compared with the no hypoglycaemia group. Mortality rate was similar between all the hypogly-caemic groups and the no hypoglycaemia group.
On univariate analysis, hyperglycaemia was signifi-cantly associated with severe disability and the composite of death and/or severe disability; however, this associa-tion was lost on multivariable analysis.
After adjusting for HIE stage, hyperglycaemia and time of starting TH, infants with three or more episodes of hypoglycaemia (BGL <2.6 mmol/L) had significantly
higher odds of severe disability alone (table 3) or the
composite of death and/or severe disability than infants
with nil episodes (table 4). Hypoglycaemia within the
first 12 hours of life worsens the odds for severe disability and the composite of death and/or severe disability.
When using a BGL threshold of 3.0 mmol/L, hypo-glycaemia in the first 72 hours of life was not associated
with severe disability alone (table 3) or the composite of
death and/or severe disability (table 4). However, infants
with three or more episodes of hypoglycaemia in the first 12 hours of life had significantly higher odds of severe disability alone and the composite of death and/or severe disability than infants with nil episodes. This association was still significant in this subset after adjusting for hyper-glycaemia and time of starting TH.
dIscussIon
This study highlights the fact that glucose homoeostasis is poor in the first 72 hours of life for infants suffering from
HIE, which predisposes them to episodes of hypogly-caemia. The results also suggest that recurrent episodes of hypoglycaemia (BGL <2.6 mmol/L) are associated with worse neurodevelopmental outcomes.
There is no universal agreement on the definition of neonatal hypoglycaemia in otherwise healthy neonates, although maintaining levels above 2.5 mmol/L, especially
after the first 24 hours of life, is recommended.10 A large
proportion of our study group (31%) had at least one episode of hypoglycaemia (BGL <2.6 mmol/L) with almost 10% having three or more episodes of hypoglycaemia. The prevalence of any episode of hypoglycaemia in our cohort was similar to studies that involved TH in newborns, with
rates ranging from 12% to 28%.16 20 Similar to other studies,
the glucose homoeostasis improved over the first 72 hours of life with the majority of BGLs falling between 3 and
8.3 mmol/L after the first 48 hours of life.15 16
We found that recurrent hypoglycaemia, particularly in the first 12 hours of life, was associated with adverse neurodevelopmental outcomes after adjusting for HIE stage, time of commencement of TH and any episode of hyperglycaemia. Three studies have reported on the asso-ciation of early hypoglycaemia with long-term
neurode-velopmental outcomes in infants with HIE,14–16 Nadeem
et al15 found that early hypoglycaemia was associated with worse neurodevelopmental outcome at 24 months of age in infants with HIE, however, when adjusted for HIE stage this was no longer significant; the difference between this and our study may be due to the larger
on September 12, 2020 by guest. Protected by copyright.
Table 3
Association between hypoglycaemia and disability at dif
fer
ent blood glucose level thr
esholds (multivariable analysis)
Thr
eshold of 2.6
mmol
Thr
eshold of 3.0
mmol/L
In first 12
hours
p V
alue
Over
72
hours
p V
alue
In first 12
hours
p V
alue
Over
72
hours
p V
alue
Adjusted OR and 95%
CI (HIE stage)
Nil
episodes
Baseline
Baseline
One
episode
0.52 (0.06 to 4.63)
0.558
0.60 (0.07 to 5.33)
0.648
0.52 (0.06 to 4.56)
0.555
0.55 (0.06 to 4.94)
0.596
Two
episodes
1.13 (0.12 to 10.72)
0.917
1.029 (0.11 to 9.38)
0.980
0.83 (0.09 to 7.52)
0.868
1.52 (0.16 to 14.99)
0.719
Thr
ee or mor
e episodes
11.90 (2.51 to 56.40)
0.002
6.91 (1.63 to 29.26)
0.009
8.04 (1.84 to 35.26)
0.042
3.49 (0.98 to 12.33)
0.053
Adjusted OR and 95%
CI (HIE stage and hyperglycaemia)
Nil
episodes
Baseline
Baseline
One
episode
0.62 (0.07 to 5.61)
0.674
0.67 (0.08 to 5.95)
0.719
0.56 (0.06 to 4.96)
0.605
0.61 (0.07 to 5.46)
0.656
Two
episodes
1.46 (0.14 to 15.56)
0.752
1.36 (0.13 to 13.95)
0.797
0.95 (0.10 to 8.95)
0.965
1.62 (0.16 to 16.19)
0.682
Thr
ee or mor
e episodes
16.86 (3.00 to 94.66)
0.001
7.93 (1.76 to 35.77)
0.007
9.87 (2.05 to 47.55)
0.004
3.98 (1.07 to 14.85)
0.04
Adjusted OR and 95%
CI (HIE stage and time to start TH)
Nil
episodes
Baseline
Baseline
One
episode
0.52 (0.06 to 4.87)
0.567
0.60 (0.07 to 5.58)
0.654
0.531 (0.06 to 4.83)
0.575
0.54 (0.06 to 5.02)
0.589
Two
episodes
0
0.999
0.92 (0.10 to 8.93)
0.943
0
0.999
1.52 (0.15 to 15.73)
0.722
Thr
ee or mor
e episodes
12.08 (2.43 to 59.86)
0.002
6.06 (1.25 to 29.36)
0.025
8.16 (1.78 to 37.37)
0.007
2.84 (0.73 to 11.11)
0.133
Adjusted OR and 95%
CI (HIE stage, hyperglycaemia and time to start TH)
Nil
episodes
Baseline
Baseline
One
episode
0.67 (0.07 to 6.41)
0.731
0.72 (0.08 to 6.67)
0.772
0.60 (0.07 to 5.49)
0.652
0.63 (0.07 to 5.87)
0.685
Two
episodes
0
0.999
1.40 (0.12 to 15.90)
0.787
0
0.999
1.70 (0.16 to 17.95)
0.661
Thr
ee or mor
e episodes
20.46 (3.04 to 137.80)
0.002
7.87 (1.44 to 42.98)
0.017
11.13 (2.06 to 59.89)
0.005
3.48 (0.82 to 14.74)
0.090
HIE, hypoxic ischaemic encephalopathy; TH, therapeutichypothermia.
on September 12, 2020 by guest. Protected by copyright.
Table 4
Association between hypoglycaemia and death and/or disability at dif
fer
ent blood glucose level thr
esholds (multivariable analysis)
Thr
eshold of 2.6
mmol
Thr
eshold of 3.0
mmol/L
In first 12
hours
p V
alue
Over
72
hours
p V
alue
In first 12
hours
p V
alue
Over
72
hours
p V
alue
Adjusted OR and 95%
CI (HIE stage)
Nil
episodes
Baseline
Baseline
One
episode
0.54 (0.09 to 3.15)
0.493
0.39 (0.06 to 2.44)
0.314
0.41 (0.07 to 2.51)
0.332
0.39 (0.06 to 2.40)
0.307
Two
episodes
0.711 (0.07 to 6.85)
0.768
0.31 (0.03 to 3.81)
0.357
1.35 (0.21 to 8.59)
0.748
0.44 (0.03 to 6.71)
0.552
Thr
ee or mor
e episodes
10.76 (1.94 to 59.62)
0.007
6.55 (1.19 to 36.09)
0.031
5.69 (1.08 to 29.97)
0.040
2.23 (0.58 to 8.56)
0.241
Adjusted OR and 95%
CI (HIE stage and hyperglycaemia)
Nil
episodes
Baseline
Baseline
One
episode
0.60 (0.10 to 3.46)
0.563
0.43 (0.07 to 2.63)
0.359
0.44 (0.07 to 2.68)
0.373
0.41 (0.07 to 2.55)
0.337
Two
episodes
0.77 (0.07 to 8.23)
0.828
0.31 (0.02 to 4.24)
0.382
1.46 (0.22 to 9.89)
0.697
0.44 (0.03 to 7.06)
0.565
Thr
ee or mor
e episodes
11.79 (2.03 to 68.50)
0.006
6.91 (1.23 to 38.78)
0.028
6.07 (1.12 to 33.08)
0.037
2.33 (0.59 to 9.28)
0.229
Adjusted OR and 95%
CI (HIE stage and time to start TH)
Nil
episodes
Baseline
Baseline
One
episode
0.58 (0.09 to 3.57)
0.558
0.41 (0.06 to 2.74)
0.358
0.44 (0.07 to 2.84)
0.387
0.41 (0.06 to 2.64)
0.345
Two
episodes
0.52 (0.03 to 8.80)
0.649
0.33 (0.03 to 4.27)
0.395
1.35 (0.18 to 10.48)
0.772
0.44 (0.03 to 6.90)
0.555
Thr
ee or mor
e episodes
11.96 (2.07 to 69.17)
0.006
7.09 (1.19 to 42.33)
0.032
6.28 (1.14 to 34.54)
0.035
2.50 (0.60 to 10.4)
0.211
Adjusted OR and 95%
CI (HIE stage, hyperglycaemia and time to start TH)
Nil
episodes
Baseline
Baseline
One
episode
0.71 (0.12 to 4.32)
0.713
0.50 (0.08 to 3.17)
0.459
0.52 (0.08 to 3.20)
0.481
0.47 (0.07 to 2.95)
0.418
Two
episodes
0.63 (0.03 to 13.89)
0.770
0.34 (0.02 to 5.38)
0.446
1.66 (0.19 to 14.41)
0.647
0.46 (0.03 to 7.92)
0.590
Thr
ee or mor
e episodes
15.03 (2.32 to 97.19)
0.004
8.15 (1.31 to 50.58)
0.024
7.42 (1.25 to 44.08)
0.028
2.87 (0.63 to 12.94)
0.171
HIE, hypoxic ischaemic encephalopathy; TH, therapeutichypothermia.
on September 12, 2020 by guest. Protected by copyright.
number of infants in our study, 52 vs 122. Two studies,
Basu et al and Tam et al, had infants who received TH,
making up 50% and 12% of their cohort, respectively.14 16
Tam et al14 found that hypoglycaemia was a risk factor for future corticospinal tract injury and there was a 15-point lower cognitive and language score on the BSID-III scale.
Basu et al16 found that infants from the CoolCap trial that
had hypoglycaemia were at significantly higher risk of an unfavourable neurodevelopmental outcome. These associations remained significant after adjusting for birth weight, Apgar score, pH, Sarnat stage and hypothermia group.
An interesting finding of our study was that even when we used a cut-off of 3.0 mmol/L for the definition of hypoglycaemia, the association between recurrent hypo-glycaemia in the first 12 hours of life and death and/or severe disability among survivors persisted. These find-ings may be due to the small numbers. There are no comparative studies conducted that support this finding. Hence, we can only hypothesise that targeting a threshold of 3.0 mmol/L in the first 12 hours of life instead of the traditional 2.6 mmol/L may result in additional bene-fits for these vulnerable infants. This requires further investigation.
The limitations of this study are its retrospective cohort design, small sample size and the heterogeneous population group (inborn vs outborn) and absence of data on Apgar scores at 10 min in many of the infants. Despite having a heterogeneous population the clin-ical characteristics of inborn and out-born groups were similar with regards to demographic data, stage of HIE, biochemical and clinical markers of severity and rates of hypoglycaemia. Although there was a 20% rate of loss to follow-up at 2 years, the study and lost to follow-up group were similar with regards to demographic data, stage of HIE, biochemical and clinical markers of severity and rates of hypoglycaemia. Another limitation was that the cut-off values that we chose to define hypoglycaemia for analysis were arbitrary.
Our study confirms that hypoglycaemia frequently complicates the care of infants born with HIE and that recurrent hypoglycaemia (BGL <2.6 mmol/L) in this setting is associated with significantly higher risk of death or severe disability. Larger prospective studies are required to establish the optimal BGLs in infants undergoing TH for HIE. Early anticipation and prompt management to prevent early, recurrent hypo-glycaemia is essential to improve neurodevelopmental outcomes in infants with HIE receiving TH.
contributors JKGT designed the study and data collection instruments, collected the data, carried out the initial analyses, drafted the initial manuscript, reviewed and approved the final manuscript as submitted. CM assisted in design of the study, reviewed and revised the manuscript and approved the final manuscript as submitted. JM assisted in design of the study, reviewed and revised the manuscript and approved the final manuscript as submitted. SR conceptualised the study and assisted in design of the study, reviewed and revised the manuscript and approved the final manuscript as submitted. All authors approved
the final manuscript as submitted and agree to be accountable for all aspects of the work.
competing interests None declared.
ethics approval Princess Margaret Hospital Human Research Ethics Committee. Provenance and peer review Not commissioned; externally peer reviewed. open Access This is an Open Access article distributed in accordance with the Creative Commons Attribution Non Commercial (CC BY-NC 4.0) license, which permits others to distribute, remix, adapt, build upon this work non-commercially, and license their derivative works on different terms, provided the original work is properly cited and the use is non-commercial. See: http:// creativecommons. org/ licenses/ by- nc/ 4. 0/
© Article author(s) (or their employer(s) unless otherwise stated in the text of the article) 2017. All rights reserved. No commercial use is permitted unless otherwise expressly granted.
references
1. Robertson CM, Perlman M. Follow-up of the term infant after hypoxic-ischemic encephalopathy. Paediatr Child Health
2006;11:278–82.
2. Levene MI, Sands C, Grindulis H, et al. Comparison of two methods of predicting outcome in perinatal asphyxia. Lancet 1986;1:67–9. 3. Volpe JJ. Neurology of the newborn. 5th edn. Philadelphia:
Saunders/Elsevier, 2008.
4. Johnston MV, Fatemi A, Wilson MA, et al. Treatment advances in neonatal neuroprotection and neurointensive care. Lancet Neurol
2011;10:372–82.
5. Shah PS. Hypothermia: a systematic review and meta-analysis of clinical trials. Semin Fetal Neonatal Med 2010;15:238–46.
6. Edwards AD, Brocklehurst P, Gunn AJ, et al. Neurological outcomes at 18 months of age after moderate hypothermia for perinatal hypoxic ischaemic encephalopathy: synthesis and meta-analysis of trial data. BMJ 2010;340:c363.
7. Boardman JP, Wusthoff CJ, Cowan FM. Hypoglycaemia and neonatal brain injury. Arch Dis Child Educ Pract Ed 2013;98:2–6. 8. Burns CM, Rutherford MA, Boardman JP, et al. Patterns of cerebral
injury and neurodevelopmental outcomes after symptomatic neonatal hypoglycemia. Pediatrics 2008;122:65–74.
9. Lucas A, Morley R, Cole TJ. Adverse neurodevelopmental outcome of moderate neonatal hypoglycaemia. BMJ 1988;297:1304–8. 10. Adamkin DH. Neonatal hypoglycemia. Semin Fetal Neonatal Med
2017;22:36–41.
11. Rozance PJ, Hay WW. Hypoglycemia in newborn infants: Features associated with adverse outcomes. Biol Neonate 2006;90:74–86. 12. Hay WW, Raju TN, Higgins RD, et al. Knowledge gaps and research
needs for understanding and treating neonatal hypoglycemia: workshop report from Eunice Kennedy Shriver National Institute of Child Health and Human Development. J Pediatr 2009;155:612–7. 13. Salhab WA, Wyckoff MH, Laptook AR, et al. Initial hypoglycemia
and neonatal brain injury in term infants with severe fetal acidemia.
Pediatrics 2004;114:361–6.
14. Tam EW, Haeusslein LA, Bonifacio SL, et al. Hypoglycemia is associated with increased risk for brain injury and adverse neurodevelopmental outcome in neonates at risk for encephalopathy. J Pediatr 2012;161:88–93.
15. Nadeem M, Murray DM, Boylan GB, et al. Early blood glucose profile and neurodevelopmental outcome at two years in neonatal hypoxic-ischaemic encephalopathy. BMC Pediatr 2011;11:10.
16. Basu SK, Kaiser JR, Guffey D, et al. Hypoglycaemia and
hyperglycaemia are associated with unfavourable outcome in infants with hypoxic ischaemic encephalopathy: a post hoc analysis of the CoolCap Study. Arch Dis Child Fetal Neonatal Ed 2016;101:F14 9–F155.
17. Sarnat HB, Sarnat MS. Neonatal encephalopathy following fetal distress. A clinical and electroencephalographic study. Arch Neurol
1976;33:696–705.
18. Doyle LW, Davis PG, Schmidt B, et al. Cognitive outcome at 24 months is more predictive than at 18 months for IQ at 8-9 years in extremely low birth weight children. Early Hum Dev 2012;88:95–8. 19. Doyle LW, Roberts G, Anderson PJ. Victorian Infant Collaborative
Study G. Outcomes at age 2 years of infants. J Pediatr
2010;156:49–53.
20. Jacobs SE, Berg M, Hunt R, et al. Cooling for newborns with hypoxic ischaemic encephalopathy. Cochrane database of systematic reviews 2013;1:CD003311.
on September 12, 2020 by guest. Protected by copyright.