https://doi.org/10.5194/wes-2-533-2017
© Author(s) 2017. This work is distributed under the Creative Commons Attribution 3.0 License.
Impacts of the low-level jet’s negative wind shear
on the wind turbine
Walter Gutierrez1, Arquimedes Ruiz-Columbie2, Murat Tutkun3,4, and Luciano Castillo5
1Department of Mechanical Engineering, Texas Tech University, Lubbock, Texas 79409, USA
2National Wind Institute, Texas Tech University, Lubbock, Texas 79409, USA
3Institute for Energy Technology (IFE), Kjeller, Norway
4Department of Mathematics, University of Oslo, Oslo, Norway
5School of Mechanical Engineering, Purdue University, West Lafayette, Indiana 47907, USA
Correspondence to:Walter Gutierrez ([email protected])
Received: 12 May 2017 – Discussion started: 30 June 2017
Revised: 1 October 2017 – Accepted: 7 October 2017 – Published: 20 November 2017
Abstract. Nocturnal low-level jets (LLJs) are defined as relative maxima in the vertical profile of the horizontal wind speed at the top of the stable boundary layer. Such peaks constitute major power resources for wind turbines. However, a wind speed maximum implies a transition from positive wind shears below the peak to negative ones above. The effect that such a transition has on wind turbines has not been thoroughly studied.
This research study employed a methodical approach to the study of negative wind shear’s impacts on wind turbines. Up to now, the presence of negative shears inside the turbine’s rotor in relation to the presence of positive shears has been largely ignored. A parameter has been proposed to quantify that presence in future studies of LLJ–wind-turbine interactions. Simulations were performed using the NREL aeroelastic simulator FAST code. Rather than using synthetic profiles to generate the wind data, all simulations were based on real data captured at the high frequency of 50 Hz, which allowed us to perform the analysis of a turbine’s impacts with real-life, small scales of wind motions.
It was found that the presence of negative wind shears at the height of the turbine’s rotor appeared to exert a positive impact on reducing the motions of the nacelle and the tower in every direction, with oscillations reach-ing a minimum when negative shears covered the turbine swept area completely. Only the tower wobblreach-ing in the spanwise direction was amplified by the negative shears; however, this occurred at the tower’s slower velocities and accelerations. The forces and moments were also reduced by the negative shears. The aforementioned im-pacts were less beneficial in the rotating parts, such as the blades and the shafts. Finally, the variance in power production was also reduced. These findings can be very important for the next generation of wind turbines as they reach deeper into LLJ’s typical heights.
1 Introduction
Nocturnal low-level jets (LLJs) are defined as relative max-ima in the vertical profile of the horizontal wind velocity. They are produced by the stable stratification in the lower atmosphere and the inversion of potential temperature that often occur at night. LLJs occur in many regions around the world and are often observed in the Great Plains of the United States. They are particularly important due to their role in the formation of the climate and their impacts on the produc-tion of wind energy. Wilczak et al. (2015) determined that LLJs drive wind farm capacity factors to over 60 % during the nocturnal hours. Thus, they are beneficial for the wind energy production; however, it is not totally clear what their influence is in terms of the turbine’s structure.
There is no single mechanism to explain why LLJs oc-cur. Blackadar (1957) was the first who explained the forma-tion of the jets as the result of the inertial oscillaforma-tion of the Earth. The periodicity of the inertial oscillation was later cal-culated by Stensrud (1996) and Van de Wiel et al. (2010). Ad-ditionally, other theories of LLJ’s formation have also been proposed. Holton (1967) noticed that a sloping terrain may have an influence on the dynamic forcing of a jet. Bonner (1968) confirmed the finding but maintained that the inertial oscillation was still the predominant mechanism and refined the conceptual model of the oscillations. Another theory was later proposed, when Uccellini (1980) observed that strong jets in the upper layers of the atmosphere can induce slower jets within the atmospheric boundary layer.
The most distinctive feature of an LLJ is a peak in the vertical profile of the horizontal wind velocity, usually ap-pearing between 100 and 700 m above the ground level, as noticed by Stensrud (1996). Gutierrez et al. (2016) observed that LLJs exert a noticeable impact at altitudes as low as 40 m, which indeed results in a direct influence over the performance of wind turbines. The existence of the velocity peak implies that the wind speed shear, defined as the varia-tion in the wind speed with the height above the ground level, is positive below the jet peak and negative above.
In some parts of the world, such as Europe, wind turbines are reaching 200 m and the current tallest wind turbines eas-ily surpass that mark. The growing trend in wind turbine heights is expected to continue all over the world, including the United States. This tendency nonetheless presents a key challenge. Gutierrez et al. (2016) pointed out that, as wind turbines get taller, they reach deeper into the atmospheric layers where LLJs are observed. Consequently, this transi-tion from positive wind shear below the jet peak to negative wind shear above will be found more frequently near, inside or even below the turbine’s swept area. The effect that such a transition has on wind turbines has not been thoroughly stud-ied. Legitimate concerns arise as to what the consequences may be on wind turbines that have been designed with the expectation of facing positive wind shears through most of their lifetime.
Hence, the key objective of this article is to determine the impacts of the wind shear transition over the motions (deflec-tions, velocities and accelerations) and loads (forces and mo-ments) of the turbine’s parts. Differently from rotating parts (i.e., the blades and the shafts), the nacelle and tower are an-chored at one end to the ground, which tends to increase the forces and bending moments at the points of support. This situation leads to deflections at the nacelle and at the top of the tower and to considerable forces and moments at the base of the tower. Therefore, it is of interest to find out whether the LLJs’ shear transition exacerbates or mitigates those effects. To answer this question, a process has been devised to find out how the turbines’ responses vary with the presence of negative wind shears. First, enough wind information was collected to allow us to find typical LLJ incidents. Second, a parameter was devised as an independent variable that quantified the proportion of rotor area that receives negative shears. Then, cases were generated by gradually modifying the parameter. Finally, simulations of the turbine responses were performed for each case and the results were compared to draw conclusions.
This paper is organized as follows. The rest of this section focuses on a literature review of the current state of knowl-edge on wind data collection and on wind shear. Methods are described in Sect. 2, including how data were collected and processed, how simulation cases were prepared, and how turbine simulations were performed. Results are shown is Sect. 3 with the most characteristics outputs in the turbines’ blades, nacelle and tower. Finally, in Sect. 4 we discuss the results and present major conclusions.
1.1 Previous experiences on data collection
To simulate the results of this interaction between turbines and LLJs, a decision must be made about how to model the LLJ. Two trends are available: obtain direct measure-ments of real wind data or generate synthetic data from com-putational models. The first option is usually implemented through costly measurement infrastructures, including mete-orological towers, sodar devices, lidar devices or surface sta-tions. Due to high costs associated with field campaigns, the trend is to create synthetic data using economical computer models. The first task in this research was to clarify the cur-rent accuracy of these technologies in order to select the best option to simulate LLJs.
whether WRF is a significant improvement in the estimation of the shear coefficient. Results demonstrated that WRF can provide a better approximation; however, the applicability to accurate projects was uncertain, as other factors such as ter-rain and canopy were not considered. More recently, Van-derwende et al. (2015) noticed that WRF simulations tended to underestimate the jet intensity. It can thus be concluded that NWP models based on WRF are promising at present state, but more progress is needed to consider these models as reasonable options for the detailed analysis of mechanical impacts on turbines.
Although expensive, experimental data acquisition meth-ods are better at capturing LLJ information. Instruments in-stalled on meteorological towers usually provide data with less uncertainty than any other method. One advantage of us-ing meteorological towers is the ability to concentrate mea-surements closer to the ground. Ferreres et al. (2013) inves-tigated whether tower observations could capture the main features of several coherent structures found in atmospheric stable conditions, one of those structures being a LLJ. Al-though the spatial and temporal resolutions of the instrumen-tation were not high, the structures were correctly detected and analyzed by using wavelet methods. The study demon-strated that the towers were a reliable way to capture the fea-tures of such events accurately, including the LLJ.
In summary, high-frequency instruments installed on me-teorological towers are the best option to capture the scales of wind motions that structurally affect wind turbines. Al-though devices like lidars can detect the presence and fea-tures of strucfea-tures such as LLJs, their time resolutions are generally coarser and therefore some important frequencies are filtered out. Therefore, the strategy in this research was to process high-frequency wind data obtained from a 200 m meteorological tower and then use them as input to an aeroe-lastic simulator and learn about the turbine’s response.
1.1.1 Previous work on wind shear
The implications of the LLJs’ increased wind shear on the performance of wind turbines have been investigated in re-cent years. Greene et al. (2009) correlated measurements of wind data in western Oklahoma with the power production of three commercial wind turbines in the same area. The actual power outputs in LLJ situations were found to be larger than the traditional estimates due to stronger wind shears. Mea-sured turbulence intensities were generally lower when LLJs were present.
A comprehensive study about LLJ-induced damage to wind turbines was conducted by Kelley et al. (2004). The re-search was based on the collection of real wind data from a tower and a sodar and also on measurements of result-ing loads on real wind turbines. They found that LLJs can cause instabilities leading to coherent turbulence and Kelvin– Helmholtz waves, which they correlated with an increase in flapwise loads in the blade roots. In a following study, Kelley
(2011) detected that the maximum turbine damages occurred within a narrow range of atmospheric stability usually asso-ciated with LLJs.
Sathe et al. (2013) used wind profile models together with an aeroelastic simulator to investigate whether the wind pro-file and the atmospheric stability modify the wind turbine loads. They found that loads at different turbine parts were affected slightly by the wind profile (up to 7 %) and signifi-cantly by the atmospheric stability (up to 17 %). On the other hand, Bhaganagar and Debnath (2014) performed large-eddy simulations (LESs) to understand how the stable atmospheric boundary layer (ABL) affects the wind turbines’ wake in a wind farm. They found that the wind speed shear, the wind direction shear and the atmospheric turbulence were the pa-rameters with more influence over the structure and lateral expansion of wakes.
Walter (2007) demonstrated the importance of the wind speed shear and the wind direction shear for the wind turbine’s power production. Specifically, he showed a USD 2.1 million loss in revenues across the lifetime of a 100 MW wind farm, compared to revenues calculated for the baseline case with no shears. More recently, Hur et al. (2017) included the strong wind shear as one of the anomalies in the incoming wind field that an enhanced turbine controller needs to detect in order to compensate for the mechanical imbalances on the turbine structure. Gutierrez et al. (2016) pointed out an exacerbation of the cyclical loads on the blades as a result of the stronger wind shear below the LLJ peak, which roughly increased the shear coefficient around 5 times.
A main limitation of the aforementioned studies is that they were focused mostly on an LLJ’s strong positive wind shears as a whole, which basically means that shears were considered to be entirely positive across the turbine’s rotor. To our knowledge, no research has been performed on the possible effects of the presence of LLJs’ negative wind shears within the turbine’s swept area. This scenario is becoming more important as the wind turbines get larger, reaching the heights of LLJs’ peak more often. Giammanco and Peter-son (2005) studied LLJs in the region of the present research and filtered examples whose velocity peak occurred below 200 m above the ground level. They detected characteristic features of LLJs, including extended periods of low turbu-lence interrupted by bursts of turbuturbu-lence that were associ-ated with Kelvin–Helmholtz instabilities. On the other hand, Zhou and Chow (2012) observed that strongly stable bound-ary layers (with strong surface cooling) tended to generate the jet peak at lower heights than those created by moderately stable boundary layers. This observation indicates that strong jets are possible at low altitudes above the ground level.
re-sponses was the wind shear, followed closely by the wind speed, then the wind veer and finally the potential tempera-ture.
In summary, the action of negative shears within the tur-bine’s swept area is a phenomenon whose consequences have not been thoroughly studied. Understanding their effects on the performance and mechanical loads of wind turbines is of great importance from an operational point of view, as the knowledge can modify the expectations and assumptions in-cluded in the design of future wind turbines.
2 Methods
Measurements of wind speed, temperature, pressure and relative humidity were continuously collected by West Texas Mesonet (2017) station at Reese Technology Center. The data were processed and consolidated into a common database. To prepare the simulation cases, the database was screened for patterns indicating atmospheric conditions like LLJs. Once a segment of data was found to match the pattern of interest, it was prepared for a simulation. The dataset was provided as input to an aeroelastic simulator program that computed the mechanical responses of a wind turbine to the incoming wind field.
The first part of this section describes in detail the main features and configuration of the measuring devices mounted on the 200 m meteorological tower. The second part explains the processing of the data and how a case was selected. The third part explains how simulations were prepared for differ-ent jet altitudes with respect to the turbine height. Finally, the fourth part describes the features of the aeroelastic simulator and how the simulations were performed.
2.1 Data collection
The bulk of the experimental data was collected from the measurement system of the West Texas Mesonet 200 m me-teorological tower described by Hirth and Schroeder (2014).
The tower is located at N 33◦36027.3200, W 102◦02045.5000
and at elevation of 1021 m. Sensors were installed at 10 ver-tical positions along the tower as follows: 0.91, 2.44, 3.96, 10.06, 16.76, 47.24, 74.68, 116.43, 158.19 and 199.95 m. All tower measurements and dependent parameters were ob-tained at a frequency of 50 Hz.
Gill R3-50 sonic anemometers at each height were used to obtain the measurements of the three components of the
instantaneous velocity: u (northward), v (eastward) and w
(vertical). The horizontal wind, which was later considered to be normal to the plane of rotation of the blades at the height
of the turbine hub, was obtained as the vector sum Uxy=
u+v. The modulus of the horizontal velocity was calculated
asUxy=
√
u2+v2.
At each height, Young 41382VF sensors provided
mea-surements of temperatureT and relative humidity RH, while
Young 61302V barometers measured the atmospheric
pres-sureP. The potential temperatures were then calculated as
follows:
θ=
P0 P
R/cp
, (1)
whereP0is a pressure reference,Ris the gas constant of air
andcpis the specific heat capacity at constant pressure.
The virtual potential temperatures were calculated using
θv=θ(1+0.61r) (2)
for unsaturated air, where the mixing ratior was obtained
from the relative humidity, as described by Stull (1988).
2.2 Data processing
The information was periodically transferred into a central database, which was scanned in search of past atmospheric events, including the occurrence of LLJ incidents. LLJ cases were detected by using a trigger combining high vertical shear of horizontal wind speed, low standard deviation of wind speed at the peak height and wind speed above a thresh-old for at least 12 h. Preference was then given to LLJ cases whose peak in the horizontal velocity profile occurred below 200 m above the ground level.
After applying these filters, it was determined that the best example of a strong LLJ at low height was the incident that occurred on 22–23 October 2013. Finally, 30 min samples from the selected case were spatially interpolated to obtain 3-D series with a time resolution of 0.02 s (50 Hz) and a space resolution of 1 m in both directions.
One decision to make was how to construct a 3-D box of wind speed information. The tower is a line of measurements which provides one dimension in the vertical axis. The se-ries of collected data generate the second dimension in the streamwise axis. Finally, an assumption must be made to generate the third dimension in the spanwise axis and com-plete the 3-D model. Data from the tower reveal that LLJs are very stable phenomena in terms of wind speed and direc-tion, both of which vary very slowly with time. Moreover, the LLJ’s horizontal scales are large, both along and across the wind direction. These two observations support the expec-tation that horizontal roexpec-tational motions are mostly insignif-icant within LLJ winds and, therefore, that the wind speed vector would be quite similar in the spanwise vicinity of the tower. The third dimension in the spanwise axis was thus ob-tained by replicating the measurements obob-tained at the tower at the same height.
2.3 Case preparation
A dimensionless parameter was used to quantify the propor-tion of the turbine rotor that received negative wind shears. The turbine-jet relative distance parameter was defined as follows:
ξ=(zt−zp)
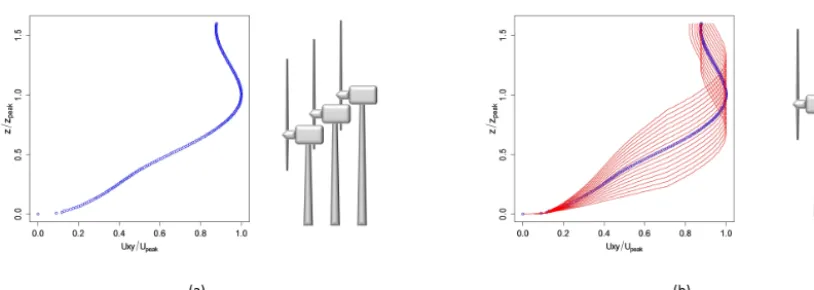
Figure 1.Methods to generate values of the parameterξ. In the first method(a)a single wind data grid was combined with the turbine simulated at several heights. In the second method(b)the turbine at a single height was combined with a family of synthetic data grids (represented by red lines) generated after the original jet data (in blue line).
whereztis the turbine hub height,zpis the height above the
ground level of the peak of the jet and R is the turbine
ro-tor radius. The parameter ξ is a continuous variable. Some
characteristics values are of interest. First, ifξ=1 then the
peak of the jet impacted exactly at the altitude of the lowest point of the turbine’s swept area and thus the wind shear was
entirely negative across the turbine’s rotor. Second, ifξ =0,
then the peak of the jet occurred exactly at the height of the turbine’s hub and thus the wind shear was positive below the
hub and negative above. Finally, ifξ= −1 then the peak of
the jet impacted exactly at the altitude of the highest point of the turbine’s swept area and thus the wind shear was entirely positive across the turbine’s rotor.
Values of the parameterξwere generated by two methods,
as shown in Fig. 1. In the first method, values ofξ were
cre-ated by simulating the turbine at different heights and plug-ging the wind data grid into each simulated turbine. This pro-cedure was usually preferred as it was computationally less demanding; however, a correction was needed to compensate for the variation in bending moments at the tower attributable to the increase in tower height. In the second method,
val-ues ofξ were obtained by creating a family of synthetic data
grids derived from the original jet data. Each member of the family was made to peak at different heights while keeping constant the total kinetic energy of the wind in the region of the turbine’s swept area. In this method, the turbine height was kept constant for all simulations.
2.4 Impact simulation
The wind turbine components analyzed were the blades, the low-speed shaft, the high-speed shaft, the nacelle and the tower. The structural responses were obtained by plug-ging the data grids into the FAST (Fatigue, Aerodynamics, Structures, and Turbulence) simulation code developed by NREL National Wind Technology Center (2016). FAST is a comprehensive aeroelastic simulator capable of predicting
both the extreme and fatigue loads of two- and three-bladed horizontal-axis wind turbines (HAWTs). Simulations in this article were performed with the NREL WindPACT 1.5 MW wind turbine described by Malcolm and Hansen (2006).
3 Results
In this article, each of the time series obtained as output from a FAST run is called a turbine response. A total of 379 re-sponses were obtained and analyzed for each value of the
parameterξ. The way the mechanical responses varied with
the parameter can be analyzed with plots of the probability density function (PDF) for each response setting.
The rest of this section is organized as follows. In the first subsection, a detailed explanation is given to demonstrate
how a 3-D representation of the PDFs for every ξ
consti-tutes the best option to analyze the influence of the parameter on the turbine’s responses. Then, the remaining subsections analyze the results obtained for a selected subset of turbine responses. Due to space restrictions, this article only shows those responses whose behaviors were the most interesting and representative of the overall conclusions.
3.1 Three-dimensional representation of the PDFs
Each response valueR obtained after all FAST simulations
corresponds to a specific location in the wind turbine, a spe-cific type of response (such as a deflection or a force), the
simulation at a specific value ofξ and a specific time after
the start of the simulation. The collection of all response val-ues at a given location, of a given type and resulting from a
givenξ simulation is a time series called a responser. The
statistical analysis of each time series allows us to assess the average effect on the response of the incoming wind as the turbine rotor spins repeatedly across the wind field.
The PDF for any turbine responser at a given value of
0 50 100 150 200
-1.0
-0.5
0.0
0.5
1.0
Blade 1 local flapwise tip acceleration (absolute)
TipALxb(1) A0(tra)
x
(a)
-2 0 2 4 6 8
-1.0
-0.5
0.0
0.5
1.0
Blade 1 local edgewise tip acceleration (absolute)
TipALyb(1) A0(tra)
x
(b)
-600 -400 -200 0
-1.0
-0.5
0.0
0.5
1.0
Blade 1 local axial tip acceleration (absolute)
TipALzb (1)
A0 (tra)
x
(c)
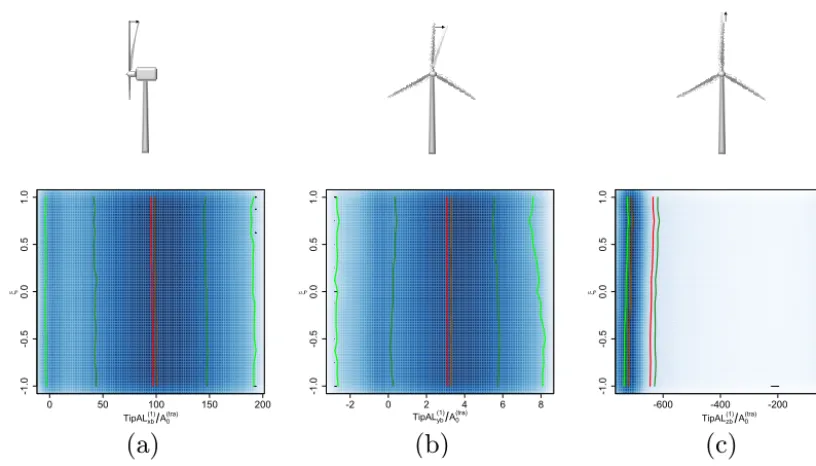
│2.5 %, 97.5 % percentile │16 %, 84 % percentile│Mean │MedianFigure 2.Variation withξof the PDFs of the blade tip’s translational accelerations.(a)Streamwise.(b)Spanwise.(c)Radial. The parameter
ξ is represented by the vertical axis, starting with an entirely positive shear at the bottom (whereξ= −1) and ending with an entirely negative shear at the top (whereξ=1). The horizontal axis represents values of translational acceleration of the tip of the blade 1 (TipAL(1)) normalized by a reference (A(tra)0 ). The background color is deeper where values are more concentrated. The red line and the dark red line connect the mean and the median values, respectively. The green lines and the dark green lines delimit the zones encompassing 95 and 68 % of the values, respectively.
expression:
Pr[a≤T ≤b] =
b
Z
a
f(r,ξ)dr, ξ=const, (4)
where Pr[a≤T ≤b]is the probability of a response valueT
of being within the interval defined byaandb. The figures in
the following sections (from Figs. 2 to 8) illustrate the PDF
variation withξ of several responses.
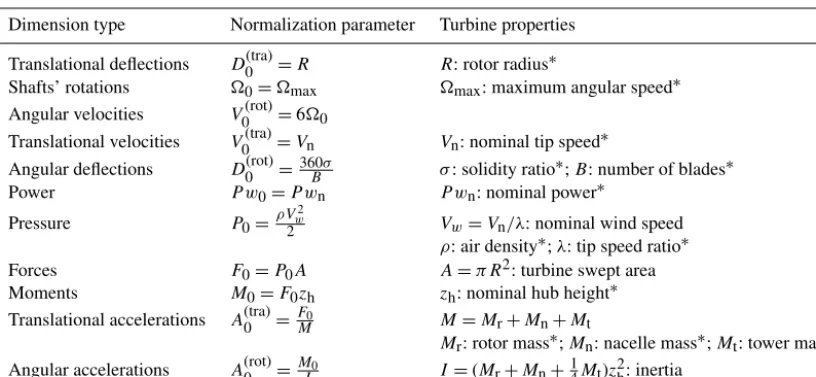
The turbine’s responses have been normalized in order to
display dimensionless parameters in thexaxes. The
normal-ization parameters were calculated in such a way that they were functions of turbine properties only. Their expressions are shown in the second column of Table 1.
3.2 Blade’s motions
The increased wind speed and shear from LLJs augment the motions and loads on the blades, compared to the resulting motions and loads in a diurnal unstable atmosphere (Gutier-rez et al., 2016). Surprisingly, the nature of the LLJ wind shear, i.e., the proportion of positive and negative shears, does not seem to exert a substantial influence on those mo-tions and loads. This observation can be drawn from the anal-ysis of Fig. 2, which shows the PDF variation correspond-ing to the translational accelerations of the tip of one of the
blades. The figure shows patterns of distributions that are al-most symmetric for the streamwise and the spanwise com-ponents and are very skewed for the radial component. As observed, the mean values of the three components remained almost constant and the variances decreased very slightly
(es-pecially in the spanwise component) when the parameterξ
was augmented.
The analysis of other responses corroborates the previous observation. The examination of the blade tip deflections (not shown) reveals that most of the time, the blade was bent near maximum values in the direction of the wind, with transient returns to 0 deflection. Within the plane of rotation, the blade was bent 85 % of the time opposite to the rotation, which may be a consequence of the inertia. Finally, the radial deflection oscillated around a reduced value of length, with transient returns to 0. Increases in the proportion of negative shears within the swept area did not change the streamwise compo-nent and only marginally reduced the spanwise and the axial components.
3.3 Blade’s loads
ex-Table 1.Normalization parameters. Values of turbine properties were obtained from Malcolm and Hansen (2006).
Dimension type Normalization parameter Turbine properties
Translational deflections D0(tra)=R R: rotor radius∗
Shafts’ rotations 0=max max: maximum angular speed∗ Angular velocities V0(rot)=60
Translational velocities V0(tra)=Vn Vn: nominal tip speed∗ Angular deflections D0(rot)=360σ
B σ: solidity ratio
∗;B: number of blades∗
Power P w0=P wn P wn: nominal power∗
Pressure P0=ρV
2
w
2 Vw=Vn/λ: nominal wind speed
ρ: air density∗;λ: tip speed ratio∗
Forces F0=P0A A=π R2: turbine swept area
Moments M0=F0zh zh: nominal hub height∗ Translational accelerations A(tra)0 = F0
M M=Mr+Mn+Mt
Mr: rotor mass∗;Mn: nacelle mass∗;Mt: tower mass∗ Angular accelerations A(rot)0 =M0
I I=(Mr+Mn+ 1
4Mt)z2h: inertia
∗obtained from Malcolm and Hansen (2006)
treme values of the streamwise shear forces and of the bend-ing moments within the plane of rotation. They also reduced the spanwise shear forces and the streamwise bending mo-ments slightly. Finally, more negative shears resulted in small reductions in the centrifugal forces and the torsional mo-ments. The analysis of loads also revealed that the centrifu-gal forces were predominant, with values around 12 times the values of the streamwise shear forces and close to 40 times the values of the spanwise shear forces.
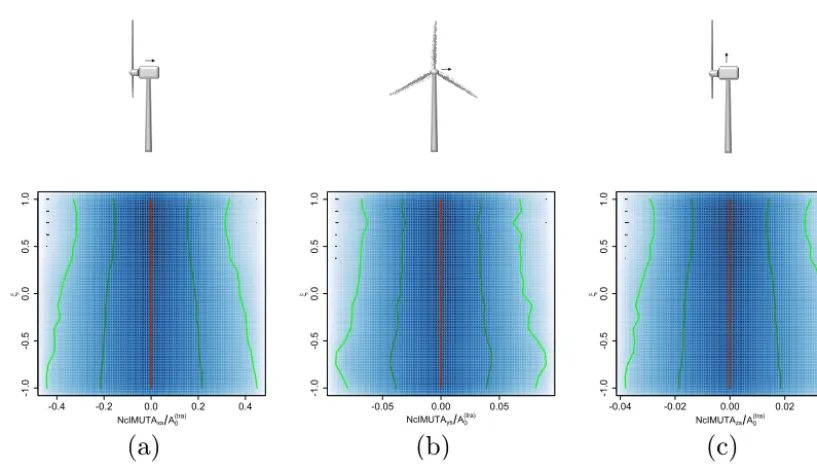
3.4 Nacelle’s motions
Figure 3 shows the variations in the PDF corresponding to the three components of the nacelle’s translational accelerations. It is observed that all components oscillated around the equi-librium position at 0 values. The streamwise component was more important than the other two components, with values in the order of 6 times the values of the spanwise component and almost 10 times the values in the vertical direction.
It is also noticed that the amplitude of oscillations of each acceleration component decreased by approximately one-third when the wind shear across the rotor area went from entirely positive to entirely negative. This pattern indicates that the presence of negative wind shears tends to soften the fatigue impacts inflicted on the nacelle, as they reduce the variance in motions and loads.
Similar observations can be obtained from the analysis of the nacelle translational velocities (not shown). As with the accelerations, the magnitudes of all three velocity compo-nents were very small and oscillated around 0 values. The amplitude of oscillations of the velocity components varied
very little in the interval −1≤ξ <0 and then decreased to
minimum values atξ =1 (shear entirely negative).
Oscilla-tions reached a maximum when the peak of the jet impacted
directly on the height of the turbine hub and reached a min-imum when negative shears covered the turbine swept area completely.
While the nacelle’s translational motions induce shear forces at the base of the tower, the rotational motions can be associated to the tower base’s moments. Figure 4 shows the variations in the PDFs corresponding to the three com-ponents of the nacelle’s angular accelerations. The figure re-veals that the component around the cross axis (roll) was the most affected, with values in the order of 4 times the accel-eration values around the rotor axis and 40 times the values around the vertical axis. This pattern can be explained by the thrust inflicted in the direction of the wind.
Figure 4 also reveals a sharp decrease withξof the
ampli-tude of oscillations for the three components of the nacelle’s angular accelerations. In fact, when the turbine rotor operated
entirely in negative shears (ξ =1), oscillations were reduced
to only one-sixth of the amplitudes observed when the
tur-bine rotor was operated entirely in positive shears (ξ= −1).
It can therefore be concluded that negative wind shears in-side the turbine swept area had a strong damping effect on the rotational motions of the nacelle. In summary, the pres-ence of negative wind shears at the height of the turbine rotor appeared to exert a positive impact on reducing the motions of the nacelle in every direction.
3.5 Tower’s motions
-0.4 -0.2 0.0 0.2 0.4
-1.0
-0.5
0.0
0.5
1.0
Nacelle inertial measurement unit translational acceleration
NcIMUTAxsA0(tra)
x
(a)
-0.05 0.00 0.05
-1.0
-0.5
0.0
0.5
1.0
Nacelle inertial measurement unit translational acceleration
NcIMUTAysA0(tra)
x
(b)
-0.04 -0.02 0.00 0.02 0.04
-1.0
-0.5
0.0
0.5
1.0
Nacelle inertial measurement unit translational acceleration
NcIMUTAzsA0(tra)
x
(c)
│2.5 %, 97.5 % percentile│16 %, 84 % percentile│Mean│Median
Figure 3.Variation withξof the PDFs of the nacelle’s translational accelerations.(a)Streamwise.(b)Spanwise.(c)Vertical. The parameter
ξis represented by the vertical axis, starting with an entirely positive shear at the bottom (whereξ= −1) and ending with an entirely negative shear at the top (whereξ=1). The horizontal axis represents values of the nacelle’s translational acceleration (NcIMUTA) normalized by a reference (A(tra)0 ). The background color is deeper where values are more concentrated. The red line and the dark red line (overlapped in this plot) connect the mean and the median values, respectively. The green lines and the dark green lines delimit the zones encompassing 95 and 68 % of the values, respectively.
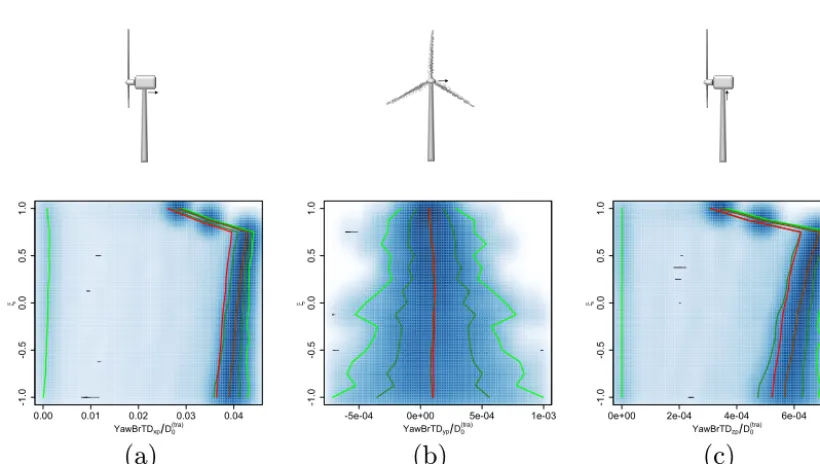
near-0 values. On the other hand, the spanwise component showed a back-and-forth motion between positive and nega-tive values. Streamwise deflections were 2 orders of magni-tude greater than those in the other two directions. The mag-nitudes of those deflections were small; however, their fluc-tuating nature can contribute to the accumulation of fatigue cycles on the tower. In addition, the motions at the top can induce forces and moments at the tower base.
The plots in Fig. 5 also show increases in the mean val-ues of the streamwise component and the vertical
compo-nent with the parameterξ; however, those increases can be
attributed to the modeling (enlargement of the tower) rather than to a larger area under the influence of negative shears. On the other hand, the amplification of the oscillations that is observed in the spanwise component can rightfully be at-tributed to the negative shear.
The previous observations pointed out an increase in the amplitude of oscillations of one deflection component. Nev-ertheless, the potential damage was probably overcompen-sated for by decreases in the oscillation frequencies, as re-vealed by Fig. 6, which shows the PDF variations in the tower top angular velocities. It is observed that the angular
veloc-ities actually decreased whenξ was augmented, both in the
plane of rotation and across the plane of rotation. In fact, the oscillation amplitudes of both components decreased to lev-els smaller than one-third of the values observed when
pos-itive shears covered the turbine swept area. As a result, the presence of negative wind shears at the height of the turbine rotor helped to reduce the accumulation of fatigue cycles in the tower. However, the net effect of increased amplitude and decreased frequency is not clear. A future fatigue analysis on components near this zone may clarify the overall effect of the antagonistic amplitude and frequency.
3.6 Tower’s forces and moments
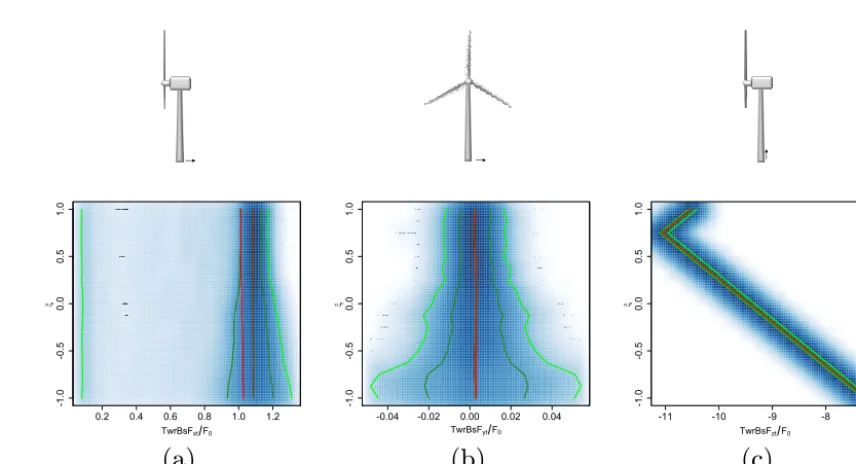
The critical part of the tower is located around the base, where the shear forces and bending moments reach maxi-mum values. The PDF plots of the tower base’s forces are shown in Fig. 7. It is observed that the streamwise shear com-ponent was 2 orders of magnitude stronger than the spanwise component. The compression force was even stronger, by an additional order of magnitude. The distribution of the stream-wise force was concentrated around 300 N in the direction of the wind, with transient returns to near-0 values. On the other hand, the spanwise component fluctuated between the opposite sides of the tower. Finally, compression forces were concentrated very close to the mean values.
compres--0.5 0.0 0.5
-1.0
-0.5
0.0
0.5
1.0
Nacelle inertial measurement unit angular acceleration
NcIMURAxsA0(rot)
x
(a)
-3 -2 -1 0 1 2 3
-1.0
-0.5
0.0
0.5
1.0
Nacelle inertial measurement unit angular acceleration
NcIMURAysA0(rot)
x
(b)
-0.05 0.00 0.05
-1.0
-0.5
0.0
0.5
1.0
Nacelle inertial measurement unit angular acceleration
NcIMURAzsA0(rot)
x
(c)
│2.5 %, 97.5 % percentile│16 %, 84 % percentile│Mean│Median
Figure 4.Variation withξ of the PDFs of the nacelle’s angular accelerations.(a)Around rotor axis.(b)Around cross axis.(c)Around vertical axis. The parameterξis represented by the vertical axis, starting with an entirely positive shear at the bottom (whereξ= −1) and ending with an entirely negative shear at the top (whereξ=1). The horizontal axis represents values of the nacelle’s angular accelerations (NcIMURA) normalized by a reference (A(rot)0 ). The background color is deeper where values are more concentrated. The red line and the dark red line connect the mean and the median values, respectively. The green lines and the dark green lines delimit the zones encompassing 95 and 68 % of the values, respectively.
0.00 0.01 0.02 0.03 0.04
-1.0
-0.5
0.0
0.5
1.0
Tower-top / yaw bearing fore-aft (translational) deflection
YawBrTDxpD0(tra)
x
(a)
-5e-04 0e+00 5e-04 1e-03
-1.0
-0.5
0.0
0.5
1.0
Tower-top / yaw bearing side-to-side (translational) deflection
YawBrTDypD0(tra)
x
(b)
0e+00 2e-04 4e-04 6e-04
-1.0
-0.5
0.0
0.5
1.0
Tower-top / yaw bearing axial (translational) deflection
YawBrTDzpD0(tra)
x
(c)
│2.5 %, 97.5 % percentile│16 %, 84 % percentile│Mean│Median
-6e-04 -2e-04 2e-04 4e-04 6e-04
-1.0
-0.5
0.0
0.5
1.0
Tower-top / yaw bearing angular (rotational) roll velocity (absolute)
YawBrRVxpV0(rot)
x
(a)
-0.002 -0.001 0.000 0.001 0.002
-1.0
-0.5
0.0
0.5
1.0
Tower-top / yaw bearing angular (rotational) pitch velocity (absolute)
YawBrRVypV0(rot)
x
(b)
-5e-06 0e+00 5e-06
-1.0
-0.5
0.0
0.5
1.0
Tower-top / yaw bearing angular (rotational) torsion velocity.
YawBrRVzpV0(rot)
x
(c)
│2.5 %, 97.5 % percentile│16 %, 84 % percentile│Mean│Median
Figure 6.Variation withξof the PDFs of the tower top’s angular velocities.(a)In the plane of the rotor.(b)Across the plane of the rotor.
(c)Torsional. The parameterξis represented by the vertical axis, starting with an entirely positive shear at the bottom (whereξ= −1) and ending with an entirely negative shear at the top (whereξ=1). The horizontal axis represents values of the tower top’s angular velocities (YawBrRV) normalized by a reference (V0(rot)). The background color is deeper where values are more concentrated. The red line and the dark red line connect the mean and the median values, respectively. The green lines and the dark green lines delimit the zones encompassing 95 and 68 % of the values, respectively.
0.2 0.4 0.6 0.8 1.0 1.2
-1.0
-0.5
0.0
0.5
1.0
Tower base fore-aft shear force
TwrBsFxtF0
x
(a)
-0.04 -0.02 0.00 0.02 0.04
-1.0
-0.5
0.0
0.5
1.0
Tower base side-to-side shear force
TwrBsFytF0
x
(b)
-11 -10 -9 -8
-1.0
-0.5
0.0
0.5
1.0
Tower base axial force
TwrBsFztF0
x
(c)
│2.5 %, 97.5 % percentile│16 %, 84 % percentile│Mean│Median
-0.04 -0.02 0.00 0.02
-1.0
-0.5
0.0
0.5
1.0
Tower base roll (or side-to-side) moment
TwrBsMxtM0
x
(a)
0.0 0.5 1.0 1.5
-1.0
-0.5
0.0
0.5
1.0
Tower base pitching (or fore-aft) moment
TwrBsMytM0
x
(b)
-0.015 -0.005 0.005 0.015
-1.0
-0.5
0.0
0.5
1.0
Tower base yaw (or torsional) moment
TwrBsMztM0
x
(c)
│2.5 %, 97.5 % percentile│16 %, 84 % percentile│Mean│Median
Figure 8.Variation withξ of the PDFs of the tower base’s moments.(a)Bending in the plane of rotation.(b)Bending across the plane of rotation.(c)Torsion. The parameterξis represented by the vertical axis, starting with an entirely positive shear at the bottom (where
ξ= −1) and ending with an entirely negative shear at the top (whereξ=1). The horizontal axis represents values of the tower base’s moments (TwrBsM) normalized by a reference (M0). The background color is deeper where values are more concentrated. The red line and the dark red line connect the mean and the median values, respectively. The green lines and the dark green lines delimit the zones encompassing 95 and 68 % of the values, respectively.
sion force were augmented with increases in the parameterξ;
however, this can be attributed to the modeling (enlargement of the tower) rather than to a consequence of more negative shears within the rotor area.
The analysis of the PDF variation in the tower base’s mo-ments, shown in Fig. 8, reveals that the values of bending moment across the plane of rotation were 2 orders of magni-tude stronger than the values of the bending moment within the plane of rotation and the values of the torsional moment. In addition, the amplitudes of oscillations of the bending moments in the plane of rotation and the torsional moments appear to be damped by the negative shears. The figure also shows increases in the mean values of the bending moment
across the plane of rotation when the parameter ξ is
aug-mented; however, they can be attributed to the modeling (en-largement of the tower) rather than to a consequence of a greater presence of negative shears.
It can be concluded that the presence of negative wind shears at the height of the turbine rotor helped to reduce the amplitude of the oscillations of several forces and moments at the tower base.
4 Discussion and conclusions
This paper investigates the mechanical impacts that the pres-ence of LLJ’s negative wind shears can have over several
components of commercial-size wind turbines. As docu-mented, the wind shear is a characteristic feature of LLJs that plays a key role in the mechanical responses of a wind tur-bine’s parts.
High-frequency measurement instruments mounted on the meteorological tower provided wind data with sufficient ac-curacy to capture the time evolution of the wind speed im-pacting the wind turbine. It was assumed that the turbine control systems acted fast enough to keep the turbine swept area always perpendicular to the main wind direction. The as-sumption is valid since the direction of the wind in the pres-ence of LLJs varied very slowly over time.
A nondimensional parameterξwas created to quantify the
proportion of negative wind speed shears reaching the wind turbine’s rotor. Mechanical responses were determined for
differentξ values. Results showed that the transition from
positive to negative shears had a weak to moderate influ-ence over the amplitude of oscillations of several of those responses.
Second, the negative wind shears had a positive impact on reducing the motions of the nacelle in every direction. The ef-fect was proportional to the ratio of the turbine’s rotor that re-ceived negative shears. Variances reached minima when neg-ative shears covered the turbine swept area completely.
Third, it was observed that even as the amplitude of deflec-tions at the tower top increased slightly in the spanwise
direc-tion, the tower motions were slower whenξ was augmented.
This indicates that the presence of negative shears may help in reducing the accumulation of fatigue cycles. However, the net effect of increased amplitude and decreased frequency is not clear. Future wear analysis on components near this zone
under differentξ values can clarify the overall effect of the
antagonistic amplitude and frequency.
Finally, it was detected that the presence of negative wind shears at the height of the turbine rotor reduced the amplitude of the oscillations of several forces and moments at the tower base.
In summary, the negative wind shears, when present within the turbine’s swept area, improved the mechanical loading of the turbine’s nacelle and tower, as those shears were con-nected to a tendency to alleviate the amplitude and frequency of several motions and loads.
There are two factors that may explain the beneficial ef-fects of the presence of LLJ’s negative shears at the height of the turbine rotor. First, the absolute values of slope of the wind profile above the peak of the jet are generally lower than the absolute values of slope below the peak. Therefore, the magnitude of the torque created by the negative shear upon the long elements (such as the blades and the tower), espe-cially around the spanwise axis, becomes smaller than the one created by the positive shear. As a result, the negative shear above the peak generates smaller forces and moments. As the present study has been based on real wind data, the magnitude of the positive shear below the peak was al-ways greater than the magnitude of the negative shear above. This behavior is expected to occur in the vast majority of real cases. The reason behind this asymmetry is that the velocity below the peak has to decrease more (from a maximum at the peak down to 0 at the ground), compared to the velocity above the peak that only needs to decrease from a maximum at the peak to geostrophic in the free atmosphere.
The second factor is the difference in the distributed loads (i.e., the forces and moments generated on the wind turbine structure per unit height). When the wind shear is positive, the distributed loads (and therefore the localized impacts) are augmented with height. The worst scenario occurs when pos-itive shears cover the turbine entirely. On the other hand, neg-ative wind shears decrease the magnitudes of the distributed load. Because the wind turbine is fixed to the ground, the loads generated in the negative wind shear section are still added to the total loads; however, they are added at a slower pace. As a result, the presence of negative wind shears at the height of the turbine rotor actually relieves the operation
loading of the wind turbine, compared to scenarios with no negative wind shears.
One seemingly surprising result was that the presence of negative wind shears was less influential on the rotating parts (such as the blades and the shafts) than on the static parts (such as the nacelle and the tower). Apparently, the rotat-ing components of the turbine compensate for the effects of different wind shears as they cycle through the wind field. In that case, the mechanical response of those rotating parts may be more responsive to the magnitude of the wind speed rather than to the values of wind shear. This contrasts with the responses of the static parts that this research observed to be more connected to the magnitudes of the wind speed shears.
The mean value of power production (measured in the low-speed shaft) remained basically constant with variations in
the parameterξ. On the other hand, its variance was slightly
reduced with a greater presence of negative shears. Both ob-servations highlight additional advantages. First, the pres-ence of the negative shear keeps intact the enormous poten-tial for power production of the LLJ, estimated by Gutierrez et al. (2016) to be in the order of 10–15 times the values in regular unstable conditions. Second, the negative shear sus-tains that power while also slightly reducing the probability of damaging loads. Finally, the reduction in variance may decrease the amount of power transients that the turbine’s controller need to handle.
Thus, based on the results from this study, building taller wind turbines in which rotors are within the negative shear region of LLJs will benefit from high energy production with minimum external loads from wind shears on the wind tur-bines.
Code availability. Simulations in this research were performed using the aeroelastic simulator FAST code, which is available to the public via the website of the NREL National Wind Technology Center (2016) (https://nwtc.nrel.gov/FAST8).
Competing interests. One of the authors, Luciano Castillo, is a member of the editorial board of the journal but was not involved in the publication decision process of this article. The authors declare that they have no conflict of interest.
Acknowledgements. The authors gratefully acknowledge the following grants for this research: NSF-CBET no. 1157246, NSF-CMMI no. 1100948 and NSF-OISE-1243482.
Edited by: Jakob Mann
References
Bhaganagar, K. and Debnath, M.: Implications of Stably Strat-ified Atmospheric Boundary Layer Turbulence on the Near-Wake Structure of Wind Turbines, Energies, 7, 5740–5763, https://doi.org/10.3390/en7095740, 2014.
Blackadar, A. K.: Boundary layer wind maxima and their signifi-cance for the growth of nocturnal inversions, B. Am. Meteorol. Soc., 38, 283–290, 1957.
Bonner, W. D.: Climatology of the Low Level Jet, Mon. Weather Rev., 96, 833–850, 1968.
Ferreres, E., Soler, M., and Terradellas, E.: Analysis of turbulent ex-change and coherent structures in the stable atmospheric bound-ary layer based on tower observations, Dynam. Atmos. Oceans, 64, 62–78, https://doi.org/10.1016/j.dynatmoce.2013.10.002, 2013.
Giammanco, I. M. and Peterson, R. E.: Three Representative Case Studies of the South Plains Nocturnal Low-Level Jet, 1–16, https://doi.org/10.2514/6.2006-1361, 2005.
Greene, S., McNabb, K., Zwilling, R., Morrissey, M., and Stadler, S.: Analysis of vertical wind shear in the South-ern Great Plains and potential impacts on estimation of wind energy production, Int. J. Global Energy, 32, 191–211, https://doi.org/10.1504/IJGEI.2009.030651, 2009.
Gutierrez, W., Araya, G., Kiliyanpilakkil, P., Ruiz-Columbie, A., Tutkun, M., and Castillo, L.: Structural impact assessment of low level jets over wind turbines, Journal of Renewable and Sus-tainable Energy, 8, 023308, https://doi.org/10.1063/1.4945359, 2016.
Hirth, B. and Schroeder, J.: A Summary of the National Wind In-stitute Meteorological Measurement Facilities at the Texas Tech University’s Reese Technology Center Field Site, Report, Na-tional Wind Institute, Lubbock, Texas, USA, 2014.
Holton, J. R.: The diurnal boundary layer wind oscillation above sloping terrain, Tellus, 19, 200–205, https://doi.org/10.5194/acp-11-6837-2011, 1967.
Hur, S., Recalde-Camacho, L., and Leithead, W. E.: The diurnal boundary layer wind oscillation above sloping terrain, Energy, 124, 74–86, https://doi.org/10.1016/j.energy.2017.02.036, 2017. Kelley, N., Shirazi, M., Jager, D., Wilde, S., Adams, J., Buhl, M., Sullivan, P., and Patton, E.: Lamar low-level jet project interim report, Interim Report NREL/TP-500-34593, National Renew-able Energy Laboratory (NREL), Golden, Colorado, USA, 2004. Kelley, N. D.: Turbulence-Turbine Interaction: The Basis for the Development of the TurbSim Stochastic Simulator, Tech. Rep. NREL/TP-5000-52353, National Renewable Energy Laboratory (NREL), Golden, Colorado, USA, 2011.
Malcolm, D. J. and Hansen, A. C.: WindPACT Turbine Rotor Design Study, Subcontract Report NREL/SR-500-32495, Na-tional Renewable Energy Laboratory (NREL), Golden, Col-orado, USA, 2006.
NREL National Wind Technology Center: NWTC Information Por-tal (FAST v8), available at: https://nwtc.nrel.gov/FAST8 (last ac-cess: 7 November 2017), 2016.
Sathe, A., Mann, J., Barlas, T., Bierbooms, W. A. A. M., and van Bussel, G. J. W.: Influence of atmospheric stabil-ity on wind turbine loads, Wind Energy, 16, 1013–1032, https://doi.org/10.1002/we.1528, 2013.
Stensrud, D. J.: Importance of Low-Level Jets to Climate: A Re-view, J. Climate, 9, 1698–1711, 1996.
Storm, B. and Basu, S.: The WRF Model Forecast-Derived Low-Level Wind Shear Climatology over the United States Great Plains, Energies, 3, 258–276, https://doi.org/10.3390/en3020258, 2010.
Storm, B., Dudhia, J., Basu, S., Swift, A., and Gianmanco, G.: Eval-uation of the Weather Research and Forecasting Model on Fore-casting Low-Level Jets: Implications for Wind Energy, Wind En-ergy, 12, 81–90, https://doi.org/10.1002/we.288, 2009.
Stull, R. B.: An introduction to boundary layer meteorology, vol. 13, Springer Science & Business Media, Dordrecht, the Netherlands, https://doi.org/10.1007/978-94-009-3027-8, 1988.
Uccellini, L. W.: On the Role of Upper Tropospheric Jet Streaks and Leeside Cyclogenesis in the Development of Low-Level Jets in the Great Plains, Mon. Weather Rev., 108, 1689–1696, 1980. Van de Wiel, B. J., Moene, A. F., Steeneveld, G., Baas, P., Bosveld,
F. C., and Holtslag, A. A.: A conceptual view on inertial oscil-lations and Nocturnal Low-Level Jets, J. Atmos. Sci., 67, 2679– 2689, https://doi.org/10.1175/2010JAS3289.1, 2010.
Vanderwende, B., Lundquist, J., Rhodes, M., Takle, E., and Irvin, S.: Observing and simulating the summertime low-level jet in central Iowa, Mon. Weather Rev., 143, 2319–2336, https://doi.org/10.1175/MWR-D-14-00325.1, 2015.
Walter, K. R.: Wind power systems in the stable nocturnal boundary layer, Ph.D. thesis, Texas Tech University, Lubbock, TX, USA, 2007.
West Texas Mesonet: Site information, available at: http://www. mesonet.ttu.edu/, last access: 7 November 2017.
Wilczak, J., Finley, C., Freedman, J., Cline, J., Bianco, L., Olson, J., Djalalova, I., Sheridan, L., Ahlstrom, M., Manobianco, J., Zack, J., Carley, J. R., Benjamin, S., Coulter, R., Berg, L. K., Mirocha, J., Clawson, K., Natenberg, E., and Marquis, M.: The Wind Forecast Improvement Project (WFIP): A Public-Private Partnership Addressing Wind Energy Forecast Needs, B. Am. Meteorol. Soc., 96, 1699–1718, https://doi.org/10.1175/BAMS-D-14-00107.1, 2015.