IJMGE
Int. J. Min.& Geo-Eng.Vol.47, No.2, Dec. 2013, pp. 115-127
Applying Rock Engineering Systems (RES) approach to Evaluate and
Classify the Coal Spontaneous Combustion Potential in Eastern
Alborz Coal Mines
Amir Saffari
1*, Farhang Sereshki
1, Mohammad Ataei
1, Keramat Ghanbari
2 1. Faculty of Mining Engineering, Petroleum and Geophysics, Shahrood University of Technology, Shahrood,3619995161, Iran
2. HSE Management of Eastern Alborz Coal Mines Company
Received: 9 January 2013; Received in revised form 20 May 2013; Accepted: 26 May 2013 *Corresponding Author: [email protected]
Abstract
Subject analysis of the potential of spontaneous combustion in coal layers with analytical and numerical methods has been always considered as a difficult task because of the complexity of the coal behavior and the number of factors influencing it. Empirical methods, due to accounting for certain and specific factors, have not accuracy and efficiency for all positions. The Rock Engineering Systems (RES) approach as a systematic method for analyzing and classifying is proposed in engineering projects. The present study is concerned with employing the RES approach to categorize coal spontaneous combustion in coal regions. Using this approach, the interaction of parameters affecting each other in an equal scale on the coal spontaneous combustion was evaluated. The Intrinsic, geological and mining characteristics of coal seams were studied in order to identifying important parameters. Then, the main stages of implementation of the RES method i.e. interaction matrix formation, coding matrix and forming a list category were performed. Later, an index of Coal Spontaneous Combustion Potential (CSCPi) was determined to format the mathematical equation. Then, the obtained data related to the intrinsic, geological and mining, and special index were calculated for each layer in the case study (Pashkalat coal region, Iran). So, the study offers a perfect and comprehensive classification of the layers. Finally, by using the event of spontaneous combustion occurred in Pashkalat coal region, an initial validation for this systematic approach in the study area was conducted, which suggested relatively good concordance in Pashkalat coal region.
Keywords: Coal, Classii�catio�, Coal Spontaneous Combustion Potential index (CSCPi), Rock
Engineering Systems (RES), Eastern Alborz Coal Mines
1. Introduction
As a fundamental energy source in many countries, coal makes up a large portion of economic growth.
Coal is extracted from underground and open pit mines. The dangers of coal mining are the limiting factors which are considered in designing underground mines. Major hazards
in underground coal mining include
subsidence, outburst, coal spontaneous
combustion, environmental pollution, etc. Therefore, it is necessary to accurately identify
the risks involved in forecasting, preventing and controlling them.
116
Coal fires, induced by spontaneous
combustion, have greatly threatened the mining industry and also have been considered as one of the major causes of catastrophic events in many countries such as, China, India, Indonesia, United States of America, Australia, South Africa and Russia [1].
Together with enormous economic losses and personal casualties, the damages resulting from coal spontaneous combustions have also led to massive environmental pollution [1]. Thus, coal spontaneous combustions seem to be a serious problem.
Over the past years, the mechanism of spontaneous combustion has been extensively researched from a variety of aspects, including rank of coal, pyrite content, moisture content, ash content, inorganic components, particle size, etc. as to offer alternatives to coal spontaneous combustion [2-5]. Thus, various methods of investigating the tendencies of spontaneous combustion have been developed [1, 6-9]. However, analyzing the historical records of coal mine fires suggest that the hazard of spontaneous combustion is not only influenced by the intrinsic characteristics of coal, but also by a multiplicity of factors like
geological characteristics and mining
characteristics.
To modify the traditional idea, the
prediction of coal fire should not be based on the unilateral identification of spontaneous combustion propensity of coal, but on a comprehensive hazard evaluation system, which contains different factors and complicated interactions. Thus, the methods introduced above are impractical and ineffective when applied.
Therefore, it is essential to thoroughly evaluate the hazards of spontaneous combustion. We collected related data cited from the latest studies on spontaneous combustion research from around the world, and selected those which were applicable to the evaluation of Iranian coalfields. Based on the available data, we reconsidered the parameters affecting spontaneous combustion.
In this study, it was tried to examine the risk of coal spontaneous combustion in underground mining, particularly in longwall mining in Eastern Alborz coal mines by applying the model of Rock Engineering
Systems (RES), to determine the significance
of each parameter in influencing the hazard. Based on tests which were done, the hazard of each seam was rated.
2. Rock Engineering Systems (RES)
One of the most powerful approaches to solving complex engineering problems is rock engineering systems (RES), introduced by Hudson (1992) [10]. RES approach has been widely applied to different engineering problems including environmental studies on the disposal of spent fuel [11], river catchment pollution [12], forest ecosystems [13, 14], radioactive waste management [15, 16], traffic-induced air pollution [17], risk of reservoir pollution [18], and estimating TBM downtimes [19].
It has also been widely used in some rock mechanics applications such as the general problems of slope stability [20-29], stability analysis of tunnels and underground spaces [30-33], and analysis of blasting in rocks [34-36].
In RES application, the interaction matrix device [10] is the basic analytical tool and a presentational technique for characterizing the important parameters and the interaction mechanisms in a rock engineering system. In the interaction matrix for a given rock engineering system, all parameters influencing the system are arranged along the leading diagonal of the matrix, called the diagonal terms. The influence of each individual factor on any other factors is accounted for at the corresponding off-diagonal position, named the off-diagonal terms. The off-diagonal terms are assigned numerical values which describe the influence degree of one factor on the other factors. Assigning these values is called coding the matrix.
Several coding methods have been
developed for this purpose, such as the 0-1 binary method, expert semi-quantitative (ESQ)
method, explicit method, continuous
quantitative coding (CQC), probabilistic expert semi-quantitative (PESQ) method and etc. were proposed for numerically coding the interaction matrix.
117
cited above. In this method, one unique code is deterministically assigned to each interaction, thereby expressing the effect of a parameter on another in the matrix. Typically, coding values vary between 0 and 4, with 0 indicating no interaction and 4 indicating the hyper level of interaction or “critical interaction” (Table 1).The general concept of the influences in a system is described by the interaction matrix, which is shown in Figures 1 and 2. Here, the influence of ‘‘A’’ on ‘‘B’’ is not the same as that of ‘‘B’’ on ‘‘A’’, which means the matrix is asymmetric [37]. Thus, it is important to put the parameter interactions in clockwise direction in the matrix.
In the interaction matrix, the sum of a row is called the ‘‘Cause’’ value (
1
n
pi j ij
C
I
)and the sum of a column is the ‘‘Effect’’ value
(
1
n
pj i ij
E
I ), denoted as coordinates (C,E) for a particular parameter. The coordinate values for each parameter can be plotted in cause and effect space, forming the so-called C–E plot. The interactive intensity value of each parameter is denoted as the sum of the C and E values (C+E) and it can be used as an indicator of parameters' significance in the system. That is, the weight for parameter i,
indicated by
a
i , is given by its ‘‘parameterinteraction intensity’’ (
C
i
E
i) divided bythe (total) sum of interaction intensities of all parameters in the system [10].
1 1
100
i i i n n
i i i i
C E
a
C E
(1)where:
i: number of main parameters.
i
C : is the cause (impressments) of each
parameter in system.
i
E
: is the effect (Unaffected) of eachparameter in system.
1
n i i C
: is sum of Ci in whole system.1
n i i
E
: is sum ofE
i in whole system.a
i : isthe weighting of the each parameter (%).
Table 1. Expert semi-quantitative (ESQ) method for interaction matrix coding [10, 20].
Code
value Description
0 No interaction
1 Weak interaction
2 Medium interaction
3 Strong interaction
4 Critical interaction
Subject A
Box ii
Iij Influence of A on B
Box ij
Iji Influence of B on A
Box ji
Subject B
Box jj
Figure 1. The principle of the interaction matrix [10].
3. Methodology
3.1. Development of the RES model application to classification of the coal spontaneous combustion potential
In order to define the model, four main steps must be taken into account, that this steps description in below.
3.1.1. Selecting the most important parameters
In the first step, identifying parameters that are responsible for the occurrence of risk in case of coal spontaneous combustion is necessary. According to the available literature and studies on coal spontaneous combustion subject, a total of 15 major parameters for coal
burning potential were identified and
categorized (Figure 3).
3.1.2. Interaction matrix
118
one has in the overall risk conditions as interaction matrix formation or coding matrix. In this step, the RES principles can be used to assess the weighting of the parametersinvolved. The factors contributing to
spontaneous combustion were assigned weights using Rock Engineering Systems
(RES) method and ESQ (expert
semi-quantitative) coding method (Table 1) and a
group of four experts from the Faculty of
Mining Engineering of Shahrood University of
Technology (Iran) and Eastern Alborz Coal
Mines Company, who specialize in the field of
coal mine safety. The experts summarized their judgments of the weights of all contributing parameters and developed the interaction
matrix. The 15 principal parameters
influencing the spontaneous combustion are
located along the leading diagonal of the matrix and the effects of each individual
parameter on any other parameter
(interactions) are placed on the off-diagonal cells. The assigning values to off-diagonal
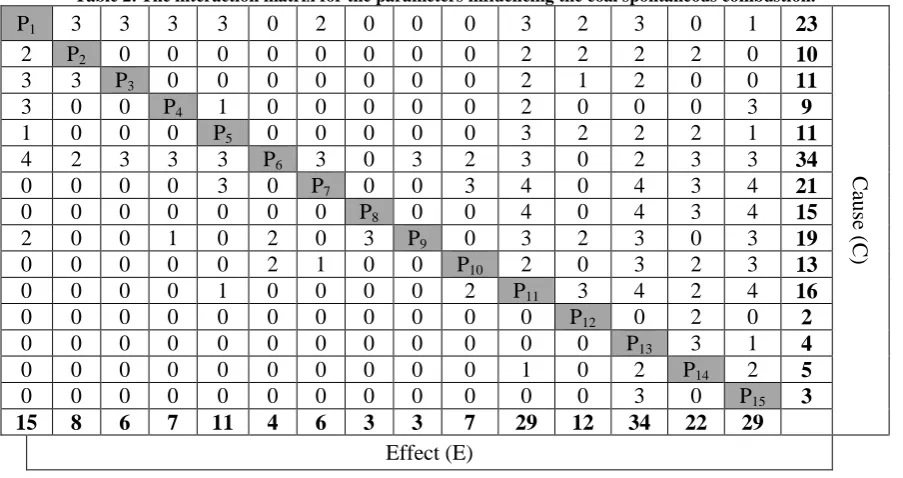
cells are called coding the matrix. Table 2
provides the matrix. Table 3 gives cause (C),
effect (E), interactive intensity (C+E),
dominance (C–E) and weight of each
parameter (
a
i ). As shown in Table 3,extraction method (P11) has the highest weight
in the system and tightly controls other elements.
The choice of considering the summation C+E as a discriminating factor among the parameters is made to emphasize the role of the system interactivity. On average, the more a system is interactive, the more it is potentially unstable because there is more chance of a small variation in one parameter significantly affecting the system behavior [10].
Main
parameters Pi
along leading diagonal
Interactions Iij in off-diagonal
boxes
Column j: Influence of other
parameters
on Pi
Pre
-C
on
st
ruc
ti
o
n A
spe
c
ts
(columns)
ij i
Overj
I
Cp
(CAUSE)
Pi
Row i: Influence of
Pi on other
parameters
Post- Construction Aspects
Construction box (rows)
ij j
Overi
I
Ep
(EFFECT)119
Figure 3. Contributing parameters to coal spontaneous combustion used to define the RES based model.
Table 2. The interaction matrix for the parameters influencing the coal spontaneous combustion.
C aus e (C ) 23 1 0 3 2 3 0 0 0 2 0 3 3 3 3 P1 10 0 2 2 2 2 0 0 0 0 0 0 0 0 P2 2 11 0 0 2 1 2 0 0 0 0 0 0 0 P3 3 3 9 3 0 0 0 2 0 0 0 0 0 1 P4 0 0 3 11 1 2 2 2 3 0 0 0 0 0 P5 0 0 0 1 34 3 3 2 0 3 2 3 0 3 P6 3 3 3 2 4 21 4 3 4 0 4 3 0 0 P7 0 3 0 0 0 0 15 4 3 4 0 4 0 0 P8 0 0 0 0 0 0 0 19 3 0 3 2 3 0 P9 3 0 2 0 1 0 0 2 13 3 2 3 0 2 P10 0 0 1 2 0 0 0 0 0 16 4 2 4 3 P11 2 0 0 0 0 1 0 0 0 0 2 0 2 0 P12 0 0 0 0 0 0 0 0 0 0 0 4 1 3 P13 0 0 0 0 0 0 0 0 0 0 0 0 5 2 P14 2 0 1 0 0 0 0 0 0 0 0 0 0 3 P15 0 3 0 0 0 0 0 0 0 0 0 0 0 0 29 22 34 12 29 7 3 3 6 4 11 7 6 8 15 Effect (E)
Effective parameters in coal spontaneous combustion
Intrinsic characteristics
Rank of coal(P1)
Pyrite content (P2)
Moisture content (P3)
Ash content (P4)
Gas emission in seam (P5)
Geological characteristics
Depth of cover (P6)
Thickness of seam (P7)
Slope of seam (P8)
Exist of tectonic faults in seam (P9)
Unworkable coal seam in vicinity of extracting coal seam (P10)
Mining characteristics
Extraction method (P11)
Advancing direction (P12)
Rate of advance (P13)
Filling of extracted area method (P14)
120
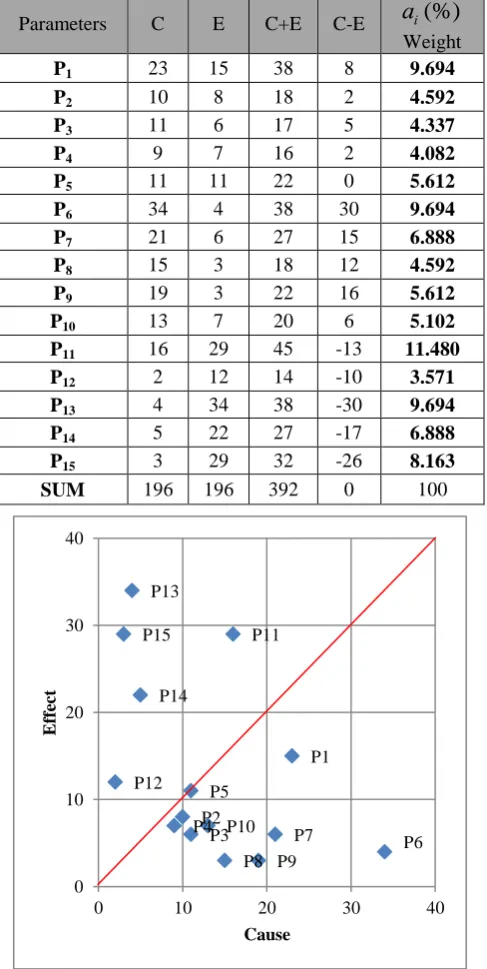
Table 3. Weighting of the main parameters in coal spontaneous combustion.
(%)
i
a
Weight C-E
C+E E
C Parameters
9.694
8 38 15 23
P1
4.592
2 18 8
10
P2
4.337
5 17 6
11
P3
4.082
2 16 7
9
P4
5.612
0 22 11 11
P5
9.694
30 38 4
34
P6
6.888
15 27 6
21
P7
4.592
12 18 3
15
P8
5.612
16 22 3
19
P9
5.102
6 20 7
13
P10
11.480
-13 45
29 16
P11
3.571
-10 14
12 2
P12
9.694
-30 38
34 4
P13
6.888
-17 27
22 5
P14
8.163
-26 32
29 3
P15
100 0
392 196 196
SUM
Figure 4. The cause-effect (C-E) plot for principal parameters of coal spontaneous combustion.
The E–C histogram and C+E (interaction intensity) for each parameter are illustrated in Figures 4 and 5, respectively. The position of each point in E–C histogram (Fig. 4) specifies the parameter interaction situation. The points below the C=E line are called dominant and the points above the C=E line are called
subordinate [10]. Thus, depth of cover (P6) is
dominant on the system and rate of advance
(P13) and exploitation factor (P15) respectively
are subordinate of system.
Calculating the amount of interaction in the form of (C+E) can be used to identify parameters that need to be controlled, because small changes in these parameters could possibly induce significant changes in the system [10].
P1
P2 P3 P4
P5
P6 P7
P8 P9 P10
P11
P12 P13
P14 P15
0 10 20 30 40
0 10 20 30 40
Effe
ct
121
Figure 5. Interaction intensity for the parameters in considered system.
The histogram of interaction intensity parameters (Fig. 5) shows that the parameters,
extraction method (P11), rank of coal (P1),
depth of cover (P6), rate of advance (P13) and
exploitation factor (P15) have the highest
intensity of the interaction in the system. Therefore, small changes in these parameters will exert effect, to a considerable extent, on the behavior of the system.
3.1.3. Rating of parameters
In the third step, the rating of the parameters’ values was carried out based upon their effect on the coal spontaneous combustion. Six classes of rating, from 0 to 5 were considered, with 0 indicating the best state (most favorable condition) and 5 which indicates the worst position (most unfavorable condition). In the case of coal spontaneous combustion, the
rating of each parameter is presented in Table
4. The ranges of parameters in Table 4 were
proposed based on results obtained by other researchers [7, 8, 38-55].
3.1.4. CSCPi and vulnerability index ranges
In the fourth step, rating of Coal Spontaneous Combustion Potential index (CSCPi) for each
layer can be calculated according to Equation 2
(modified after [10]).
15
1
ij
j i
i Max i
P
CSCPi
a
P
(2)where:
i refers to parameters (1 to 15) j refers to number of layers
i
a
is the weighting of the each parameter (%)(obtained from Equation 1).
ij
P
is the rating assigned to different classes ofparameter i values and is different for different layers j.
Maxi
P
max value rating of parameter i; whichPMaxi is for normalization by dividing with
the maximum rating.
j
CSCPi is Coal Spontaneous Combustion Potential index of each layer; the maximum value of the index is 100 which refers to the most unfavorable conditions and the minimum index is 0 which refers to the most favorable conditions.
Vulnerability index is in a range of 100 points that can be divided into three or five areas. In this range, higher point indicates higher the vulnerability of condition [20]. In this study, we used a three-area classification system based on CSCPi with low, medium and high risk significance (Table 5).
3.2. Case study: Eastern Alborz coal mines
The Eastern Alborz coal field is located in the Alborz Mountains. The region varies in elevation from 2000 to 2800 meters above sea level.Eastern Alborz coal mines include two major mining areas: a) Tazareh (including Pashkalat, Kelariz, Razmja and Mamdoheh mines); b) Olang and Qeslaq (including Razi, Malach Aram, Joze Chal, Kashkak mines, etc.). In order to classify the potential burning coal fields of Eastern Alborz coal mines using the rock engineering systems (RES) approach, the Pashkalat coal region (with 17 active coal 0
5 10 15 20 25 30 35 40 45 50
1 2 3 4 5 6 7 8 9 10 11 12 13 14 15
C
+E
122
Table 4. Proposed ranges and rating for the effective parameters in coal spontaneous combustion. Parameters
(Unit)
Suggested ranges and rating
0 1 2 3 4 5
Rank of coal Anthracite Bituminous Lignite
Sub-bituminous ---
---Pyrite content
(%) >1 1-2 2-5 5-8 8-10 <10
Moisture
content (%) >3 3-5 5-7 7-12 12-24 <24 Ash content
(%) <80 60-80 40-60 20-40 10-20 >10
Gas emission in seam (m3/ton)
15
< 10-15 5-10 >5 ---
---Depth of cover
(m) 50-200 200-400 400-600 600-800
50 >
---800
<
Thickness of
seam (m) >1.2 1.2-2.4 2.4-3.2 3.2-5
Thick layer with multi-cut
---Slope of seam
(degree) 0-15 15-30 30-45 45-60 60-90 ---Exist of
tectonic faults in seam
Not available
Less than 2 small fault /500
m
More than 2 small fault /500
m
Big fault with
great failures ---
---Unworkable coal seam in vicinity of extracting coal
seam
Not available
Spacings of 2 layers is more than 30 times extraction layer
thickness
Spacings of 2 layers is between 20-30 times extraction layer thickness
Spacings of 2 layers is between 10-20
times extraction layer thickness
Spacings of 2 layers is between 5-10
times extraction layer thickness
Spacings of 2 layers is less than 5 times extraction
layer thickness
Extraction method
Mechanized long wall with shearer
loader
Short wall mining
Semi-mechanized long wall with
Plow
Room and pillar mining
Traditional
long wall
---Advancing
direction Retreat Advance --- --- --- ---Rate of
advance (m/day)
5
˃ 4-5 3-4 2-3 1-2 ˂1
Filling of extracted area
method
Hydraulic filling
Pneumatic filling
Mechanical filling
Gravity
stowing Hand stowing
Caving method
Exploitation
factor ˃80 65-80 50-65 30-50 ˂30
---Table 5. Classification of the coal spontaneous combustion potential index [20].
Risk significance Low Medium High
Category I II III
Coal Spontaneous Combustion Potential index
123
Table 6. Calculation of CSCP index for the layers of the Pashkalat coal region.
Rating of Parameters
Weight of each parameter
i
a
(%)9
.6
9
4
4
.5
9
2
4
.3
3
7
4
.0
8
2
5
.6
1
2
9
.6
9
4
6
.8
8
8
4
.5
9
2
5
.6
1
2
5
.1
0
2
1
1
.4
8
0
3
.5
7
1
9
.6
9
4
6
.8
8
8
8
.1
6
3
∑
PMaxi 3 5 5 5 3 4 4 4 3 5 4 1 5 5 4
---Parameters
Seam P1 P2 P3 P4 P5 P6 P7 P8 P9 P10 P11 P12 P13 P14 P15 CSCPi
P18 1 0 0 3 3 0 0 1 0 0 4 1 5 5 1 46.1
P15 1 2 0 3 3 0 0 2 0 0 4 1 5 5 1 49.1
P10 1 1 0 3 3 1 0 1 1 0 4 1 5 5 1 51.3
P3 0 0 0 3 3 1 0 2 0 3 4 1 5 5 1 49.5
K25 0 0 0 3 3 3 0 1 1 0 4 1 5 5 1 52.0
K23 0 0 0 3 3 3 0 2 1 0 4 1 5 5 1 53.2
K21 0 0 0 3 3 3 0 1 1 0 4 1 5 5 1 52.0
K19U 0 2 0 2 3 3 0 2 1 0 4 1 5 5 1 54.2
K19L 0 2 1 3 3 3 0 1 1 0 4 1 5 5 1 54.7
K14 0 0 0 3 3 3 0 2 1 0 4 1 5 5 1 53.2
K13 0 2 0 3 2 3 0 2 1 0 4 1 5 5 1 53.1
K12 0 2 0 2 3 3 0 1 1 0 4 1 5 5 1 53.0
K10 0 2 0 5 3 3 2 3 3 0 4 1 5 5 1 65.0
K9 0 0 0 3 2 3 0 2 0 0 4 1 5 5 1 49.4
K8 0 2 0 3 3 3 0 2 1 0 4 1 5 5 1 55.0
K6 0 2 0 3 3 4 0 2 1 0 4 1 5 5 1 57.4
K5 0 3 0 5 3 4 4 3 3 0 4 1 5 5 1 71.8
Table 7. The final ranking obtained for the layers of the Pashkalat coal region.
Seam CSCPi Category Risk
description Status of spontaneous combustion in fact P18 46.1 II Medium Since, there is no coal spontaneous combustion. P15 49.1 II Medium Since, there is no coal spontaneous combustion. P10 51.3 II Medium Since, there is no coal spontaneous combustion. P3 49.5 II Medium Since, there is no coal spontaneous combustion. K25 52.0 II Medium Since, there is no coal spontaneous combustion. K23 53.2 II Medium Since, there is no coal spontaneous combustion. K21 52.0 II Medium Since, there is no coal spontaneous combustion. K19U 54.2 II Medium Since, there is no coal spontaneous combustion. K19L 54.7 II Medium Since, there is no coal spontaneous combustion. K14 53.2 II Medium Since, there is no coal spontaneous combustion. K13 53.1 II Medium Since, there is no coal spontaneous combustion. K12 53.0 II Medium Since, there is no coal spontaneous combustion. K10 65.0 II Medium Since, there is no coal spontaneous combustion. K9 49.4 II Medium Since, there is no coal spontaneous combustion. K8 55.0 II Medium Since, there is no coal spontaneous combustion. K6 57.4 II Medium Since, there is no coal spontaneous combustion.
124
seam) of Tazareh was selected. Tazareh is located in the north east of Iran (Fig. 6).Figure 6. Tazareh coal mines in Eastern Alborz, Iran.
4. Results
Each seam should be rated as to calculate the intrinsic, geological and mining characteristics
related Coal Spontaneous Combustion
Potential index(CSCPi). The rating of the each
layer is presented in Table 6. It should be noted that to obtain the intrinsic, geological and mining characteristics for each layer, field sampling and laboratory works were carried out. The full account of which was considered to fall beyond the scope of the study.
After calculating the CSCP index for each seam, it can be classified each seam which are according to value ranges presented in Table 5. The proposed classification is given in Table 7. It bears noting that the presented classification and indexing should be validated by the events which occurred in the past. The comparison of results between classification and events which occurred in the past were demonstrated relatively good concordance. This suggests that the use of a systematic approach in analyzing the potential of coal spontaneous combustion layers in large scale and in the issues of multiple factors can be very useful.
5. Discussion and Conclusion
The results of this case study indicate that using systematic approach in analyzing of the potential of coal spontaneous combustion layers in large scale and in the issues of multiple factors can be very useful.
In this approach, the effect of each parameter on coal spontaneous combustion potential production is evaluated. For this reason, the classification resulting from this method is highly reliable and presents a comprehensive view of the situation about the case study.
Thus, in this study, after initial studies, the most important parameters affecting coal
spontaneous combustion creation (15
parameters) were selected, and the whole rock engineering systems approach was formulated. Information has important practical use and, for instance, has implications on site characterization, since it allows the designer to
identify parameters that should be
characterized in more detail in any particular case. For example, results show that the
parameter “extraction method” (P11) has the
highest expected interaction with the system.
Similarly, “rank of coal” (P1), “depth of cover”
(P6), “rate of advance” (P13) and “exploitation
factor” (P15) are also quite significant
parameters. Parameters’ values were rated based on their effects on the coal spontaneous combustion. The rating of the each layer was calculated. Comparing the results of this classification and events occurred in each class in the past times indicated relatively good concordance.
Acknowledgements
The authors wish to thanks the Eastern Alborz coal mines company management for their appreciable cooperation and support.
References
[1]. Lang, L., Fu-bao, Z., 2010. A
comprehensive hazard evaluation system for spontaneous combustion of coal in underground mining. International Journal of Coal Geology 82, p.27-36.
[2]. Chandra, D., Prasad, Y.V.S., 1990. Effect of coalification on spontaneous combustion of coals. International Journal of Coal Geology 16, p.225-229.
125
[4]. Grewer, T., 1994. Thermal hazards ofchemical reaction. Industrial Safety Series, Elsevier Press, Amsterdam.
[5]. Sensogut C., 1999. Spontaneous
combustion related fire ratios. Jounal of Engineering Sciences 5, p.1009-1014. [6]. Beamish, B.B., Lau, A.G., Moodie, A.L.,
Vallance, T.A., 2002. Assessing the self-heating behavior of Callide coal using a 2-metre column. Journal of Loss Prevention in the Process Industries 15, p.385-390. [7]. Michaylov M., 2002. Expert system for
assessment of risk from spontaneous
combustion. Mining and Mineral
Processing 44-45, p.27-35.
[8] Singh R.N., Shonhardt J.A., Terezopoulos N., 2002. A new dimension to studies of spontaneous combustion of coal. Mineral Resources Engineering 11, p.147-163. [9]. Zhou, F.B., Wang, D.M., 2004. Directory
of recent testing methods for the propensity of coal to spontaneous combustion. Journal of Fire Sciences 22, p.91-96.
[10]. Hudson, J., 1992. Rock Engineering Systems: Theory and Practice. Ellis Horwood, Chichester.
[11]. Skagius, K., Wiborgh, M., Strom, A., Moren, L., 1997. Performance assessment of the geosphere barrier of a deep geological repository for spent fuel: the use of interaction matrices for identification, structuring and ranking of features, events and processes. Nuclear Engineering and Design 176, p.155-162.
[12]. Matthews, M., Lloyd, B.J., 1998. The river test catchment surveillance project, South Water Utilities. Final Research Report. Department of Civil Engineering, University of Surrey, UK.
[13]. Avila, R., Moberg, L., 1999. A systematic approach to the migration of
137Cs in forest ecosystems using
interaction matrices. Environmental
Radioactivity 45, p.271-282.
[14]. Velasco, H.R., Ayub, J.J., Belli, M., Sansone, U., 2006. Interaction matrices as a first step toward a general model of radionuclide cycling: application to the 137Cs behavior in a grassland ecosystem. Journal of Radioanalytical and Nuclear Chemistry 268, p.503-509.
[15]. Van Dorp, F., Egan, M., Kessler, J.H., Nilsson, S., Pinedo, P., Smith, G., Torres, C., 1999. Biosphere modeling for the
assessment of radioactive waste
repositories: the development of a common basis by the BIOMOVS II Reference Biospheres Working Group. Environmental Radioactivity 42, p.225-236.
[16]. Aguero, A., Pinedo, P., Simon, I., Cancio, D., Moraleda, M., Trueba, C., Perez-Sanchez, D., 2008. Application of the
Spanish methodological approach for
biosphere assessment to a generic high-level waste disposal site. Science of the Total Environment 403, p.34-58.
[17]. Mavroulidou, M., Hughes, S.J.,
Hellawell, E.E., 2004. A qualitative tool combining an interaction matrix and a GIS, to map vulnerability to traffic induced air
pollution. Journal of Environmental
Management 70, p.283-289.
[18]. Condor, J., Asghari, K., 2009. An alternative theoretical methodology for monitoring the risks of CO 2 leakage from wellbore. Energy Procedia 1, p.2599-2605. [19]. Frough, O., Torabi, S.R., 2013. An
application of rock engineering systems for estimating TBM downtimes. Engineering Geology 157, p.112-123.
[20]. Mazzoccola, D.F., Hudson, J.A., 1996. A comprehensive method of rock mass characterization for indicating natural slope
instability. Quarterly Journal of
Engineering Geology 29, p.37-56.
[21]. Castaldini, D., Genevois, R., Panizza, M., Puccinelli, A., Berti, M., Simoni, A., 1998. An integrated approach for analyzing earthquake-induced surface effects: a case study from the Northern Apennines, Italy. Journal of Geodynamics 26, p.413-441. [22]. Zhang, L.Q., Yang, Z.F., Liao, Q.L.,
Chen, J., 2004. An application of the rock engineering systems (RES) methodology in rock fall hazard assessment on the
Chengdu–Lhasa Highway, China.
International Journal of Rock Mechanics and Mining Sciences, p.833-838.
126
Highway. Geosciences Journal 37, p.839-853.[24]. Budetta, P., Santo, A., Vivenzio, F., 2008. Landslide hazard mapping along the coastline of the Cilento Region (Italy) by means of a GIS-based parameter rating approach. Geomorphology 94, p.340-352. [25]. Ceryan, N., Ceryan, S., 2008. An
application of the interaction matrices method for slope, failure susceptibility
zoning: Dogankent settlement area
(Giresun, NE Turkey). Bulletin of
Engineering Geology and the Environment 67, p.375-385.
[26]. Rozos, D., Pyrgiotis, L., Skias, S., Tsagaratos, P., 2008. An implementation of rock engineering system for ranking the instability potential of natural slopes in Greek territory. An application in Karditsa County. Landslides 5, p.261-270.
[27]. Zare Naghadehi, M., Jimenez, R., KhaloKakaie, R., Jalali, S.M. Esmaeil, 2011. A probabilistic systems methodology to analyze the importance of factors affecting the stability of rock slopes. Engineering Geology 118, p.82-92.
[28]. KhaloKakaie, R., Zare Naghadehi, M., 2012. The assessment of rock slope instability along the Khosh-Yeylagh main road (Iran) using a systems approach. Environment Earth Science 67, p.665-668. [29]. Zare Naghadehi, M., Jimenez, R.,
KhaloKakaie, R., Jalali, S.M. Esmaeil, 2013. A new open-pit mine slope instability index defined using the improved rock engineering systems approach. International Journal of Rock Mechanics & Mining Sciences 61, p.1-14.
[30]. Shang, Y.J., Wang, S.J., Li, G.C., Yang, Z.F., 2000. Retrospective case example using a comprehensive suitability index (CSI) for siting the Shisan-Ling power station, China. International Journal of Rock Mechanics and Mining Sciences 37, p.839-853.
[31]. Benardos, A.G., Kaliampakos, D.C., 2004. A methodology for assessing geotechnical hazards for TBM tunneling- illustrated by the Athens Metro, Greece. International Journal of Rock Mechanics and Mining Sciences 41, p.987-999.
[32]. Shin, H., Kwon, Y., Jung, Y., Bae, G.,
Kim, Y., 2009. Methodology for
quantitative hazard assessment for tunnel collapses based on case histories in Korea. International Journal of Rock Mechanics and Mining Sciences 46, p.1072-1087. [33]. Huang, R., Huang, J., Ju, N., Li, Y.,
2013. Automated tunnel rock classification
using rock engineering systems.
Engineering Geology 156, p.20-27.
[34]. Latham, J.-P., Lu, P., 1999. Development of an assessment system for the blast ability of rock masses. International Journal of Rock Mechanics and Mining Sciences 36, p.41-55.
[35]. Anderiux, P., Hadjigeorgiou, J., 2008. The destressability index methodology for the assessment of the likelihood of success of a large-scale confined destress blast in an underground mine pillar. International Journal of Rock Mechanics and Mining Sciences 45, p.407-421.
[36]. Faramarzi, F., Mansouri, H., Ebrahimi Farsangi, M.A., 2013. A rock engineering systems based model to predict rock fragmentation by blasting. International Journal of Rock Mechanics & Mining Sciences 60, p.82-94.
[37]. Hudson, J., Harrison, J.P., 1992.
Engineering Rock Mechanics- An
Introduction to the Principles, Pergamon, First edition.
[38]. Banerjee S.C., 1982. A Theoretical Design to the Determination of Risk Index of Spontaneous Fires in Coal Mines. Journals of Mines, Metals & Fuels 30, 399-406.
[39]. Banerjee S.C., 1985. Spontaneous Combustion of Coal and Mine Fire. Dhanbad-India: Central Mining Research Station., Oxford & IBH Publishing.
[40]. Mitchell D.W., 1990. MINE FIRES Prevention, Detection, Fighting. United States of America: Maclean Hunter Publishing Company.
[41]. Sujanti W., Zhang D-K., Chen X.D., 1999. Low-temperature oxidation of coal studied using wire-mesh reactors with both
steady-state and transient methods.
Combustion and Flame 117, p.646-651. [42]. Beamish B.B., Barakat M.A., George
127
propensity of New Zealand coals under adiabatic conditions. International Journal of Coal Geolog 45, p.217-224.[43]. Beamish B.B., 2005. Comparison of the
R70 self-heating rate of New Zealand and
Australian coals to Suggate rank parameter. International Journal of Coal Geology 64, p.139-144.
[44]. Beamish B.B., Blazak D.G., 2005.
Relationship between ash content and R70
self-heating rate of Callide Coal.
International Journal of Coal Geology 64, p.126-132.
[45]. Beamish B.B., Jabouri I., 2005. Factors Affecting Hot Spot Development in Bulk Coal and Associated Gas Evolution. Coal
Operators' Conference, University of
Wollongong, Australia, p.187-193.
[46]. Beamish B.B., Blazak D.G., Hogarth L.C., Jabouri I., 2005. R70 Relationships and Their Interpretation at a Mine Site. Coal Operators' Conference, University of Wollongong, Australia, p.183-185.
[47]. Ren T.X., Balusu R., 2005. CFD Modelling of Goaf Gas Migration to Improve the Control of Spontaneous Combustion in Longwalls. Coal Operators' Conference, University of Wollongong, Australia, p.259-264.
[48]. Ramlu M.A., 2007. Mine Disasters and Mine Rescue. 2nd edition, chapter-1, “mine fires”, Hyderabad: Universities Press. [49]. Beamish B.B., Arisoy A., 2008. Effect of
intrinsic coal properties on self-heating
rates. 12th U.S./North American Mine
Ventilation Symposium (The Society of
Mining, Metallurgy and Exploration Inc.), Littleton, USA, p.149-153.
[50]. Beamish B.B., Sainsbury W., 2008. Development of a Site Specific Self-Heating Rate Prediction Equation for a High Volatile Bituminous Coal. Coal
Operators' Conference, University of
Wollongong, Australia, p.161-165.
[51]. Humphries P., Poulsen B., 2008. Geological and Geotechnical Influences on the Caveability and Drawability of Top Coal in Longwalls. Coal Operators' Conference, University of Wollongong, Australia, p.56-66.
[52]. Bo-tao Q., Qing-guo S., De-ming W., Lei-lin Z., Qin X., 2009. Analysis and key control technologies to prevent spontaneous coal combustion occurring at a fully
mechanized caving face with large
obliquity in deep mines. Journal of Mining Science and Technology 19, p.446-451. [53]. Beamish B., Beamish R., 2010.
Benchmarking moist coal adiabatic oven
testing. Coal Operators' Conference,
University of Wollongong, Australia, p.264-268.
[54]. Beamish B.B., Beamish R., 2011. Experience with Using a Moist Coal Adiabatic Oven Testing Method for Spontaneous Combustion Assessment. Coal
Operators' Conference, University of
Wollongong, Australia, p.380-384.
![Table 1. Expert semi-quantitative (ESQ) method for interaction matrix coding [10, 20]](https://thumb-us.123doks.com/thumbv2/123dok_us/8957476.1866844/3.595.331.509.122.451/table-expert-semi-quantitative-method-interaction-matrix-coding.webp)
![Figure 2. Summation of coding values in the row and column through each parameter to establish the cause and effect coordinates [37]](https://thumb-us.123doks.com/thumbv2/123dok_us/8957476.1866844/4.595.82.516.381.715/figure-summation-coding-values-column-parameter-establish-coordinates.webp)

![Table 5. Classification of the coal spontaneous combustion potential index [20]. Risk significance Low Medium](https://thumb-us.123doks.com/thumbv2/123dok_us/8957476.1866844/8.595.64.530.637.710/table-classication-spontaneous-combustion-potential-index-signicance-medium.webp)


