The Impact of Bank's Asset and Liability Structure on
their Profitability Regardless of Monetary Policy and
Size: A Panel Analysis
Osama Wagdi (Corresponding author)
Financial Institutions Department, Faculty of Management
Modern University for Technology and Information, Cairo, Egypt
E-mails: [email protected]
Amira Hasaneen
Accounting Department, Faculty of Management,
Modern University for Technology and Information, Cairo, Egypt
Walid Abouzeid
Business Administration Department
International Academy for Engineering and Media Science - IAEMS
6th of October City, Egypt
Received: October 20, 2019 Accepted: Dec. 20, 2019 Published: December 20, 2019
doi:10.5296/ajfa.v11i2.15645 URL: https://doi.org/10.5296/ajfa.v11i2.15645
Abstract
2019, Vol. 11, No. 2
for "Return on Equity" more that to "Return on Asset". Therefore, the banking units should work to maintain the optimal rate of the structure of the bank's assets and liabilities; this may be a potential research scope in banks.
Keywords: Banking structure; Banking profitability; Egypt, Panel analysis
JEL Codes: G2; M2; M4
Introduction
Two traditional roles that banks perform in the economy are to create liquidity and transform risk (Bhattacharya & Thakor, 1993; Berger & Bouwman, 2009). Financial innovation over the last few decades has spurred value creation in the forms of risk sharing and risk management in the banking sector. Allen and Santomero (1997) and Scholtens and van Wensveen (2003) argue that these changes have increasingly shifted banks away from their traditional activities. Instead, they suggest that banks are making increasing use of the financial markets to transfer, transform, and redistribute risk.
Liquidity plays an enormous role in financial crises. In the classic model of Diamond and Dybvig (1983), the illiquidity of bank assets coupled with the liquidity promised through bank liabilities leaves banks vulnerable to runs and financial crises. During the 2007 to 2009 financial crisis, the U.S. government provided several trillion dollars of reserves to the financial sector to forestall and ameliorate a liquidity crisis.
The study finds that the bank's characteristics of the structure has been affected by these developments in the business environment, through the introduction of non-conventional financial instruments, which leads banks to become vulnerable to more risks in the light of targeting to maximize the return on assets.so; The performance of banking units is influenced by both liquidity levels as well as the ability to provide loans in addition to taking advantage of investment opportunities; all that is the bank's characteristics of the structure.
Literature review
relationship between bank profitability and monetary policy (Demertzis and Wolff, 2016; Borio et. al.m 2017; Altavilla et al., 2018). Kashyap and Stein (2000) found a relationship between monetary policy changes and loan growth; according to the standard monetary transmission mechanisms prediction (see Mishkin, 1995). Den Haan et al. (2007) showed that commercial lending increases while real estate loans decrease sharply after monetary policy tightening.
Many studies were conducted to determine the profitability in general and, in particular, the determinants of banks ' profitability. Nevertheless, many of the studies in developed markets are carried out, emerging markets. (Ayanda et al., 2013)
According to Ayanda et al. (2013) the term profitability refers to the ability of the business organization to maintain its profit year after year. Profitability of a bank according to Podder (2012) is the efficiency of a bank at generating earnings. Profitability apart from ensuring the sustainability of the companies it has also wider implications of the economy as a whole. According to Ayanda et al. (2013) generally profitability of organizations contributes to the economic development of the nation by way of providing additional employment and tax revenue to government. Ayanda et al. (2013) further state that profitability contribute the income of the investors by having a higher dividend and thereby improve the standard of living of the people. On the other hand, however in relation to the banks poor profitability can lead to banking failure and crisis which have dire negative repercussions on the economic growth (Ongore and Kusa, 2013) and the wellbeing of the people.
The soundness of the banking sector is highly important to the whole economy. (Sufian and Chong, 2008). In agreement Katrodia (2012) posited that they are closely related. In contrast, the soundness of a bank depends largely on its financial performance, which shows a bank's strength and weakness (Makkar and Singh, 2013). One of the groups for bank's KPIs are evaluated by the profitability. Banks ultimately rely on their survival on their profitability. This is because the banks have to generate the revenue needed to offset the operating costs incurred (Ongore and Kusa, 2013). In fact, investors profit from their savings, which also encourages additional investment in units of bank (Ongore and Kusa, 2013). Ultimately, banks continue to operate because they expect profit; therefore, the most rational decision to leave once that expectation is proven unattainable (Ayanda et al., 2013). Ongore and Kusa (2013) asserted that gain is the commercial banks ' ultimate goal and that therefore, all the policies and activities planned and executed aim to achieve this essential purpose. However, Ongore and Kusa (2013) explained that this does not mean that commercial banks have no other aims. In reality it also has social and economic additional priorities.
2019, Vol. 11, No. 2
its peak during 2008-2009. This resulted in falling profitability, low liquidity and deteriorating credit quality in the Banking sector. Still within Africa, Ayanda et al. (2013) Results revealed in Nigeria that contrary to views of some authors, Bank Size and Cost Efficiency did not significantly determine bank profitability. However, Credit Risk and Capital Adequacy have significant drivers which affected bank profitability both in the long run and short run respectively. But, while Liquidity affected bank profitability in the short run, labor efficiency only affected bank profitability in the long run. In Kenya , according to Ongore and Kusa (2013). The results highlighted that bank specific factors significantly affect the performance of commercial banks; except for liquidity variable. On the other hand, the overall impact of macroeconomic variables was not definitive;
As for the Islamic bank; Bashir (2003) found high capital-to asset and loan-to-asset ratios lead to higher profitability. In addition, there is evidence that indicate that foreign-owned banks are likely to be profitable. On the other hand; Haron (2004) found that internal factors like liquidity, gross investment, Islamic securities fund and profit-sharing ratio ratios between the lender and the borrower are highly related to the rate of total income earned. External factors such as interest rates, market share and bank size are similarly affected. Certain determinants like the funds invested in the current accounts, the share of income between banks and depositors and the supply of liquidity also play an important role in affecting the profitability of Islamic banks. In India; Makkar and Singh (2013) the results revealed significant difference in the capital adequacy, asset quality and earning capacity of public and private sector banks. In contrast, they found no significant difference in the management, liquidity position and sensitivity to market risk of the two different banking groups.
In addition to several studies that used the method of case study analysis of the profitability of banks: Almazari (2012) ; Alkhatib and Harsheh (2012); Alalaya and Al Khattab (2015); Dehghan and Shamsi (2015); Ramlan and Adnan (2016); Dewi et. al. (2016); Abbas et. al. (2019); Setiawan et. al., (2019).
efficiently the resources of the company are used to generate the income (Ongore and Kusa, 2013). The problem of ROA is that it excludes off-balance sheet items of the bank creating a positive bias in evaluating bank performance (Davydenko, 2011). Another related ratio is called return on equity (ROE) which measures how much profit a company earned compared to the total amount of shareholder equity invested or found on the balance sheet. It is the rate of return to shareholders or the percentage return on each unit of equity invested in the bank (Kumbirai and Webb, 2010). A business that has a high return on equity is more likely to be one that is capable of generating cash internally (Ongore and Kusa, 2013).
Kalluci (2011) it is better to look at both ROA and ROE, citing that even though they differ from each other and express different aspects, they both remain two main indicators of management efficiency towards generating income from the money invested by the shareholders and the total investments made in assets, as well. However, of the two, extant literature favors of ROA to ROE (Davydenko, 2011). One of the stated reasons is that ROE does not provide an indication for the bank’s financing through borrowing, whereas ROA does (Kalluci, 2011), thus ROE gives limited insight about the bank profitability and performance (Alkhatib and Harsheh, 2012). The study therefore employs ROA as the proxy of internal profitability.
Both ROA and ROE uses the accounting book values however they can be adjusted to take into account the market values through the calculation of earnings yield found by earnings per share divided by the share price. According to Sangoi (2011) earnings yield is an important indicator of future profitability of the company per the assessment of the market. A high earnings yield indicates that the market is assuming a lower future growth in profits and a low EY indicates expectation by the market for high profit growth for an extended period of time. The study employs earnings yield as the proxy for external profitability. In relation to the determinants of profitability Ayanda et al. (2013) categorized them into two namely; endogenous (internal) and exogenous (external) factors.
2019, Vol. 11, No. 2
financial performance for financial institutions include the bank’s size, its assets management, leverage ratio, operational efficiency ratio, its portfolio composition, and credit risk.
The main motivation behind this study is to examine the relationship between banks profitability and bank's characteristics of structure. An additional and interconnected motivation is to test whether shifting bank loan portfolios, as suggested by Den Haan, Sumner, and Yamashiro (2007), may help to explain some of the relationship between loan growth and changes in characteristics of structure without economic policy and effect of bank size.
The analysis contributes to and extends the broad monetary literature by examining banks grouped by different types of profitability measurements to see if they behave differently under the same monetary policy in regard to their loan growth and the loan portfolio mix between real estate and commercial loans. To the best of my knowledge, such an analysis of a bank's loan portfolio mix; These estimations help to extend and fill in the gaps in the related literature conducted by Den Haan et al. (2007) and Black and Rosen (2007), which raised questions regarding how changes in monetary policy can cause banks to shift their loan portfolios. In contrast, the traditional monetary literature focuses on bank capital, deposits, and interest rates as important determinates of loan growth, with little attention given to the role of bank profitability. Examples of such traditional studies include those by Kashyap and Stein (2000) and Kishan and Opiela (2000, 2006).
Hence; this study analyzes the impact of changes in bank's characteristics of the structure and the levels of deposit employment on the profitability of banks, which assists these institutions to achieve the highest profitability possible through risk-return trade off without monetary policy and effect of bank size.
Study Problem
There are many studies to indicate the impact of monetary policies on the profitability of banks, this fact now and not tested, now we are observing the impact of the characteristics of the structure of the bank on its profitability without the impact of monetary policy (interest rate / legal reserve rate); therefore the study addresses the following question:
Study layout
The general framework of the study can be viewed in the following figure; According to the this figure, economic policies affect the structure of bank assets and liabilities through monetary and fiscal policies. Monetary policy is more influential in the banking sector compared to fiscal policy, which is reflected in five sets of indicators of the bank's asset and liability structure: "Liquid assets to deposits ratio", "Investments to deposits ratio", "Loans to total assets ratio", "Liquid assets to total assets ratio" and "financial investments to total assets ratio"-. This is reflected in the profitability indicators of banks such as "Return on Assets" and "Return on Equity"
Figure 1. Study layout Bank Size
Monetary policies
Fiscal Policy
S
tr
uc
tu
re
o
f
th
e
B
an
k'
s
as
se
ts
a
nd
li
ab
ili
tie
s
Liquid assets to deposits
ratio
Investments to deposits
ratio
Loans to total assets
ratio
Liquid assets to total assets ratio
Financial
investments to
total assets
Banking profitability
ROA, ROE
2019, Vol. 11, No. 2
Study Hypotheses
According to study problem and their layout; the researcher can formulate the study hypothesis as follows:
There is an impact of the bank's asset and liability structure on their profitability
Therefore, sub-hypotheses can be examined as follows
(H1) There is an impact of the bank's asset and liability structure on their profitability according
to "Return on Assets".
(H2) There is an impact of the bank's asset and liability structure on their profitability according
to "Return on Equity ".
Study Methodology
The study utilizes panel data with cross section analysis on data of 10 unit bank according to annual balance sheet and performance; the data covered the time period 2008-2016
Society and sample
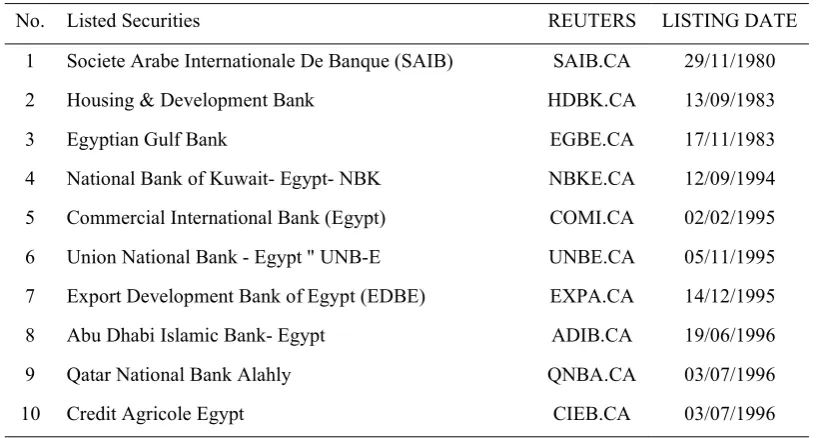
The study sampled banks that are listed on Egyptian Exchange (EGX) as they were palpable to the measurement profitability. There were eleven banks operating in EGYPT; Table 1 listed The Egyptian Banks in the Sample of the Applied Study.
Table 1. The Egyptian Banks in the Sample of the Applied Study
LISTING DATE REUTERS Listed Securities No. 29/11/1980 SAIB.CA
Societe Arabe Internationale De Banque (SAIB) 1
13/09/1983 HDBK.CA
Housing & Development Bank 2
17/11/1983 EGBE.CA
Egyptian Gulf Bank 3
12/09/1994 NBKE.CA
National Bank of Kuwait- Egypt- NBK 4
02/02/1995 COMI.CA
Commercial International Bank (Egypt) 5
05/11/1995 UNBE.CA
Union National Bank - Egypt " UNB-E 6
14/12/1995 EXPA.CA
Export Development Bank of Egypt (EDBE) 7
19/06/1996 ADIB.CA
Abu Dhabi Islamic Bank- Egypt 8
03/07/1996 QNBA.CA
Qatar National Bank Alahly 9
03/07/1996 CIEB.CA
Credit Agricole Egypt 10
Source: The Egyptian Exchange
Variables of Study
Table 2. Variables of Study
No. Variables Description
1 Y1 Return on Assets
2 Y2 Return on Equity
3 X1 Liquid assets to deposits ratio
4 X2 Investments to deposits ratio
5 X3 Loans to total assets ratio
6 X4 Liquid assets to total assets ratio
7 X5 financial investments to total assets ratio
Data Description at Individual Bank Units
The participation of bank units in Egyptian Exchange is relatively a modest one, The following bank's characteristics of the structure and the profit of bank for 10 units in the study sample.
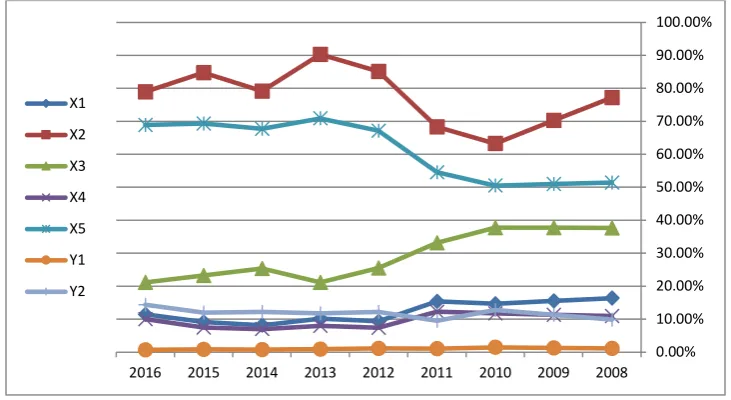
a.Societe Arabe Internationale De Banque (SAIB)
The following figure illustrates the historical evolution of the Bank's structure and profitability indicators during the period from 2008 to 2016
Figure 2. the Bank's structure and profitability indicators for
Source: Authors calculations based on data extracted from financial reports of banking units.
According to the previous figure, the study finds that the highest rate of return on assets is (1.45%) in 2010, but the highest rate of return on equity is (14.39%) in 2016.
b.Housing & Development Bank
The following figure illustrates the historical evolution of the Bank's structure and profitability indicators during the period from 2008 to 2016
0.00% 10.00% 20.00% 30.00% 40.00% 50.00% 60.00% 70.00% 80.00% 90.00% 100.00%
2008 2009 2010 2011 2012 2013 2014 2015 2016 X1
2019, Vol. 11, No. 2
Figure 3. The Bank's structure and profitability indicators for Housing & Development Bank
Source: Authors calculations based on data extracted from financial reports of banking units.
According to the previous figure, the study observes that the highest rate of return on assets is (2.30%) in 2009, but the highest rate of return on equity is (22.53%) in 2009.
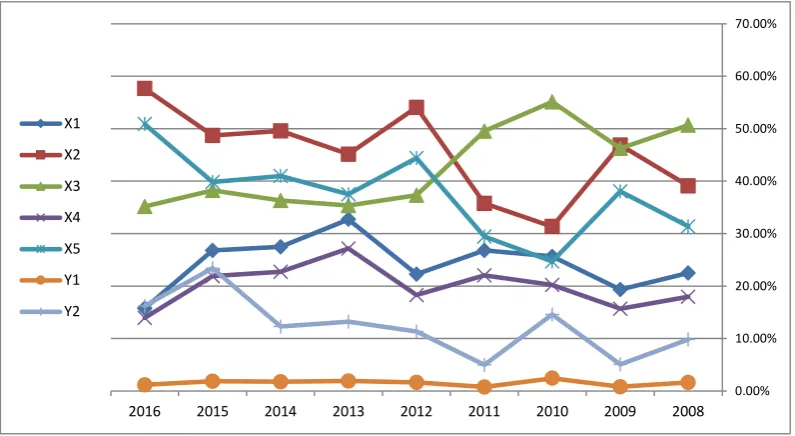
c.Egyptian Gulf Bank
The following figure illustrates the historical evolution of the Bank's structure and profitability indicators during the period from 2008 to 2016
Figure 4. the Bank's structure and profitability indicators for Egyptian Gulf Bank Source: Authors calculations based on data extracted from financial reports of banking units.
0.00% 10.00% 20.00% 30.00% 40.00% 50.00% 60.00% 70.00% 80.00% 90.00%
2008 2009
2010 2011
2012 2013
2014 2015
2016 X1
X2 X3 X4 X5 Y1 Y2
0.00% 10.00% 20.00% 30.00% 40.00% 50.00% 60.00% 70.00%
2008 2009
2010 2011
2012 2013
2014 2015
2016 X1
According to the previous figure, the study observes that the highest rate of return on assets is (2.44) in 2011, but the highest rate of return on equity is (23.42) in 2015.
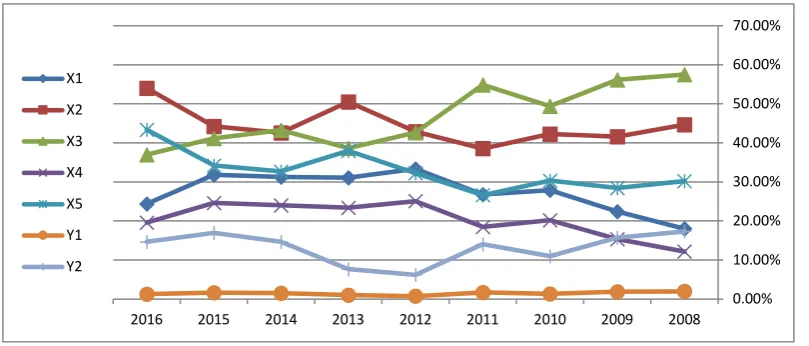
d.National Bank of Kuwait- Egypt- NBK
The following figure illustrates the historical evolution of the Bank's structure and profitability indicators during the period from 2008 to 2016
Figure 5. the Bank's structure and profitability indicators for National Bank of Kuwait
Source: Authors calculations based on data extracted from financial reports of banking units.
According to the previous figure, the study observes that the highest rate of return on assets is (2.76%) in 2008, but the highest rate of return on equity is (24.83%) in 2011.
e.Commercial International Bank (Egypt)
The following figure illustrates the historical evolution of the Bank's structure and profitability indicators during the period from 2008 to 2016
Figure 6. the Bank's structure and profitability indicators for Commercial International Bank (Egypt)
Source: Authors calculations based on data extracted from financial reports of banking units.
0.00% 10.00% 20.00% 30.00% 40.00% 50.00% 60.00% 70.00%
2008 2009
2010 2011
2012 2013
2014 2015
2016 X1
X2 X3 X4 X5 Y1 Y2
0.00% 10.00% 20.00% 30.00% 40.00% 50.00% 60.00%
2008 2009
2010 2011
2012 2013
2014 2015
2016 X1
2019, Vol. 11, No. 2
According to the previous figure, the study finds that the highest rate of return on assets is (2.68%) in 2011, but the highest rate of return on equity is (32.97%) in 2008
f.Union National Bank - Egypt " UNB-E
The following figure illustrates the historical evolution of the Bank's structure and profitability indicators during the period from 2008 to 2016
Figure 7. the Bank's structure and profitability indicators for
Source: Authors calculations based on data extracted from financial reports of banking units.
According to the previous figure, the study finds that the highest rate of return on assets is (1.5) in 2008, but the highest rate of return on equity is (9.04) in 2008.
g.Export Development Bank of Egypt (EDBE)
The following figure illustrates the historical evolution of the Bank's structure and profitability indicators during the period from 2008 to 2016
Figure 8. the Bank's structure and profitability indicators for Export Development Bank of Egypt
According to the previous figure, the study finds that the highest rate of return on assets is (2%) in 2008, but the highest rate of return on equity is (17.37%) in 2008.
h.Abu Dhabi Islamic Bank- Egypt
The following figure illustrates the historical evolution of the Bank's structure and profitability indicators during the period from 2008 to 2016
Figure 9. the Bank's structure and profitability indicators for Source: Authors calculations based on data extracted from financial reports of banking units.
According to the previous figure, the study finds that the highest rate of return on assets is (1.93) in 2008, but the highest rate of return on equity is (17.35% 2008) in
i.Qatar National Bank Alahly
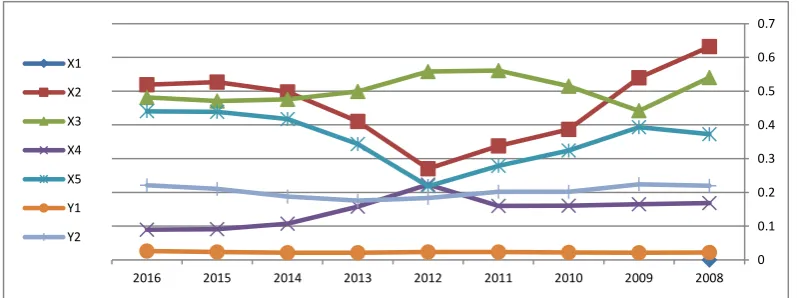
The following figure illustrates the historical evolution of the Bank's structure and profitability indicators during the period from 2008 to 2016
Figure 10. The Bank's structure and profitability indicators for
Source: Authors calculations based on data extracted from financial reports of banking units 0.00% 10.00% 20.00% 30.00% 40.00% 50.00% 60.00% 70.00% 80.00%
2008 2009 2010 2011 2012 2013 2014 2015 2016 X1
X2 X3 X4 X5 Y1 Y2
0 0.1 0.2 0.3 0.4 0.5 0.6 0.7
2008 2009
2010 2011
2012 2013
2014 2015
2016 X1
2019, Vol. 11, No. 2
According to the previous figure, the study finds that the highest rate of return on assets is (2.65%) in 2016, but the highest rate of return on equity is (22.45%) in 2009
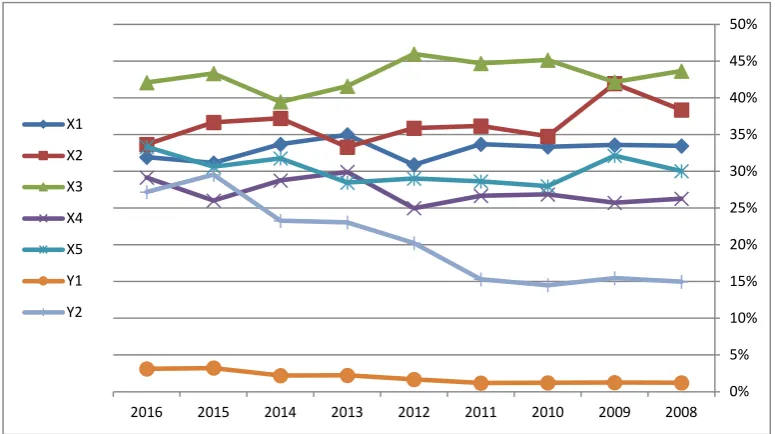
j.Credit Agricole Egypt
The following figure illustrates the historical evolution of the Bank's structure and profitability indicators during the period from 2008 to 2016
Figure 11. the Bank's structure and profitability indicators for
Source: Authors calculations based on data extracted from financial reports of banking units.
According to the previous figure, the study finds that the highest rate of return on assets is (3.24%) in 2015, but the highest rate of return on equity is (29.55%) in 2015.
0% 5% 10% 15% 20% 25% 30% 35% 40% 45% 50%
2008 2009 2010 2011 2012 2013 2014
2015 2016 X1
Examining the impact of the bank's asset and liability structure on banking profitability
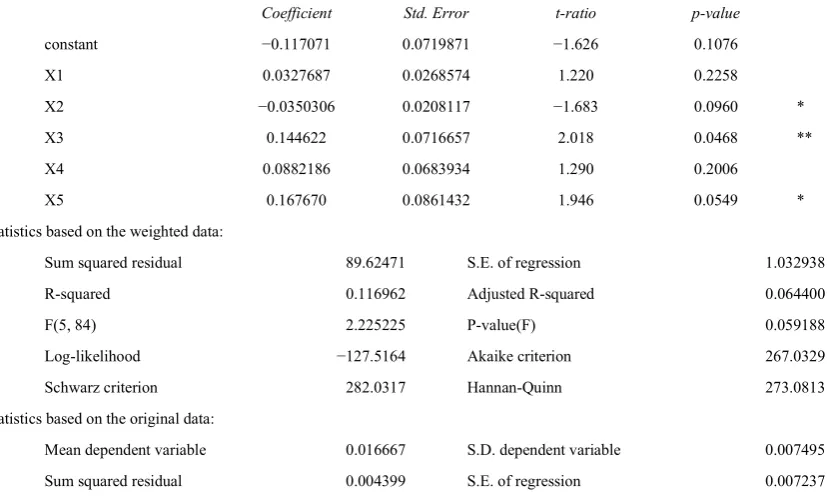
a. ROA
Table 3. Examining H1
Model 2: WLS, using 90 observations
Included 10 cross-sectional units
Dependent variable: Y1
Weights based on per-unit error variances
Coefficient Std. Error t-ratio p-value
constant −0.117071 0.0719871 −1.626 0.1076
X1 0.0327687 0.0268574 1.220 0.2258
X2 −0.0350306 0.0208117 −1.683 0.0960 *
X3 0.144622 0.0716657 2.018 0.0468 **
X4 0.0882186 0.0683934 1.290 0.2006
X5 0.167670 0.0861432 1.946 0.0549 *
Statistics based on the weighted data:
Sum squared residual 89.62471 S.E. of regression 1.032938
R-squared 0.116962 Adjusted R-squared 0.064400
F(5, 84) 2.225225 P-value(F) 0.059188
Log-likelihood −127.5164 Akaike criterion 267.0329
Schwarz criterion 282.0317 Hannan-Quinn 273.0813
Statistics based on the original data:
Mean dependent variable 0.016667 S.D. dependent variable 0.007495
Sum squared residual 0.004399 S.E. of regression 0.007237
Source: Gnu Regression, Econometrics and Time-series Library output.
2019, Vol. 11, No. 2
b. ROE
Table 3. Examining H2
Model 4: WLS, using 90 observations
Included 10 cross-sectional units
Dependent variable: Y2
Weights based on per-unit error variances
Coefficient Std. Error t-ratio p-value
constant −1.49291 0.585038 −2.552 0.0125 **
X1 0.0745095 0.231523 0.3218 0.7484
X2 −0.360735 0.179255 −2.012 0.0474 **
X3 1.71765 0.581691 2.953 0.0041 ***
X4 1.52448 0.540484 2.821 0.0060 ***
X5 2.03829 0.722426 2.821 0.0060 ***
Statistics based on the weighted data:
Sum squared residual 89.64545 S.E. of regression 1.033057
R-squared 0.183525 Adjusted R-squared 0.134925
F(5, 84) 3.776259 P-value(F) 0.003917
Log-likelihood −127.5268 Akaike criterion 267.0537
Schwarz criterion 282.0525 Hannan-Quinn 273.1021
Statistics based on the original data:
Mean dependent variable 0.153222 S.D. dependent variable 0.068200 Sum squared residual 0.352671 S.E. of regression 0.064796
Source: Gnu Regression, Econometrics and Time-series Library output.
The previous statistical results indicate that the impact of the bank's asset and liability structure on banking profitability according to ROE, and Investments to deposits ratio; Loans to total assets ratio; Liquid assets to total assets ratio and financial investments to total assets ratio is significant at 0.05; 0.01; 0.01 and 0.01 levels. According to adjusted R-squared; it interprets (13.49%) of a banking profitability according to ROE. Hence, the study found that there is an impact of the bank's asset and liability structure on their profitability according to "Return on Equity ".
Discussion and conclusions
The study confirmed that there is an impact of the bank's asset and liability structure on their profitability according to "Return on Asset" and "Return on Equity"; but the interprets of bank's asset and liability structure for "Return on Equity" are more that to "Return on Asset".
assets to total assets ratio and financial investments to total assets ratio has an impact on bank's profitability according to "Return on Asset"; these are significant at 0.1; 0.05 and 0.06 levels.
Through the above, the study reveals that the characteristics of the structure of assets and liabilities of the bank act as intermediate variables to convey the impact of economic policies; especially monetary policies (see: Hancock, 1985; Aharony et al., 1986; UDEH, 2015; Alalaya and Al Khattab, 2015; Alessandri and Nelson, 2015; Djalilov and Piesse, 2016; Borio et al., 2017; Altavilla et. al., 2018) ; and the impact of the size of the bank on profitability at different levels (Aladwan, 2015; Menicucci and Paolucci, 2015), in addition to the impact of Development of Regulatory Restrictions from the central bank (Tran et al., 2016; Helmy and Wagdi, 2019).
Recommendations
The study concluded that there is an impact of the bank's asset and liability structure on their profitability according to "Return on Asset" and "Return on Equity". Therefore, the banking units should work to reach the optimal rate of the structure of the bank's assets and liabilities; as this may be a new/potential research scope in banks.
References
Abbas, F., Iqbal, S., & Aziz, B. (2019). The impact of bank capital, bank liquidity and credit risk on profitability in postcrisis period: A comparative study of US and AsiaCogent Economics & Finance, 7(1). https://doi.org/10.1080/23322039.2019.1605683
Aharony, J., Saunders, A., & Swary, I. (1986). The effects of a shift in monetary policy regime on the profitability and risk of commercial banks. Journal of Monetary Economics, 17(3), 363-377. https://doi.org/10.1016/0304-3932(86)90063-2
Aikman, D., & Vlieghe, G. (2004). How much does bank capital matter? Bank of England Quarterly Bulletin, Spring.
Aladwan, M. S. (2015). The impact of bank size on profitability "an empirical study on listed Jordanian commercial banks". European Scientific Journal, 11(34).
Alalaya, M., & Al Khattab, S. A. (2015). A case study in business market: Banks profitability:
Evidence from Jordanian commercial banks (2002-2015). International Journal of Business
Management and Economic Research, 6(4).
Alessandri, P., & Nelson, B. D. (2015). Simple banking profitability and the yield curve.
Journal of Money, Credit and Banking, 47(3). https://doi.org/10.1111/jmcb.12172
Alkhatib A. & Harsheh M. (2012). Financial Performance of Palestinian Commercial Banks.
International Journal of Business and Social Science, 3.
2019, Vol. 11, No. 2
Almazari A. A. (2012). Financial Performance Analysis of the Jordanian Arab Bank by Using the DuPont System of Financial Analysis. International Journal of Economics and Finance, 4(8). https://doi.org/10.5539/ijef.v4n4p86
Altavilla, C., Boucinha, M., & Peydró, J. L. (2018). Monetary policy and bank profitability in
a low interest rate environment. Economic Policy, 33(96).
https://doi.org/10.1093/epolic/eiy013
Ayanda A. M., Christopher E. I. & Mudashiru M. A. (2013). Determinants of banks’ profitability in developing economy: evidence from Nigerian banking industry.
Interdisciplinary Journal of contemporary research in business, 4.
Bank for International Settlement (2012). 82nd annual report. (Basel, Switzerland).
Bashir A. H. M. (2003). Determinants of Profitability in Islamic Banks: Some evidence from the Middle East. Islamic Economic Studies, 11.
Berger, A. N., & Bouwman, C. H. (2009). Bank liquidity creation. The review of financial studies, 22(9). https://doi.org/10.1093/rfs/hhn104
Bernanke, B. S., & Gertler, M. (1987). Banking in general equilibrium. In W. Barnett, & K. Singleton (Eds.), New approaches to monetary economics (pp. 89–111). Cambridge, England: Cambridge University Press. https://doi.org/10.1017/CBO9780511759628.006
Bhattacharya, S., & Thakor, A. V. (1993). Contemporary banking theory. Journal of financial Intermediation, 3(1). https://doi.org/10.1006/jfin.1993.1001
Black, L. K., & Rosen, R. J. (2007). How the credit channel works: Differentiating the bank lending channel and the balance sheet channel (working paper series 2007–13). Chicago, IL: Federal Reserve Bank of Chicago.
Bolton, P., & Freixas, X. (2006). Corporate finance and monetary transmission mechanism.
Review of Financial Studies, 19(3). https://doi.org/10.1093/rfs/hhl002
Borio, C., & Gambacorta, L. (2017). Monetary policy and bank lending in a low interest rate
environment: diminishing effectiveness?. Journal of Macroeconomics, 54.
https://doi.org/10.1016/j.jmacro.2017.02.005
Borio, C., Gambacorta, L., & Hofmann, B. (2015). The influence of monetary policy on bank rofitability (working paper no. 519). Basel, Switzerland: Bank for International Settlement.
Borio, C., Gambacorta, L., & Hofmann, B. (2017). The influence of monetary policy on bank profitability. International Finance, 20(1). https://doi.org/10.1111/infi.12104
Busch, C.M., & Prieto, E. (2014). Do better capitalized banks lend less? Long-run panel evidence from Germany. International Finance, 17(1). https://doi.org/10.1111/infi.12041
Dehghan, M., & Shamsi, B. (2015). The Effect Of Implementing Core Banking Services On Profitability. Case Study: All Branches Of A Private Bank In Mashhad. Studies and Scientific Researches. Economics Edition, (21). https://doi.org/10.29358/sceco.v0i21.300
Demertzis, M., & Wolff, G. B. (2016). What impact does the ECB's quantitative easing policy have on bank profitability? (No. 2016/20). Bruegel Policy Contribution.
Den Haan, W. J., Sumner, S. W., & Yamashiro, G. M. (2007). Banks' loan portfolio and the
monetary transmission mechanism. Journal of Monetary Economics, 54(3).
https://doi.org/10.1016/j.jmoneco.2006.01.008
Dewi, F. S., Arifati, R., & Andini, R. (2016). Analysis of effect of CAR, ROA, LDR, Company Size, NPL, and GCG to Bank Profitability (case study on banking companies listed in BEI period 2010-2013). Journal Of Accounting, 2(2).
Diamond, Douglas, and Phillip Dybvig, (1983), Bank runs, deposit insurance, and liquidity.
Journal of Political Economy, 91. https://doi.org/10.1086/261155
Djalilov, K., & Piesse, J. (2016). Determinants of bank profitability in transition countries: What matters most?. Research in International Business and Finance, 38, 69-82. https://doi.org/10.1016/j.ribaf.2016.03.015
Driscoll, J. C. (2004). Does bank lending affect output? Evidence from the U.S. States. Journal of Monetary Economics, 51(3). https://doi.org/10.1016/j.jmoneco.2004.01.001
English,W. B. (2002). Interest rate risk and bank net interest margins BIS Quarterly Review, December.
Gambacorta, L., & Mistrulli, P. E. (2003). Bank capital and lending behavior: Empirical evidence for Italy. Rome, Italy: Banca d'Italia, Research Department.
Hancock, D. (1985). Bank profitability, interest rates, and monetary policy. Journal of Money, Credit and Banking, 17(2), 189-202. https://doi.org/10.2307/1992333
Handley-Schachler M, Juleff L and Paton C (2007). Corporate governance in the financial services sector. Corporate Governance, 7. https://doi.org/10.1108/14720700710827202
Haron S. (2004). Determinants of Islamic Bank Profitability. KLBS Working Paper Series 002.
Helmy, A., & Wagdi, O. (2019). Three-Dimensional Analysis of Bank Profit with the Development of Regulatory Restrictions: Evidence from Egypt. International Journal of Economics and Finance, 11(3). https://doi.org/10.5539/ijef.v11n3p12
Holmstrom, B., & Tirole, J. (1997). Financial intermediation, loanable funds, and the real sector. Quarterly Journal of Economics, 112(3). https://doi.org/10.1162/003355397555316
2019, Vol. 11, No. 2
Kalluci I. (2011). Analysis of the Albanian banking system in a risk-performance framework. Proceeding of 3rd Annual South-Eastern European Economic Research Workshop, 19-21 November 2009, Bank of Greece & Bank of Albania, Athens.
Kashyap, A. K. (2002). Sorting out Japan's financial crisis. Economic Perspectives, Federal Reserve Bank of Chicago. https://doi.org/10.3386/w9384
Kashyap, A. K., & Stein, J. C. (2000). What do amillion observations on banks say about the
transmission of monetary policy? American Economic Review, 90(3).
https://doi.org/10.1257/aer.90.3.407
Katrodia A. (2012). Corporate Governance Practices in the Banking Sector. ABHINAV Journal of Research in Commerce & Management, 1.
Kishan, R. P., & Opiela, T. P. (2000). Bank size, bank capital and the bank lending channel.
Journal of Money, Credit and Banking, 32(1). https://doi.org/10.2307/2601095
Kukao, M. (2003). Financial sector profitability and the double gearing. Structural impediments to growth in Japan. Chicago, IL: University of Chicago Press.
Kumbirai M. and Webb R. (2010). A financial Ratio Analysis of Commercial Bank Performance in South Africa. African Review of Economics and Finance, 2.
Makkar A. & Singh S. (2013). Analysis of the Financial Performance of Indian Commercial Banks: A Comparative Study. Indian Journal of Finance, 7.
Mankiw, G. (1986). The allocation of credit and financial collapse. Quarterly Journal of Economics, 101(3). https://doi.org/10.2307/1885692
Meh, C., &Moran, K. (2004). Bank capital, agency costs, andmonetary policy (working paper no. 2004–6). Ottawa: Bank of Canada.
Menicucci, E., & Paolucci, G. (2016). The determinants of bank profitability: empirical evidence from European banking sector. Journal of Financial Reporting and Accounting, 14(1). https://doi.org/10.1108/JFRA-05-2015-0060
Mishkin, F. S. (1995). Symposium on the monetary transmission mechanism. The Journal of
Economic Perspectives, 9(4). https://doi.org/10.1257/jep.9.4.3
Nier, E., & Zicchino, L. (2006). Bank weakness, loan supply, andmonetary policy. Bank of England (Work in Progress).
Ongore V. O. & Kusa G. B. (2013). Determinants of Financial Performance of Commercial Banks in Kenya. International Journal of Economics and Financial Issues, 3.
Ramlan, H., & Adnan, M. S. (2016). The profitability of Islamic and conventional bank: Case study in Malaysia. Procedia Economics and Finance, 35. https://doi.org/10.1016/S2212-5671(16)00044-7
Sangoi D. (2011). Keep an eye on the earning yield of equity vs. bonds. [Online] Available: www.indianexpress.com (30 December 2013).
Scholtens, B., & Van Wensveen, D. (2003). The theory of financial intermediation: an essay on what it does (not) explain (No. 2003/1). SUERF Studies.
Setiawan, M., Amboningtyas, D., & Aryanti, R. P. (2019). Analysis Of Non Performing Loan (Npl), Capital Adequacy Ratio (Car), And Operational Costs With Operational Income (Bopo) That Impact On Profitability (Case Study In PT. BPR In Semarang Area 2013-2017). Journal of Management, 5(5).
Siddiqui M. A. and Shoaib A. (2011). Measuring performance through capital structure: Evidence from banking sector of Pakistan. African Journal of Business Management, 5.
Sufian F. and Chong R. R. (2008). Determinants of bank profitability in developing economy: Empirical vidence from the Philippines. Asian Academy of Management Journal of accounting and finance, 4.
Tran, V. T., Lin, C. T., & Nguyen, H. (2016). Liquidity creation, regulatory capital, and bank
profitability. International Review of Financial Analysis, 48.
https://doi.org/10.1016/j.irfa.2016.09.010